Interface Utilization With Forecast report
Interface Utilization With Forecast report overview
The Interface Utilization With Forecast report provides forecast utilization data for a single interface.
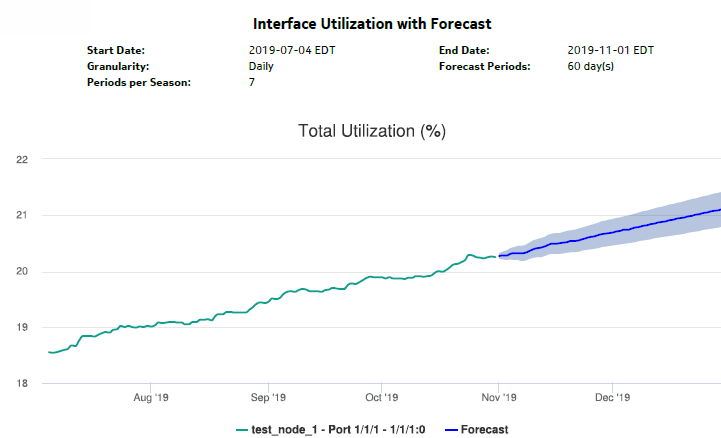
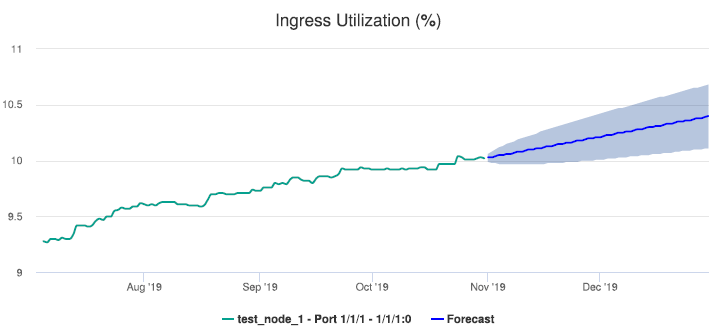
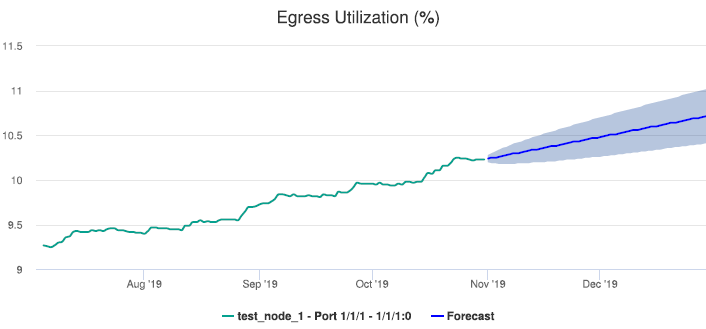
The default display is a set of graphs showing total, ingress, and egress traffic.
To generate a forecast, you must provide at least two seasons of data, although more may be required if the input data is not linear. For example, if you choose a seasonality value of 7 and the granularity is daily, you must use a report range of at least 14 days.
When the forecast algorithm fails, a pop-up message displays with the recommendation that you either lower the seasonality value or increase the report range.
You may consider scheduling the report, as it takes several minutes to generate.
Use cases
Capacity planning—Use the report to examine interface utilization patterns for planning future capacity requirements.
Prerequisites
The session time zone must match the aggregation time zone. When these two settings are different, the report does not run correctly and the system returns an error. See section How do I configure the Analytics session time zone? for more information about configuring the session time zone.
To view the report for granularities other than raw data, the aggregation rules must be enabled; see How do I configure analytics aggregation?. The following table describes the aggregation rules and the accounting policies that must be configured for the NEs on which statistics are to be collected; see the NSP NFM-P Statistics Management Guide for information about configuring an accounting policy.
Table 14-33: Interface Utilization With Forecast report prerequisites
|
Aggregator name |
Monitored object class |
Statistics class |
Statistics collection |
Details |
NE types |
|---|---|---|---|---|---|
|
SAP Interface Stats Aggregator Egress |
service.AccessInterface |
service.CompleteServiceEgressPacketOctets |
Accounting, file, and log policies |
completeSvcInEg policy |
7705 SAR 7705 SAR Hm 7750 SR |
|
SAP Interface Stats Aggregator Ingress |
service.AccessInterface |
service.CompleteServiceIngressPacketOctets |
Accounting, file, and log policies |
completeSvcInEg policy |
7250 IXR-R6 7705 SAR 7705 SAR Hm 7750 SR |
|
Service Egress Octets Aggregator |
service.AccessInterface |
service.ServiceEgressOctets |
Accounting, file, and log policies |
svcEgress Octet policy |
7210 SAS-D 7210 SAS Dxp 7210 SAS-K 7210 SAS-M 7210 SAS-Mxp 7210 SAS-R 7210 SAS-S/Sx 7210 SAS-T 7210 SAS-X |
|
Service Ingress Octets Aggregator |
service.AccessInterface |
service.ServiceIngressOctets |
Accounting, file, and log policies |
svcIngressOctet policy |
7210 SAS-D 7210 SAS Dxp 7210 SAS-K 7210 SAS-M 7210 SAS-Mxp 7210 SAS-R 7210 SAS-S/Sx 7210 SAS-T 7210 SAS-X |
|
Mpls Interface Stats Aggregator |
rtr.NetworkInterface |
mpls.MplsInterfaceStats |
Performance statistics |
vRtrMplsIfStatEntry |
7210 SAS 7250 IXR 7705 SAR 7705 SAR Hm 7750-SR Omnisystem NEs |
|
GNE Interface Utilization Stats Aggregator |
genericne.GenericNeInterface |
genericne.InterfaceAdditionalStats |
Performance statistics |
ifXEntry |
Generic NEs |
Note: The report does not support the 7250 IXR, Release 22.0 or later.
Report characteristics
The following table lists the principal report characteristics.


