Node Power and Voltage Summary
Node Power and Voltage Summary report overview
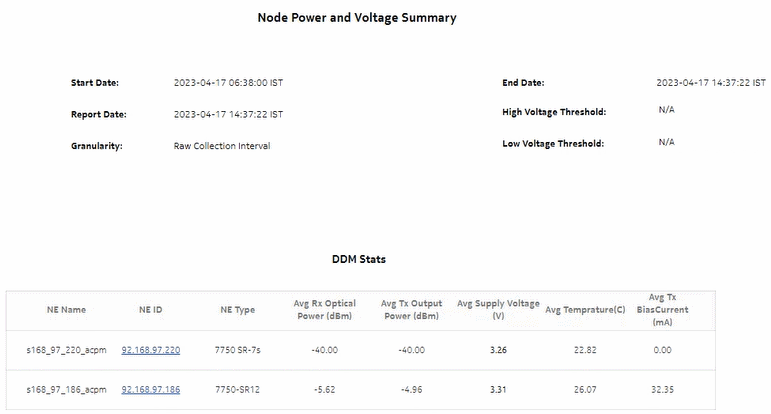
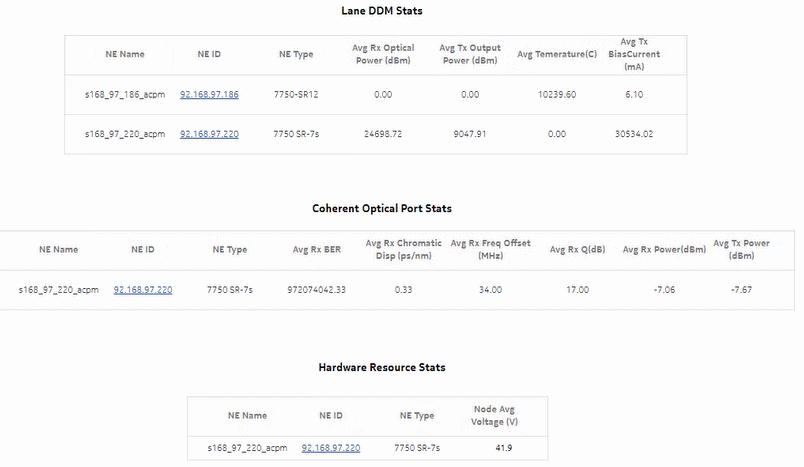
The Node Power and Voltage Summary report shows detailed information about NE power and voltage. The report provides tables showing DDM, lane DDM, coherent optical port, and hardware resource statistics, and can drill down to the Optical Power and Voltage Summary report for more information.
For hardware resource statistics, only minimum and maximum voltage are displayed; there is no average counter.
Limitations
Report limitations include:
-
Low voltage threshold and high voltage threshold report inputs are applicable only to DDM statistics and hardware resource statistics.
-
Periodic counters are used for hardware resource statistics if non-periodic counters are not present in aggregation tables.
Use cases
Troubleshooting—Confirm that NE power is in the optimum operating range to determine if it is a cause of network impairment.
Prerequisites
The following table describes the aggregation rules that must be enabled and the statistics to be collected. To view the report for granularities other than raw data, the aggregation rules must be enabled; see How do I configure analytics aggregation?.
Table 11-7: Node Power and Voltage Summary report prerequisites
|
Aggregator name |
Monitored object class |
Statistics class |
Statistics collection |
MIB name |
NE types |
|---|---|---|---|---|---|
|
DDM stats aggregator |
equipment.Digital DiagnosticMonitoring |
equipment.DDMStats |
MIB-based |
TIMETRA-PORT-MIB.tmnxDigitalDiag MonitorEntry |
7210 SAS-D 7210 SAS-MXP 7210 SAS-R 7250 IXR 7705 SAR 7750 SR |
|
Lane DDM stats aggregator |
equipment.LaneDDM |
equipment, LaneDDMStats |
MIB-based |
tmnxDDMLaneEntry |
7210 SAS-R 7210 SAS-S/Sx 7250 IXR 7450 ESS 7705 SAR-Hm 7750 SR 7950 XRS |
|
Coherent optical port stats aggregator |
equipment.Connector equipment.PhysicalPort |
ethernetequipment CohOptPortStats |
MIB-based |
tmnxCohOptPortStatsEntry |
7250 IXR 7450 ESS 7705 SAR-Hm 7750 SR 7950 XRS |
|
Hardware resource stats aggregator |
equipment.HwEnvironment |
equipment HardwareResourceStats |
MIB-based |
tmnxHwResourceEntry |
7250 IXR 7750 SR 7950 XRS |
Report characteristics
The following table lists the principal report characteristics.
Table 11-8: Node Power and Voltage Summary report characteristics
Example
The following figures show a report example.
Figure 11-5: Node Power and Voltage Summary report

