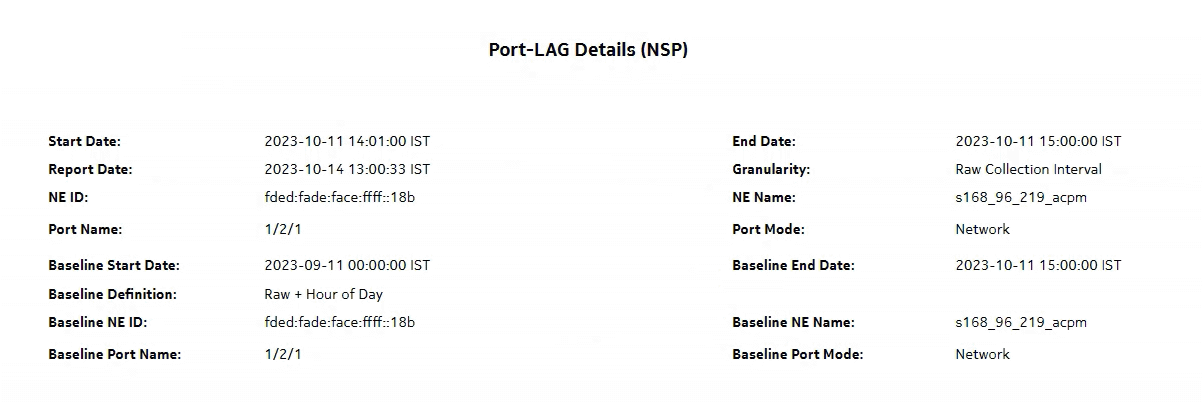
Port-LAG Details (NSP) report
Port-LAG Details (NSP) report overview
The Port-LAG Details (NSP) report includes throughput data for NEs managed by the NFM-P only, by the MDM (model-driven Nokia) only, or NFM-P+MDM-mediated NEs. The content and format of the Port-LAG Details (NSP) report vary from the NFM-P-only Port-LAG Details report to accommodate its model-driven approach. For classic+GRPC NEs, the NE IP must be in IPV4 format. The IPV6 format is currently not supported by the report. The Port-LAG Details (NSP) report shows the throughput and utilization by a specified port, LAG, or MC LAG. For classic+gRPC NEs, the report shows the default NFM-P description in the Physical ports or LAGs or MC LAGs report input if there is no description provided in the port. The default display is a set of time series graphs, showing total, ingress, and egress traffic. The report can be run by itself or as a drill-down from a Port Throughput Summary report. The report can also be displayed along with baseline values. See Baselining in Analytics reports for more information about how baselines are defined.
Additionally, the plot or graph shows the actual values at a specified time.
To enable or disable a baseline box plot, click on the baseline item in the graph legend. When you run the report for MC-LAG or LAG, enable only one baseline legend to align the baseline plot with the axis.
Note: There is a duplication of data in the report inputs when the NEs are dual managed.
Use cases
Capacity planning—Use the report to examine traffic usage and patterns on a port, LAG, or MC LAG basis, to plan for capacity requirements.
Prerequisites
The following table describes the aggregation rules that must be enabled and the accounting policies that must be configured for the NEs on which statistics are to be collected; see the NSP NFM-P Statistics Management Guide for information about configuring an accounting policy. To view the report for granularities other than raw data, the aggregation rules must be enabled; see How do I configure analytics aggregation?.
Table 18-10: Port-LAG Details (NSP) report prerequisites
|
Aggregator name |
Monitored object class |
Statistics class |
Statistics collection |
MIB name |
NE types |
|---|---|---|---|---|---|
|
Interface Utilization Statistics Aggregator |
equipment.PhysicalPort lag.Interface |
equipment.InterfaceAdditionalStats |
Performance statistics |
ifXEntry |
7210 SAS 7250 IXR 7705 SAR 7750 SR |
|
PortNetIngressStats Error Stats Aggregator |
equipment.PhysicalPort |
equipment.PortNetIngressStats |
Performance statistics |
TIMETRA-PORT-MIB.tmnxPortNetIngressStatsEntry |
7705 SAR 7705 SAR-H |
|
PortNetEgressStats Error Stats Aggregator |
equipment.PhysicalPort |
equipment.PortNetEgressStats |
Performance statistics |
TIMETRA-PORT-MIB.tmnxPortNetEgressStatsEntry |
7705 SAR 7705 SAR-H |
|
Dot3Stats Error Stats Aggregator |
equipment.PhysicalPort |
ethernetequipment.Dot3Stats |
Performance statistics |
EtherLike-MIB.dot3StatsEntry |
7210 SAS 7250 IXR 7705 SAR 7750 SR |
|
Interface Error Stats Aggregator |
equipmet.PhysicalPort lag.Interface |
equipment.InterfaceStats |
Performance statistics |
ifEntry |
7210 SAS 7250 IXR 7705 SAR 7750 SR |
|
EthernetStats Error Stats Aggregator |
equipment.PhysicalPort |
ethernetequipment.EthernetStatsLogRecord |
Performance statistics |
etherStatsEntry |
7210 SAS 7250 IXR 7705 SAR-Hm 7750 SR |
|
AdditionalEthernetStats Error Stats Aggregator |
equipment.PhysicalPort |
ethernetequipment. AdditionalEthernetStats |
Performance statistics |
tmnxPortEtherEntry |
7210 SAS 7250 IXR 7705 SAR 7705 SAR-Hm 7750 SR |
|
IngressPortFwdEngDropReasonStats Error Stats Aggregator |
equipment.PhysicalPort |
equipment.IngressPortFwdEngDropReasonStats |
Performance statistics |
TIMETRA-PORT-MIB.tPortIngressFwdEngDRStatsEntry |
7250 IXR 7705 SAR-Hm 7750 SR |
Table 18-11: Port-Lag Details (NSP) report prerequisites for MD-node
|
Aggregator name |
Monitored object class |
Statistics class |
Statistics collection |
NE types |
|---|---|---|---|---|
|
md-aggr:/md-aggr-base/complete-service-egress-packet-octets/complete-service-ingress-packet-octets |
queue-id sap-id statmode |
telemetry:/base/accounting/complete/service/ingress/packet/octets |
Accounting, file and log policies |
7750 MD SR Classic NE with gRPC telemetry collection enabled |
|
md-aggr:/md-aggr-base/complete-service-egress-packet-octets/complete-service-egress-packet-octets |
queue-id sap-id statmode |
telemetry:/base/accounting/complete/service/egress/packet/octets |
Accounting, file and log policies |
7750 MD SR Classic NE with gRPC telemetry collection enabled |
|
md-aggr:/md-aggr-base/telemetry-interfaces/interface |
Telemetry Base Interface |
telemetry:/base/interfaces/interface |
Telemetry Statistics |
7750 MD SR Classic NE with gRPC telemetry collection enabled |
|
md-aggr:/md-aggr-base/telemetry-interfaces/interface-errors |
Telemetry Base Interface errors |
telemetry:/base/interfaces/interface/errors |
Telemetry Statistics |
7750 MD SR Classic NE with gRPC telemetry collection enabled |
Report characteristics
The following table lists the principal report characteristics.
Table 18-12: Port-LAG Details (NSP) report characteristics
Example
The following figures show a report example.


