Uptime reports overview
General information
The Uptime reports display downtime in the HH:MM:SS format. The uptime percentage calculations use milliseconds along with the HH:MM:SS information displayed.
Uptime is calculated as follows:
Uptime %=( [Total Time-Downtime]/Total Time)*100
Where
Downtime is the time for which the SAP or service was down
Total Time is the time span defined in the Report Range field, considering any SAP or service creation and deletion events
If a SAP or service creation or deletion occurred within the report range, the total time would be adjusted accordingly.
For example, if the report range is 10:00:00 to 15:00:00 and there is a creation event at 11:00:00 and a deletion event at 12:00:00, the total time would be from 11:00:00 to 12:00:00.
Prerequisites
The following items need to be performed in the NFM-P for Uptime reports to be created:
-
Configure the retention time for assurance events. The default retention time is one week. The maximum retention time for the auxiliary database is one year, which is recommended.
See the NSP NFM-P Classic Management User Guide for information about event log policies.
-
Enable event logging for the following object types in the Timeline Settings in the NSP.
-
Configure the customer in the NFM-P; see information in the NSP NFM-P Classic Management User Guide about creating a customer profile. Customer names must be unique.
-
Populate the maintenance window table in the auxiliary database with details of NE and Service maintenance; see Analytics maintenance window table.
The report will run if the table is not created or empty; however, maintenance windows are treated as down time when availability is calculated.
Note: Customer Utilization Summary and Customer Uptime Summary reports may not complete if they are run on customers with more than 100 000 services.
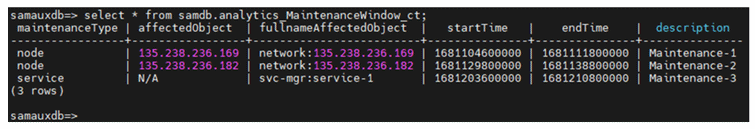
Analytics maintenance window table
The file name of the custom Analytics maintenance window table in the auxiliary database is samdb.analytics_MaintenanceWindow_ct.
Table example
The following table shows an example of the format of the samdb.analytics_MaintenanceWindow_ct table.
Figure 14-6: Example of the samdb.analytics_MaintenanceWindow_ct table format

The following notes apply about the table contents:
-
maintenanceType: one of two case-sensitive strings - node or service
-
affectedObject: system ID or site ID of a NE, or the service name of a service
-
The system address of the NE can be found in the NE Properties form. The service manager service ID can be found in the list of services in Manage→Services→Services.
-
startTime: the start time of the maintenance window. The time is expressed as an epoch value (that is, number of milliseconds since January 1, 1970).
-
endTime: the end time of the maintenance window. This time is also expressed as an epoch value, in milliseconds.
-
description: a description of the object, to appear in the input options. This field is optional.
To insert data into the samdb.analytics_MaintenanceWindow_ct table
-
[root@vnfmp-du-nfmp-22-11-anant-svr-db bin]# cd /opt/nsp/nms/bin ↵
-
Create the .csv file for node availability maintenance window data. For example:
[root@vnfmp-du-nfmp-22-11-anant-svr-db bin]# cat NodeAvailability_Table.csv maintenanceType,affectedObject,fullnameAffectedObject,startTime,endTime,description node,135.238.236.169,network:135.238.236.169,1681104600000,1681111800000,Maintenance-1 node,135.238.236.182,network:135.238.236.182,1681129800000,1681138800000,Maintenance-2 service,N/A,svc-mgr:service-1,1681203600,1681210800,Maintenance-3
Note: The epoch time must be in milliseconds.
-
Execute the following to insert the data from the .cvs file into the samdb.analytics_MaintenanceWindow_ct table:
[root@vnfmp-du-nfmp-22-11-anant-svr-db bin]# ./customData.bash --importData samdb.analytics_MaintenanceWindow_ct NodeAvailability_Table.csv ↵
where
NodeAvailability_Table is the name of the .cvs file
-
Enter a password for the auxiliary database.
The data from the .csv file is imported into samdb.analytics_MaintenanceWindow_ct.
-
Verify in samauxdb that the above entries are inserted: