Emulated Service Details report
Emulated Service Details report overview
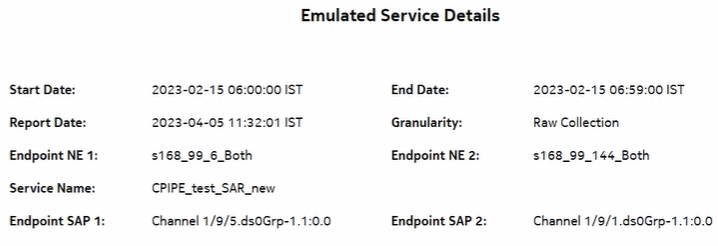
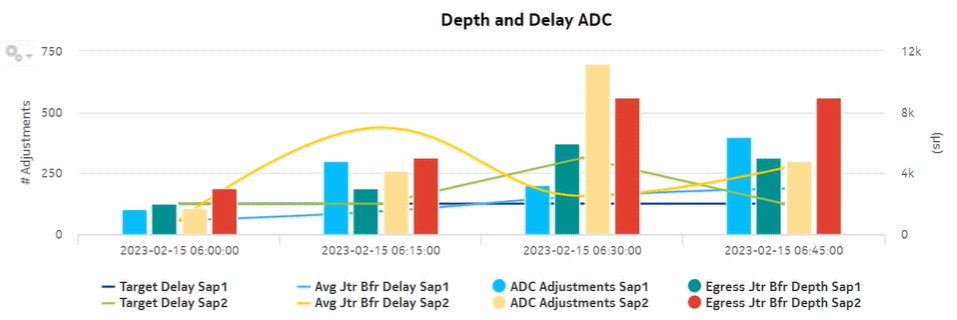
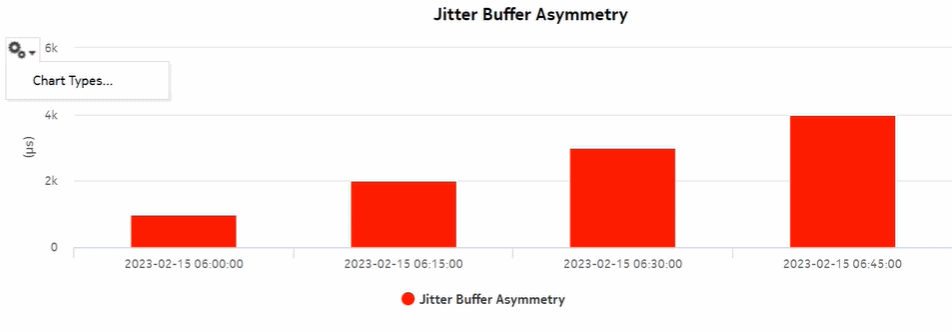
The Emulated Service Details report shows the jitter buffer depth, asymmetry, underruns, overruns, and errored seconds details for the service endpoints.
The Emulated Service Details report is a multi-element report with the following:
The Increasing Intervals value does not have to be contiguously increasing intervals, the increases can be scattered across the reporting period.
This report can be run on its own or launched from the Top-N Worst Emulated Services report.
Use cases
Synchronization management—Monitoring of services and their health in terms of network synchronization, with identification of services needing further investigation or maintenance based on three jitter buffer asymmetry KPIs.
Prerequisites
-
To view the report for granularities other than raw data, the aggregation rules must be enabled; see How do I configure analytics aggregation?. The following table describes the aggregation rules and the accounting policies that must be configured for the NEs on which statistics are to be collected; see the NSP NFM-P Statistics Management Guide for information about configuring an accounting policy.
Table 14-49: Emulated Service Details report prerequisites
|
Aggregator name |
Monitored object class |
Statistics class |
Statistics collection |
MIB name |
NE types |
|---|---|---|---|---|---|
|
CEM SAP Aggregator |
service.L2AccessInterface |
service.CemSapStats |
Performance statistics |
sapCemStatsEntry |
7210 SAS-M 7250 IXR R6 7450 ESS 7705 SAR 7750 SR Note: 7705 SAR-Hm and 7705 SAR-Hmc are not supported |
|
CEM SAP ADC Aggregator |
service.L2accessInterafce |
service.CemSapADCStats |
Performance statistics |
samCemADCStatsEntry |
7705 SAR 7705 SAR-H |
Report characteristics
The following table lists the principal report characteristics.


