Interface Utilization Summary report
Interface Utilization Summary report overview
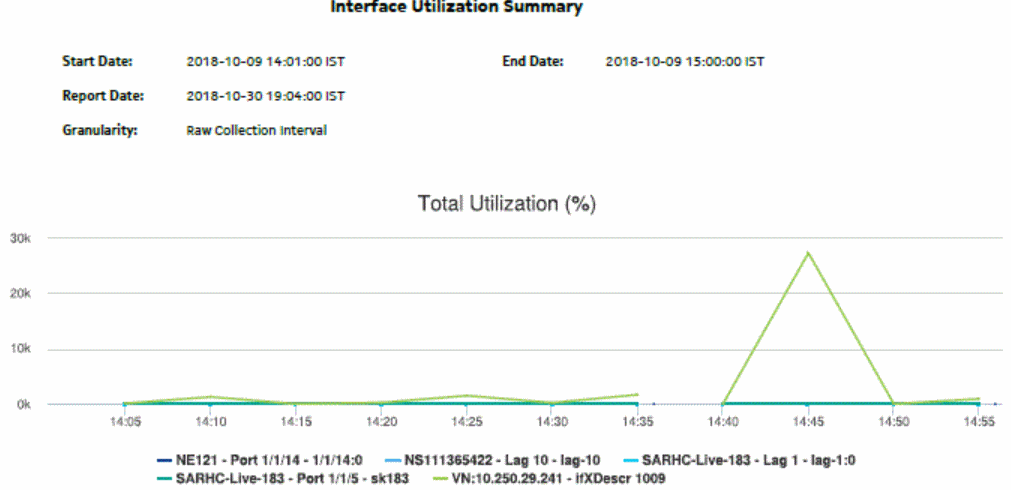
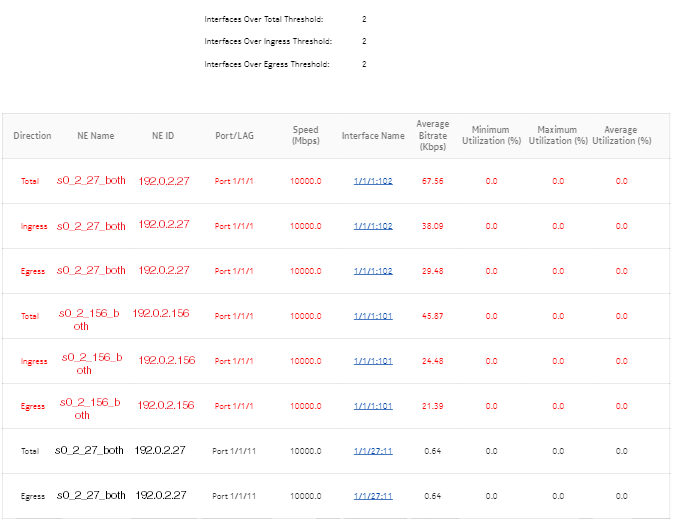
The Interface Utilization Summary report provides a summary of utilization data for a selected group of interfaces.
Note: The Interface Utilization Summary report is based on different statistics from the Interface Overview report. The utilization values shown in the two report types will be different.
The default display is a set of graphs and a table showing ingress and egress speeds and minimum, maximum and average utilization percentages. Utilization results in the table are colored red when utilization reaches or exceeds user-defined thresholds.
Utilization calculation varies by interface type:
Note: Running the report for all Interface Types or using the Show Report On One Page option may impact report rendering time. Nokia recommends running the report only for the required interface type, and disabling pagination unless required.
When five or fewer SAPs are selected and the data is available in the database for either ingress or egress (but not both), the legend of other graphs display, but not the plot.
Use cases
Capacity planning—Use the report to examine interface utilization patterns for planning future capacity requirements.
Prerequisites
To view the report for granularities other than raw data, the aggregation rules must be enabled; see How do I configure analytics aggregation?. The following table describes the aggregation rules and the accounting policies that must be configured for the NEs on which statistics are to be collected; see the NSP NFM-P Statistics Management Guide for information about configuring an accounting policy.
Table 14-31: Interface Utilization Summary report prerequisites
|
Aggregator name |
Monitored object class |
Statistics class |
Statistics collection |
Details |
NE types |
|---|---|---|---|---|---|
|
SAP Interface Stats Aggregator Egress |
service.AccessInterface |
service.CompleteServiceEgressPacketOctets |
Accounting, file, and log policies |
completeSvcInEg policy |
7705 SAR 7705 SAR Hm 7750 SR |
|
SAP Interface Stats Aggregator Ingress |
service.AccessInterface |
service.CompleteServiceIngressPacketOctets |
Accounting, file, and log policies |
completeSvcInEg policy |
7250 IXR-R6 7705 SAR 7705 SAR Hm 7750 SR |
|
Service Egress Octets Aggregator |
service.AccessInterface |
service.ServiceEgressOctets |
Accounting, file, and log policies |
svcEgressOctet policy |
7210 SAS-D 7210 SAS Dxp 7210 SAS-K 7210 SAS-M 7210 SAS-Mxp 7210 SAS-R 7210 SAS-S/Sx 7210 SAS-T 7210 SAS-X |
|
Service Ingress Octets Aggregator |
service.AccessInterface |
service.ServiceIngressOctets |
Accounting, file, and log policies |
svcIngressOctet policy |
7210 SAS-D 7210 SAS Dxp 7210 SAS-K 7210 SAS-M 7210 SAS-Mxp 7210 SAS-R 7210 SAS-S/Sx 7210 SAS-T 7210 SAS-X |
|
Mpls Interface Stats Aggregator |
rtr.NetworkInterface |
mpls.MplsInterfaceStats |
Performance statistics |
vRtrMplsIfStatEntry |
7210 SAS 7250 IXR 7705 SAR 7705 SAR Hm 7750 SR Omnisystem NEs |
|
GNE Interface Utilization Stats Aggregator |
genericne.GenericNeInterface |
genericne.InterfaceAdditionalStats Note: Only GNE interfaces without multivendor drivers are supported. |
Performance statistics |
ifXEntry |
Generic NEs |
Note: The report does not support the 7250 IXR, Release 22.0 or later.
Report characteristics
The following table lists the principal report characteristics.
Table 14-32: Interface Utilization Summary report characteristics
|
Characteristic |
Value | ||||
|---|---|---|---|---|---|
|
Data type |
Statistics | ||||
|
Source database |
Auxiliary database | ||||
|
Interface types supported |
MPLS, GNE interfaces | ||||
|
Report inputs |
Prompt |
Notes | |||
|
End date |
Calendar date or relative date (for example, two days ago) and time | ||||
|
Report Range |
Length of time to be reported, in hours or days | ||||
|
Granularity |
Aggregation types: | ||||
|
NE Types |
Search using partial names or wildcard (%). Select individual items or click Select All. | ||||
|
Name or name pattern for NEs | |||||
|
NEs | |||||
|
Port modes |
Select Access, Network, or Hybrid Port and port mode inputs are not required for GNE interfaces. Selecting a GNE in the NE list will automatically display GNE interfaces. | ||||
|
Name or name pattern for ports |
Search using partial names or wildcard (%). Select individual items or click Select All. Interfaces whose associated port speed is 0 will not be displayed in the Interfaces input prompt. | ||||
|
Physical ports or LAGs | |||||
|
Interface Type | |||||
|
Name or name pattern for interfaces | |||||
|
Interfaces | |||||
|
Total threshold |
Specify in bps/Kbps/Mbps/Gbps | ||||
|
Ingress threshold | |||||
|
Egress threshold | |||||
|
Logo resource ID |
The logo to add to the report. Enter the resource ID for the logo image uploaded to the Images folder, if any. If no logo ID is provided, the logo area will be blank. | ||||
|
Logo Position |
Choose Left, Middle or Right. The logo will be placed on the left of the first page of the report for both the left and middle options. | ||||
|
Show report output on one page |
Select the check box to enable pagination. Note: Using the Show report output on one page option when creating reports as drill-downs may impact report rendering time. Nokia recommends disabling the Show report output on one page option when creating reports. | ||||
|
Drill-down support |
Yes—Click on an entry in the Interface Name column for a 7750 SR, VSR, 7450 ESS, or 7950 XRS NE interface to launch an Interface Overview report. | ||||


