DNS Performance Summary report
DNS Performance Summary report overview
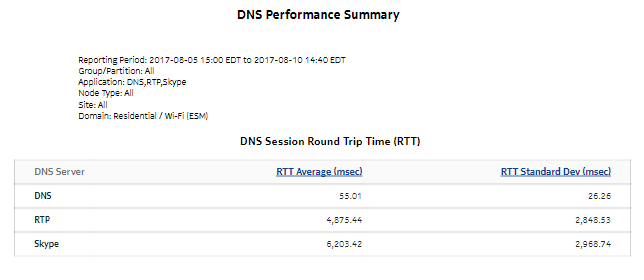
The DNS Performance Summary report shows a summary of DNS performance for a specified set of applications using RTT values and session counts.
Note: The DNS servers are modeled as applications and must be selected from the Application drop-down menu in the prompt section of the report.
Note: This report requires special study statistics collection by an NSP Flow Collector for each modeled DNS server application. See the workflow to configure AA Cflowd special-study statistics collection in the NSP NFM-P Statistics Management Guide for configuration information.
If the user chooses an application that does not represent a DNS application, the application will appear in the report but the information provided will be invalid. If the user chooses a DNS application that is not configured for special studies collection, the application will not appear in the report.
Use cases
User quality of experience—Use the report to anticipate user QoE issues by monitoring DNS performance to identify potential network issues.
Report characteristics
The following table lists the principal report characteristics.
Table 9-4: DNS Performance Summary report characteristics
|
Characteristic |
Value | |
|---|---|---|
|
Statistics type |
AA Cflowd comprehensive special study | |
|
NSP Flow Collector required |
Yes | |
|
Domains |
Residential / Wi-Fi (ESM) Mobile Wi-Fi (DSM) Business | |
|
Report inputs |
Prompt |
Notes |
|
End date |
Calendar date or relative date (for example, two days ago) and time | |
|
Granularity |
Aggregation types: | |
|
Report range |
Length of time to be reported, in minutes, hours, days, or months | |
|
Node Type |
Search using partial names or wildcard (%). Select individual items or click Select All. | |
|
Node | ||
|
Group/Partition |
Search using partial names or wildcard (%). | |
|
Application |
Search using partial names or wildcard (%). Select individual items or click Select All. | |
|
Drill-down support |
Yes—See DNS Performance RTT Details and DNS Performance Session Details | |
Example
The following figures show a report example.
Figure 9-7: DNS Performance Summary report

Figure 9-8: DNS Performance Summary—DNS Session Count

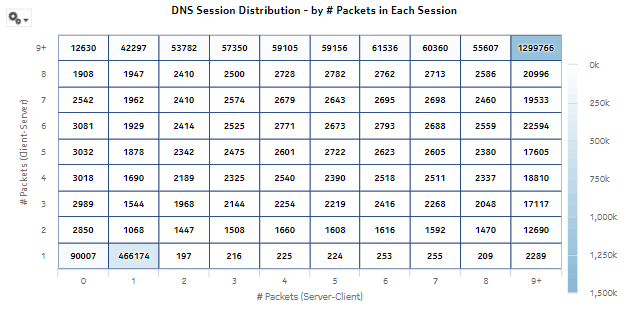
Figure 9-9: DNS Session Distribution—by # Packets in Each Session

The vertical axis of the DNS Session Distribution heat map shows the number of DNS requests made from the client to the server. The horizontal axis shows the number of responses sent from the server to the client.
Each cell shows the number of sessions observed that had X requests from the client to the server, and Y responses from the server to the client. For example, a 1 indicates one DNS request to the server and a matching response from the server to the client.
The following points may be useful for troubleshooting:
-
The heat map shows the most number of sessions in the [1,1] cell, or along the diagonal. This indicates that the same 5-tuple is being re-used for multiple requests from the client.
-
The first column shows requests from the client for which no response was received from the server. This could indicate a failure with one or more DNS server instances, or a communications issue between the client and server. A large number in any of these cells should be investigated.
-
Cells above the diagonal are for cases where the client is sending more requests than it is receiving responses. Small deltas here are normal, but large deltas may represent a rogue client or a DoS attack on the DNS servers.
-
Cells below the diagonal indicate cases where the client is receiving more responses than the number of issued requests. This is a rare, anomalous condition. Large values in these cells may represent compromised DNS servers or one experiencing a software malfunction.