Service Utilization Details report
Service Utilization Details report overview
The Service Utilization Details report shows utilization percentage information for a service.
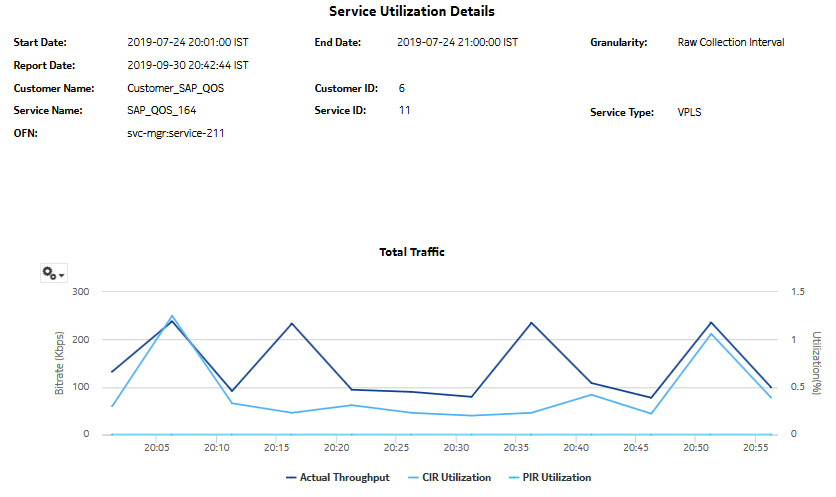
The default display includes both graphs and tables. The graphs are a set of time series multi-axis line charts showing total, ingress, egress, actual throughput, CIR, PIR, and percentage utilization for the selected service.
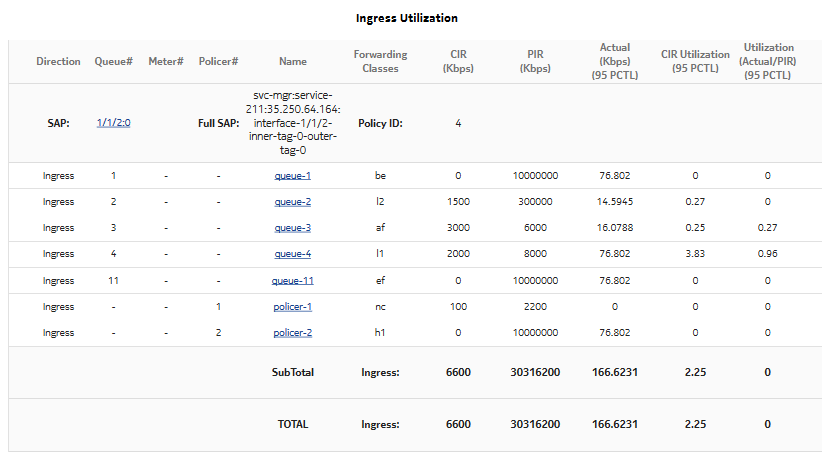
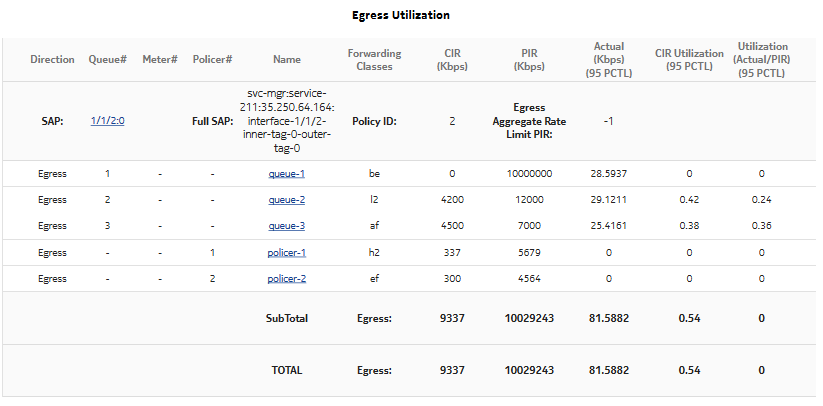
The tables show CIR, PIR, and percentage ingress and egress utilization. By default, the tables are sorted by average utilization in decreasing value order (worst first).The CIR utilization (%) displays the bandwidth utilization in-profile, and not actual throughput, and it is always less than or equal to the CIR value. For an SR NE, when a policer is specified and the statmode is minimal, allOctets statistics are used to calculate utilization. Therefore, CIR utilization (%) cannot be greater than 100%, and is set to 100% when allOctets statistics are greater than the CIR. For Total and SubTotal rows, there are no specified limits, so utilization can be greater than 100%.
For SR variants, 7705 SAR-Hm, and 7705 SAR-Hmc, the report supports QoS policies, virtual schedulers, queue/policer overrides, and the egress aggregate rate limit.
For the 7210 SAS, the report supports QoS policies, queue/meter overrides, and the egress aggregate rate limit.
For the 7705 SAR, the report supports QoS policies and the egress aggregate rate limit.
If a percentile value from 1 to 99 is entered in the Percentile input, the selected percentile value of the traffic data is shown in the second table. The percentile calculation is applied to the sum of the traffic, for each direction and for the total. For example, if 95 is entered and two queues are present, each row in the table shows the 95 percentile value for the sum of traffic on the queue. The total value shows the 95 percentile of the sum of traffic for both queues. This may not be the same as the sum of the two 95th percentile values.
The SubTotal row displays the percentile throughput and utilization of an SAP and the Total row displays the same for a service.
All queue types are supported in the report.
Forwarding Class information is shown only for unicast queues.
The report supports the Rate (kbps) rate type, Percent Port, and Percent Local rate types. The report also supports the port limit and local limit, which are the CIR/PIR values configured as percentages.
The ingress utilization is displayed only when there is a QoS and a forwarding class associated with the SAP.
It is not mandatory to configure QoS for this report since the default QoS settings apply.
Use cases
Capacity planning—Use the report to examine service utilization patterns for planning future capacity requirements.
Prerequisites
The following table describes the aggregation rules that must be enabled and the accounting policies that must be configured for the NEs on which statistics are to be collected; see the NSP NFM-P Statistics Management Guide for information about configuring an accounting policy. To view the report for granularities other than raw data, the aggregation rules must be enabled; see How do I configure analytics aggregation?.
Table 14-15: Service Utilization Details report prerequisites
|
Aggregator name |
Monitored object class |
Statistics class |
Statistics collection |
Details |
NE types |
|---|---|---|---|---|---|
|
SAP Interface Stats Aggregator Egress |
service.AccessInterface |
service.CompleteServiceEgressPacketOctets |
Accounting, file, and log policies |
completeSvcInEg policy |
7705 SAR 7705 SAR Hm 7750 SR |
|
SAP Interface Stats Aggregator Ingress |
service.AccessInterface |
service.CompleteServiceIngressPacketOctets |
Accounting, file, and log policies |
completeSvcInEg policy |
7250 IXR-R6 7705 SAR 7705 SAR Hm 7750 SR |
|
Service Egress Octets Aggregator |
service.AccessInterface |
service.ServiceEgressOctets |
Accounting, file, and log policies |
svcEgressOctet policy |
7210 SAS-D 7210 SAS Dxp 7210 SAS-K 7210 SAS-M 7210 SAS-Mxp 7210 SAS-R 7210 SAS-S/Sx 7210 SAS-T 7210 SAS-X Note: 7210 SAS-E and 7210 SAS-S/Sx are not supported due to NE limitations. |
|
Service Ingress Octets Aggregator |
service.AccessInterface |
service.ServiceIngressOctets |
Accounting, file, and log policies |
svcIngressOctet policy |
7210 SAS-D 7210 SAS Dxp 7210 SAS-K 7210 SAS-M 7210 SAS-Mxp 7210 SAS-R 7210 SAS-S/Sx 7210 SAS-T 7210 SAS-X |
Report characteristics
The following table lists the principal report characteristics.


