Temperature, CPU, Memory Utilization Details (NSP) report
Temperature, CPU, Memory Utilization Details (NSP) report overview
The Temperature, CPU, Memory Utilization Details (NSP) report differs from the Temperature, CPU, Memory Details report by including throughput data for NEs managed by the NFM-P only, MDM (model-driven Nokia) only, or NFM-P+MDM-mediated NEs. The content and format of the Temperature, CPU, Memory Utilization Details (NSP) report vary from the NFM-P-only Temperature, CPU, Memory Details report to accommodate its model-driven approach.
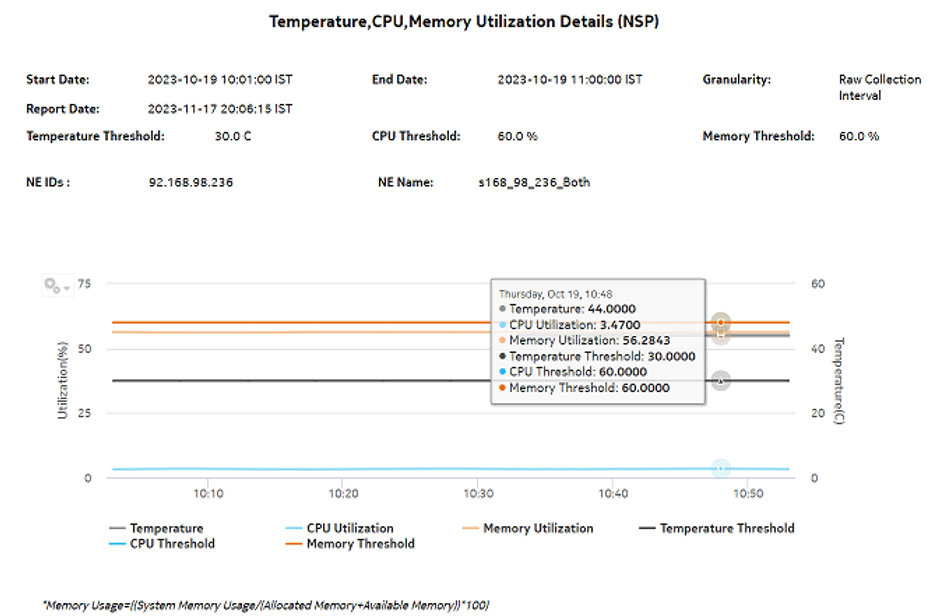
The Temperature, CPU, Memory Utilization Details (NSP) report shows the temperature, memory and CPU usage details for selected NEs and sites. The default display is a graph displaying usage over time relative to user-defined thresholds.
The following temperatures can be reported by the NE when no temperature sensor is available. These temperatures are invalid and will not be displayed in the report.
Prerequisites
The following table describes the aggregation rules that must be enabled and telemetry subscriptions that must be configured for the NEs on which statistics are to be collected. The aggregation rules must be enabled to view the report for granularities other than raw data; see How do I configure analytics aggregation?. Enable aggregation and configure telemetry subscriptions; see the Telemetry information on the Network Developer Portal and the NSP Data Collection and Analysis Guide. For the report prerequisites for NFM-P-managed NEs, see Table 14-41, Temperature, CPU, Memory Utilization Details Summary report prerequisites.
See information in the NSP NFM-P Statistics Management Guide about creating or modifying a specific MIB statistics policy using a bottom-up method.
Table 18-24: Temperature, CPU, Memory Utilization Details (NSP) report prerequisites
|
Aggregator name |
Monitored object class |
Statistics class |
Statistics collection |
NE types |
|---|---|---|---|---|
|
md-aggr:/md-aggr-base/telemetry-system-info/system |
Card Memory pool Shelf |
telemetry:/base/system-info/system |
Telemetry statistics |
7750 MD SR Classic NE with gRPC telemetry collection enabled 7250 IXR variants |
|
md-aggr:/md-aggr-base/telemetry-hardware/temperature |
Card Port Shelf |
telemetry:/base/hardware/temperature |
Telemetry statistics |
7750 MD SR Classic NE with gRPC telemetry collection enabled 7250 IXR variants |
Report characteristics
The following table lists the principal report characteristics.
Table 18-25: Temperature, CPU, Memory Utilization Details (NSP) report characteristics
Note: If there is no data for the input date and range, the report displays an empty graph.
For SRL NEs (7250 IXR variants), the report does not include memory statistics.
