Top Loaded Ports report

Top Loaded Ports report overview

The Top Loaded Ports report shows the top loaded ports sorted by utilization percentage. The operator can select the value of ‘N’ which corresponds to the top N loaded ports. By default, N is set to 5. The Top Loaded Ports report can be generated based on Radio or Ethernet port utilization percentage.

Use cases

Capacity planning—Use the report to examine the top loaded ports based on the radio and/or Ethernet traffic in a given network and to plan for capacity requirements.

Prerequisites

The following table describes the aggregation rules that must be enabled and the accounting policies that must be configured for the NEs on which statistics are to be collected; see the NSP NFM-P Statistics Management Guide for information about configuring an accounting policy. To view the report for granularities other than raw data, the aggregation rules must be enabled; see How do I configure analytics aggregation?.

Note: Busy hour support is only available for raw data granularity.

Table 15-35: Top Loaded Ports report prerequisites

Aggregator name

Monitored object class

Statistics class

Statistics collection

MIB

NE types

Wavence Egress Stats Bandwidth Aggregatorr

Port

LAG

Ethernet

Ethernet Aggregate Tx Stats (15Min)

ethAggrMaintTxEntry

Wavence MSS-1, Wavence MSS-4, Wavence MSS-8, Wavence MSS-O, Wavence MSS-E, Wavence MSS-HE, Wavence MSS-XE, Wavence MSS-1c, Wavence SA, Wavence UBT-SA, Wavence UBT-I, Wavence UBT-T XP, 9500 MPR-A Chassis 1, 9500 MPR-A Chassis 4, 9500 MPR-A Chassis 8, 9500 MPR-E Chassis 1, 9500 MPR-E Chassis 4, 9500 MPR-E Chassis 8, 9500 MSS-1c, 9500 MSS-O ANSI, 9500 MSS-O ETSI, 9500 SA

Report characteristics

The following table lists the principal report characteristics.
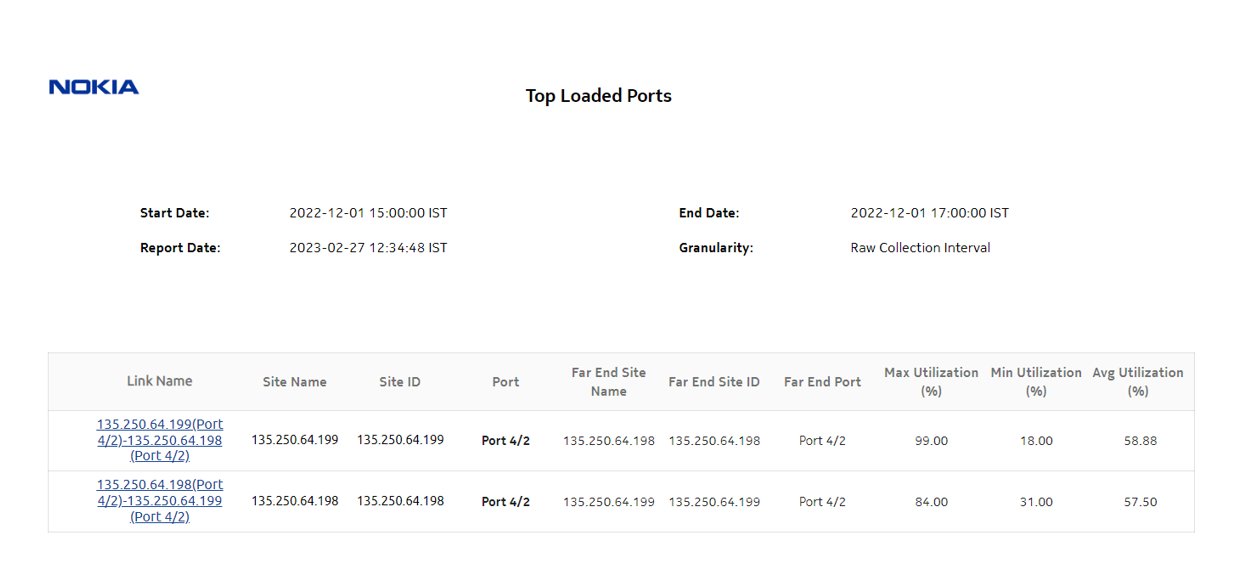
Table 15-36: Top Loaded Ports report characteristics

Characteristic

Value

Data type

Statistics

NE types supported

Wavence MSS-1, Wavence MSS-4, Wavence MSS-8, Wavence MSS-O, Wavence MSS-E, Wavence MSS-HE, Wavence MSS-XE, Wavence MSS-1c, Wavence SA, Wavence UBT-SA, Wavence UBT-I, Wavence UBT-T XP, 9500 MPR-A Chassis 1, 9500 MPR-A Chassis 4, 9500 MPR-A Chassis 8, 9500 MPR-E Chassis 1, 9500 MPR-E Chassis 4, 9500 MPR-E Chassis 8, 9500 MSS-1c, 9500 MSS-O ANSI, 9500 MSS-O ETSI, 9500 SA

Report inputs

Prompt

Notes

Start date

End date

Calendar date or relative date (for example, two days ago) and time

Granularity

Aggregation types:

  • None (raw data)

  • Hourly

  • Daily

  • Monthly

Top ‘N’ Ports

Specify the value (1,2, etc.) to get the ports details of the selected number of ports in the report.

Default: N=5

Port Type

Select Radio or Ethernet or All.

Utilization Threshold (%)

Specify the threshold percentage to get reports for all entries equal and above the specified threshold value.

Minimum Number of Occurrence

Specify the number of occurrences.

Busy Hour Support

Allows specifying Busy Start Hour and Busy End Hour to customize report range for busy hours. Busy Hour Support is only available for raw data granularity.

Busy Start Hour

Start hour of the busy hour in the report range

Busy End Hour

End hour of the busy hour in the report range

Logo Resource ID

The logo to add to the report. Enter the Resource ID of the logo image in the Images folder. The default is the Nokia logo. To create the report without a logo, leave the Logo Resource ID field blank.

Logo Position

Choose Left, Middle, or Right. The logo appears on the left on the first page of the report if you choose Left or Middle.

Show report output on one page

Select the check box to enable pagination.

Note: Using the Show report output on one page option when creating reports as drill-downs may impact report rendering time. Nokia recommends disabling the Show report output on one page option when creating reports.

Apply

Applies all the parameters and prepares the report based on the parameters entered.

Reset

Resets all the parameters to default value.

Drill-down support

Yes—Click on each Link Name (applicable to Radio ports only) to get the individual link Bandwidth Throughput Summary.

Example

The following figures show a report example.

Figure 15-38: Top Loaded Ports report—Radio Traffic
Top Loaded Ports report—Radio Traffic
Figure 15-39: Top Loaded Ports Report—Drill-down, Radio Link Inventory Details
Top Loaded Ports Report—Drill-down, Radio Link Inventory Details