Bandwidth Usage report
Bandwidth Throughput Summary report overview
The Bandwidth Throughput Summary report shows bandwidth utilization by specified radio or Ethernet ports configured as a part of the link across the Wavence NEs. The default display is a set of time series graphs for Rx and Tx Throughput and Rx and Tx summary. You can select a link to use as a baseline on the graph, either the same link or a different link from the data set.
The Bandwidth Throughput Summary report at the link level shows the Rx and Tx throughput on a per link basis for the available Ethernet or Radio ports. The corresponding graphs are plotted for Rx and Tx Throughput within the selected single link.
Note: The report tooltip cannot display large numbers of links. If the data displayed in the tooltip extends past the viewable area, refer to the report instead of the tooltip.
Use cases
Capacity planning—Use the report to examine traffic usage and patterns based on the radio or Ethernet traffic in a network and to plan for capacity requirements.
Prerequisites
The following table describes the aggregation rules that must be enabled and the accounting policies that must be configured for the NEs on which statistics are to be collected; see the NSP NFM-P Statistics Management Guide for information about configuring an accounting policy. To view the report for granularities other than raw data, the aggregation rules must be enabled; see How do I configure analytics aggregation?.
Table 15-12: Bandwidth Throughput Summary report prerequisites
|
Aggregator name |
Monitored object class |
Statistics class |
Statistics collection |
MIB |
NE types |
|---|---|---|---|---|---|
|
Wavence Ingress Stats Bandwidth Aggregator Wavence Egress Stats Bandwidth Aggregator |
Port LAG |
Ethernet |
Ethernet Aggregate Rx Stats (15Min) Ethernet Aggregate Tx Stats (15Min) |
ethAggrMaintRxEntry ethAggrMaintTxEntry |
Wavence MSS-1, Wavence MSS-4, Wavence MSS-8, Wavence MSS-O, Wavence MSS-E, Wavence MSS-HE, Wavence MSS-XE, Wavence MSS-1c, Wavence SA, Wavence UBT-SA, Wavence UBT-I, Wavence UBT-T XP, 9500 MPR-A Chassis 4, 9500 MPR-A Chassis 8, 9500 MPR-E Chassis 1, 9500 MPR-E Chassis 4, 9500 MPR-E Chassis 8, 9500 MSS-1c, 9500 MSS-O ANSI, 9500 MSS-O ETSI, 9500 SA |
Report characteristics
The following table lists the principal report characteristics.
Table 15-13: Bandwidth Throughput Summary report characteristics
Example
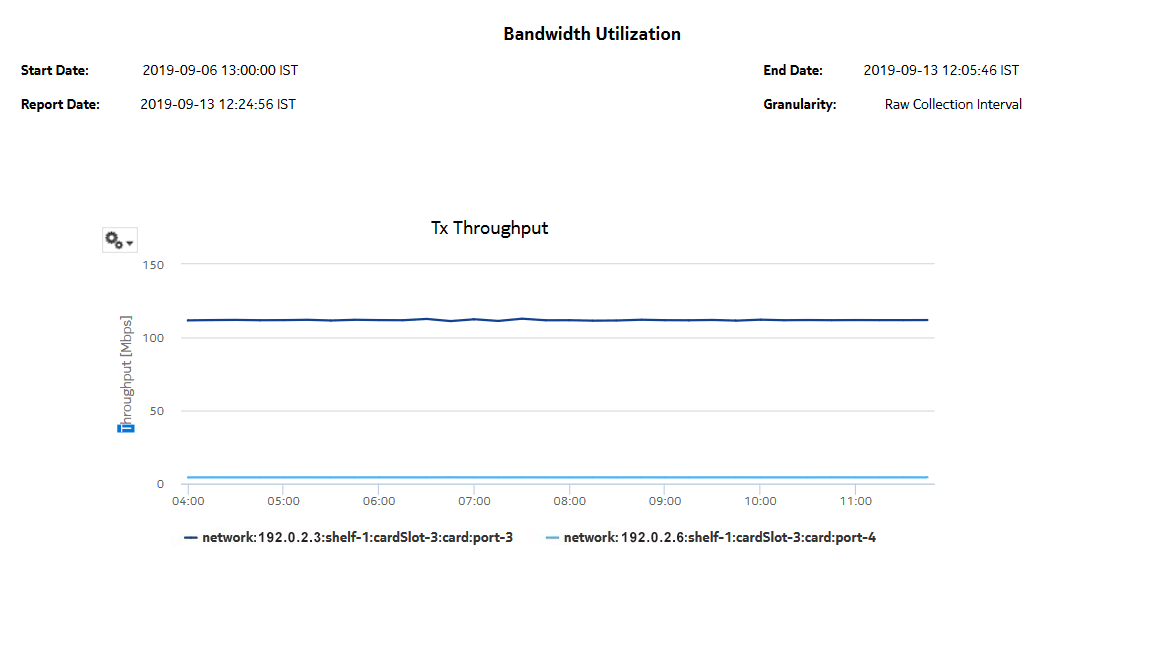
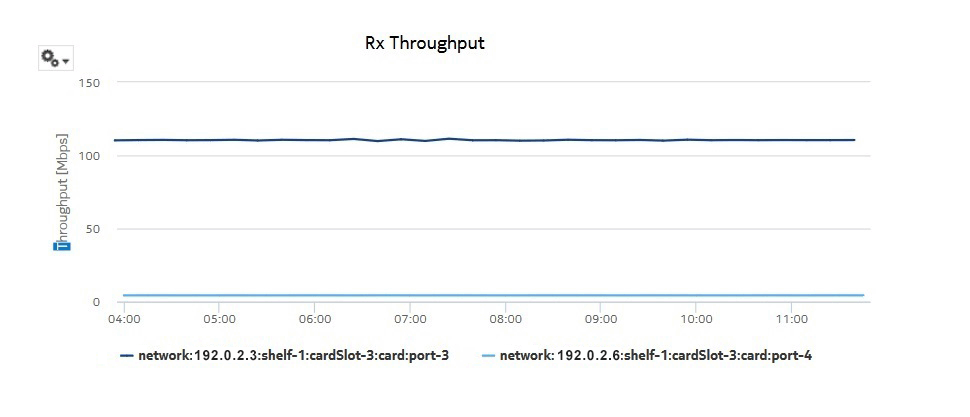
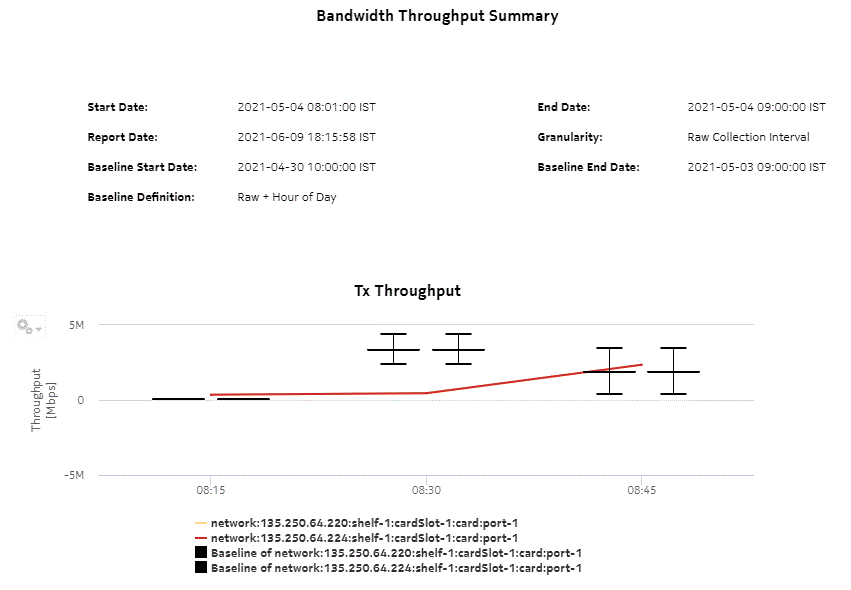
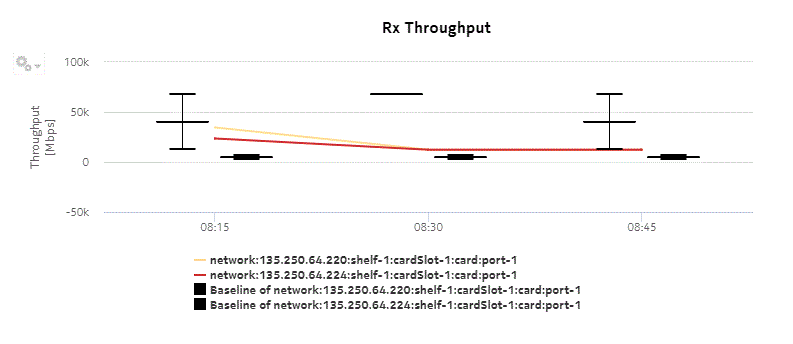
The following figures show a report example.
Figure 15-12: Bandwidth Throughput Summary Report—Tx Throughput

Figure 15-13: Bandwidth Throughput Summary Report—Rx Throughput

Figure 15-14: Bandwidth Throughput Summary Report—Tx Summary

Figure 15-15: Bandwidth Throughput Summary Report—Rx Summary

Figure 15-16: Bandwidth Throughput Summary Report with Baseline—Tx Throughput

Figure 15-17: Bandwidth Throughput Summary Report with Baseline—Rx Throughput
