How do I examine an NE in the Troubleshooting Summary dashboard?
NE troubleshooting
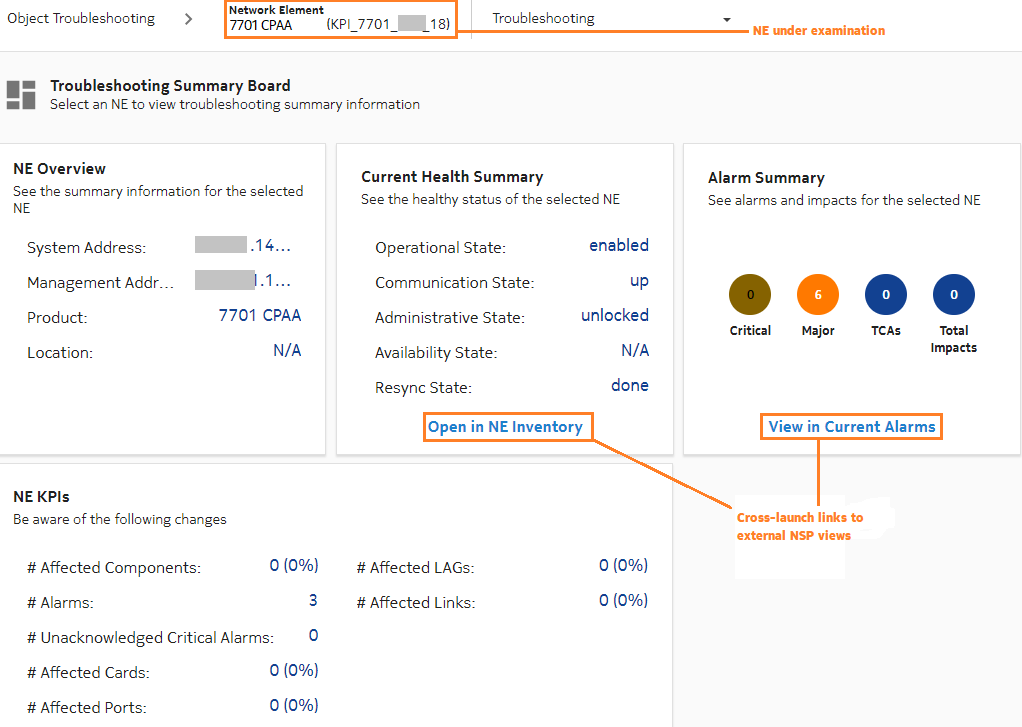
The NE Troubleshooting Summary dashboard consists of a selection of dashlets intended to show an overall picture of a selected network element, providing the necessary information to troubleshoot it. On alarm dashlets, you can click on an alarm KPI to open the related alarms in a list view.
For information on displaying and hiding dashlets, see the NSP User Guide.
The Troubleshooting Summary dashboard provides information in a series of common dashlets that appear for all object types:
-
NE Overview - IP address, model, and location information for the selected NE
-
Current Health Summary - operational status of the selected NE
-
Alarm Summary - alarm counts for the selected NE
Click on an alarm KPI to view the alarms in the Current Alarms list, filtered to the KPI.
-
Analytics reports - a list of Analytics reports that can be run on the selected NE
If you need to refer back to an object you had previously opened in the Object Troubleshooting dashboard, click ![]() Target History and select an object from the drop-down list.
Target History and select an object from the drop-down list.
Figure 2-1: Sample Troubleshooting Summary for an NE
Troubleshooting workflow
Use the following dashboard features to troubleshoot an NE:
-
View all alarms for an NE KPI in the Alarms list; see How do I check alarms for a KPI?.
-
View all alarms for the NE; in the Alarm Summary dashlet, click View In Current Alarms.
-
Plot statistics for the NE; see How do I plot performance statistics for an object?
-
View equipment on the NE; in the Current Health Summary dashlet, click Open In NE Inventory to display the NE in the NE Inventory, in the context of its related equipment (shelves, cards, ports).
