LSP Throughput with Forecast reporting scenario

Purpose

The LSP Throughput with Forecast (NSP) report provides the throughput trend for an LSP. The report can generate a forecast for daily and monthly granularities.

This process shows how to set up a service for LSP Throughput with Forecast reporting in Analytics.

Confirm that prerequisites for service provisioning are completed
 

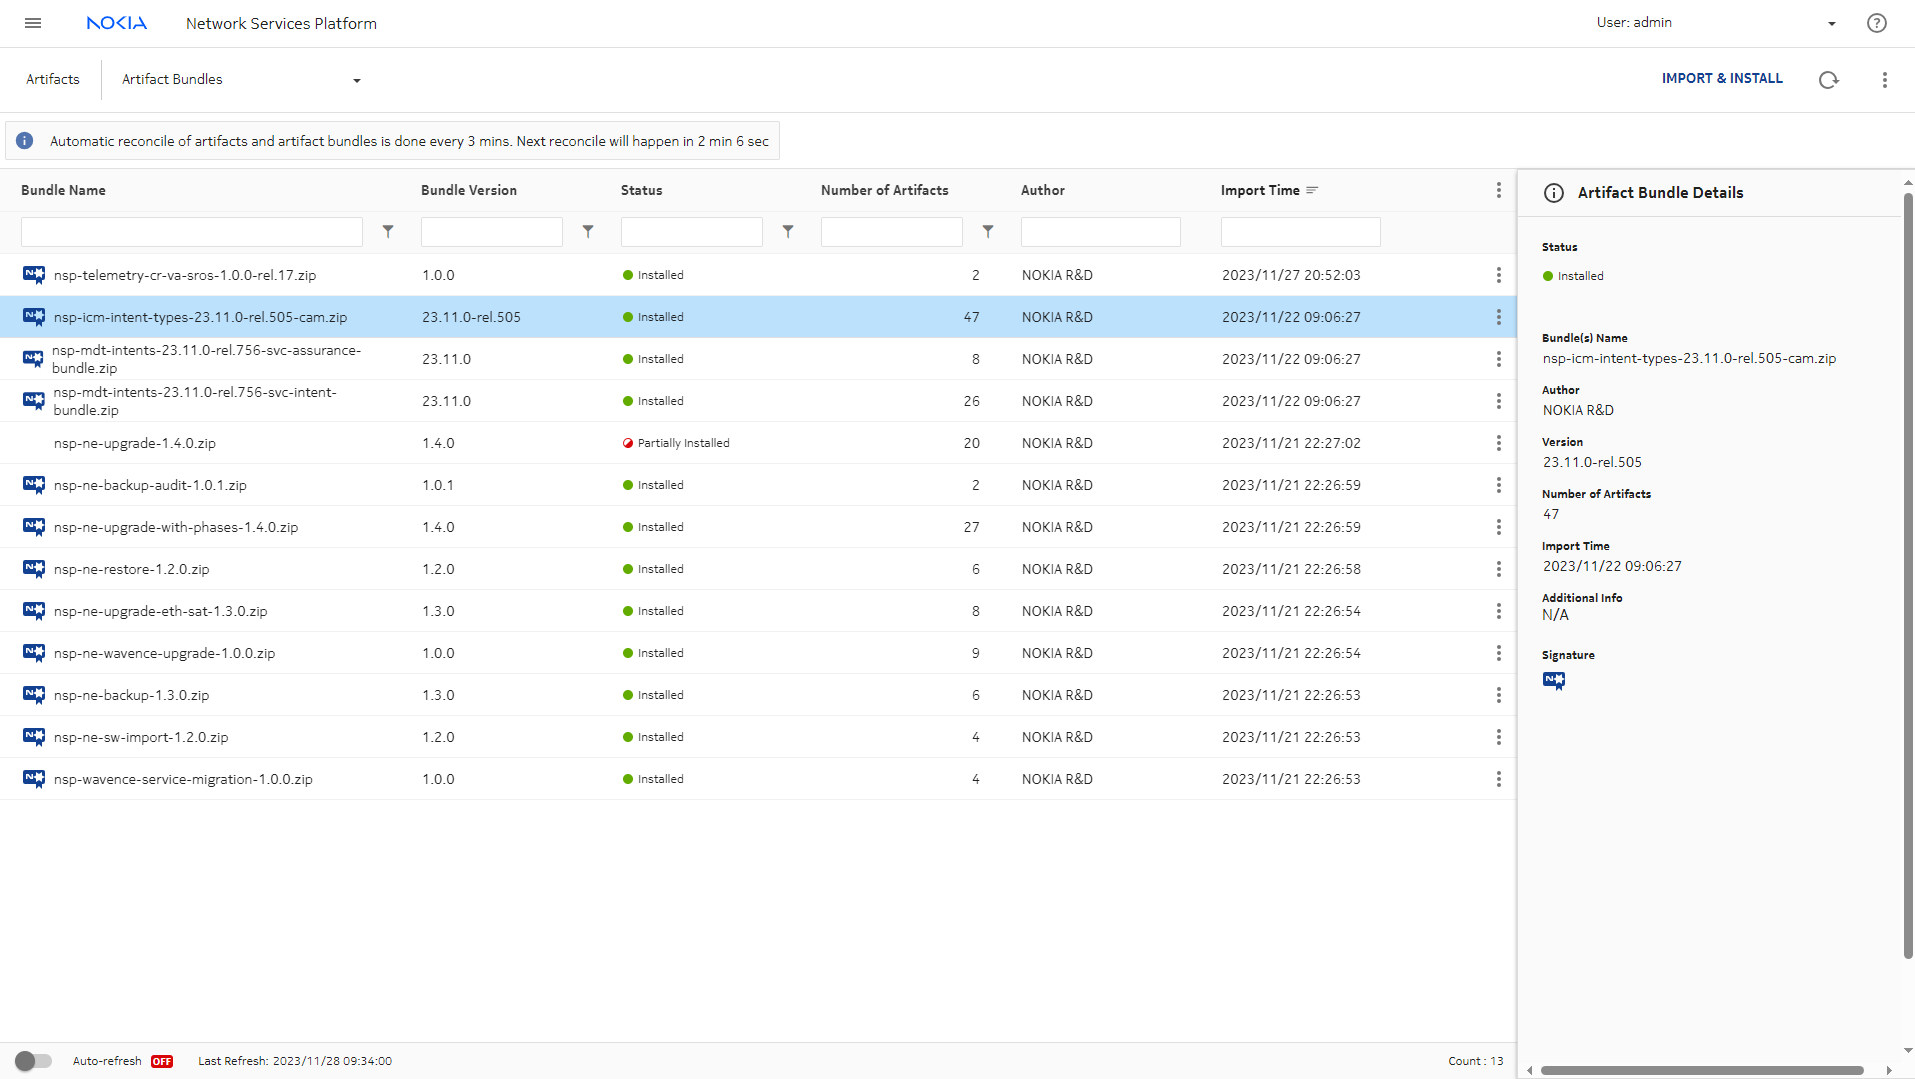
Two intent type bundles are required for provisioning our service, and for setting up QoS and telemetry: icm-intent-types, and mdt-intents.

Checking the list in the Artifacts, Artifact Bundles view shows that both bundles are in Installed status.


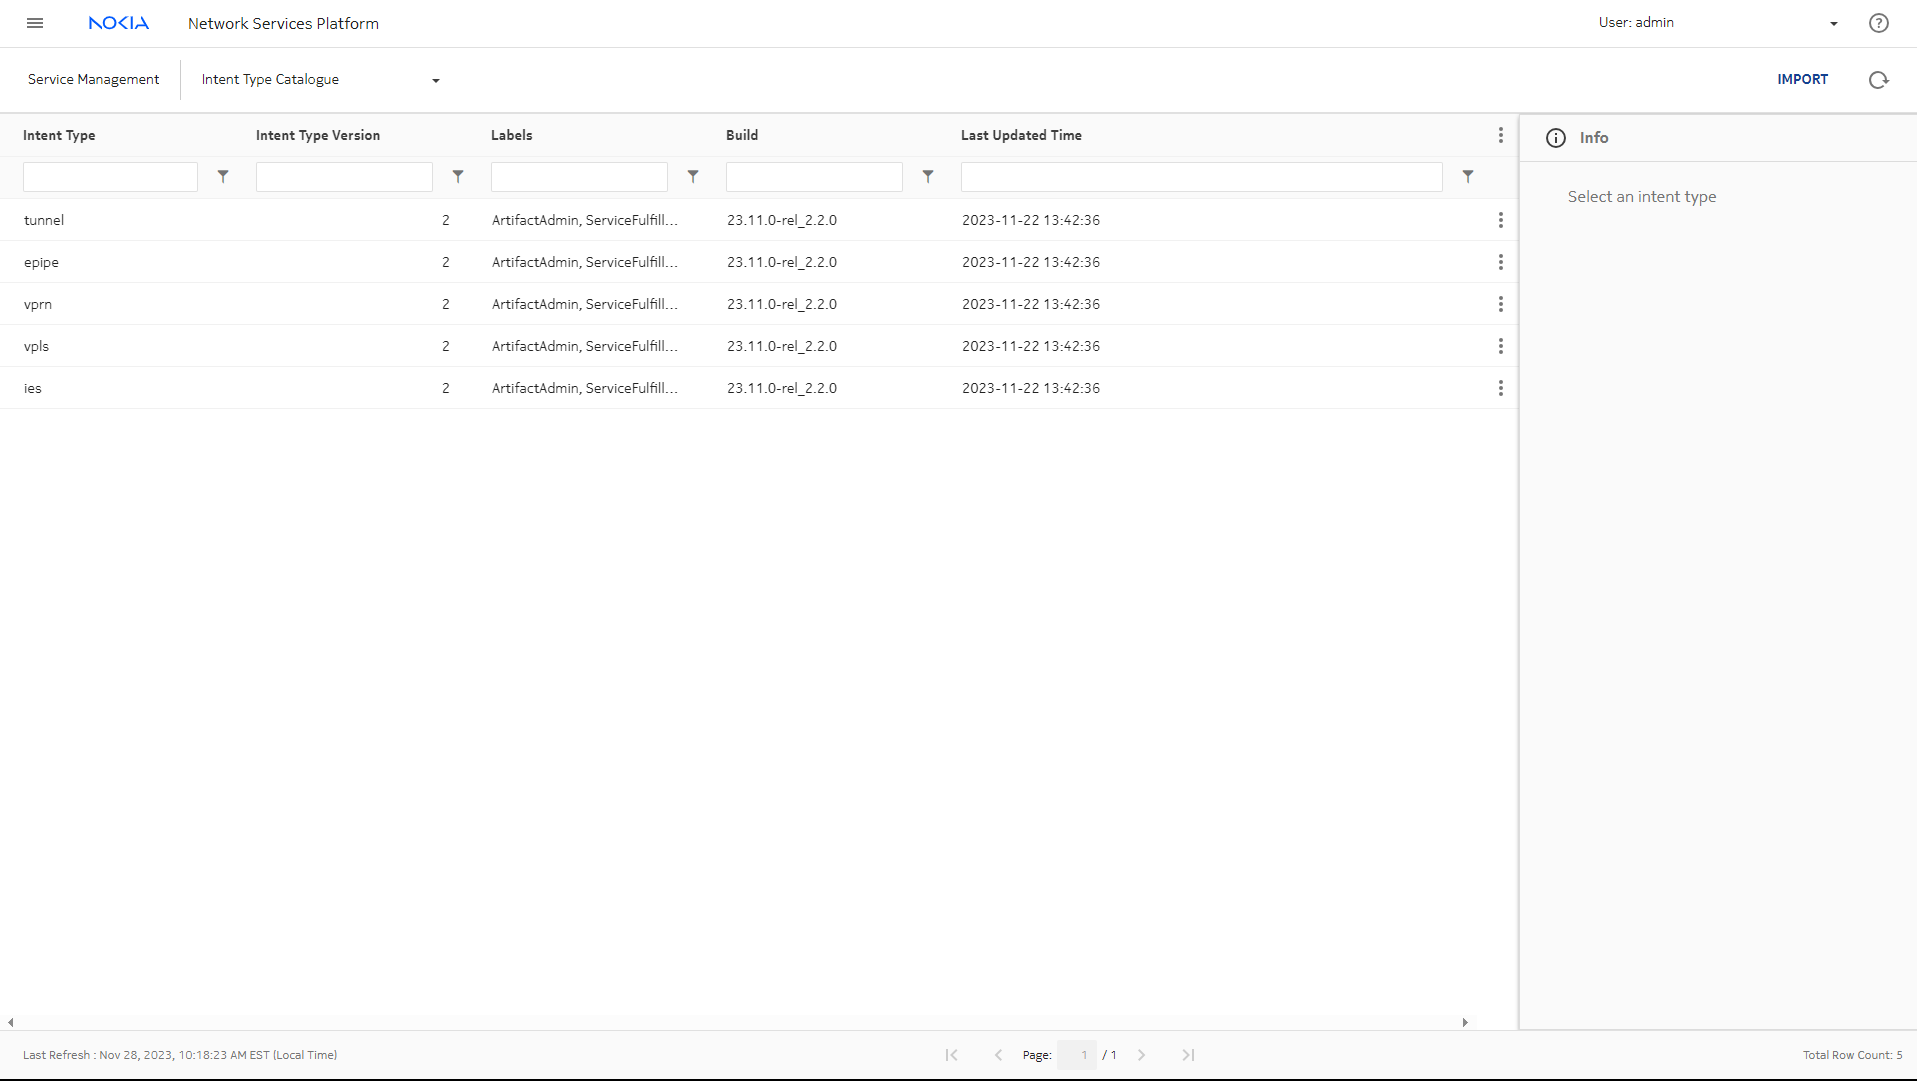
NSP installs the intent types to Network Intents, from which they can be imported to Service Management.

The Service Management, Intent Type Catalogue view shows that the intent types have been imported and are available for use in service management.


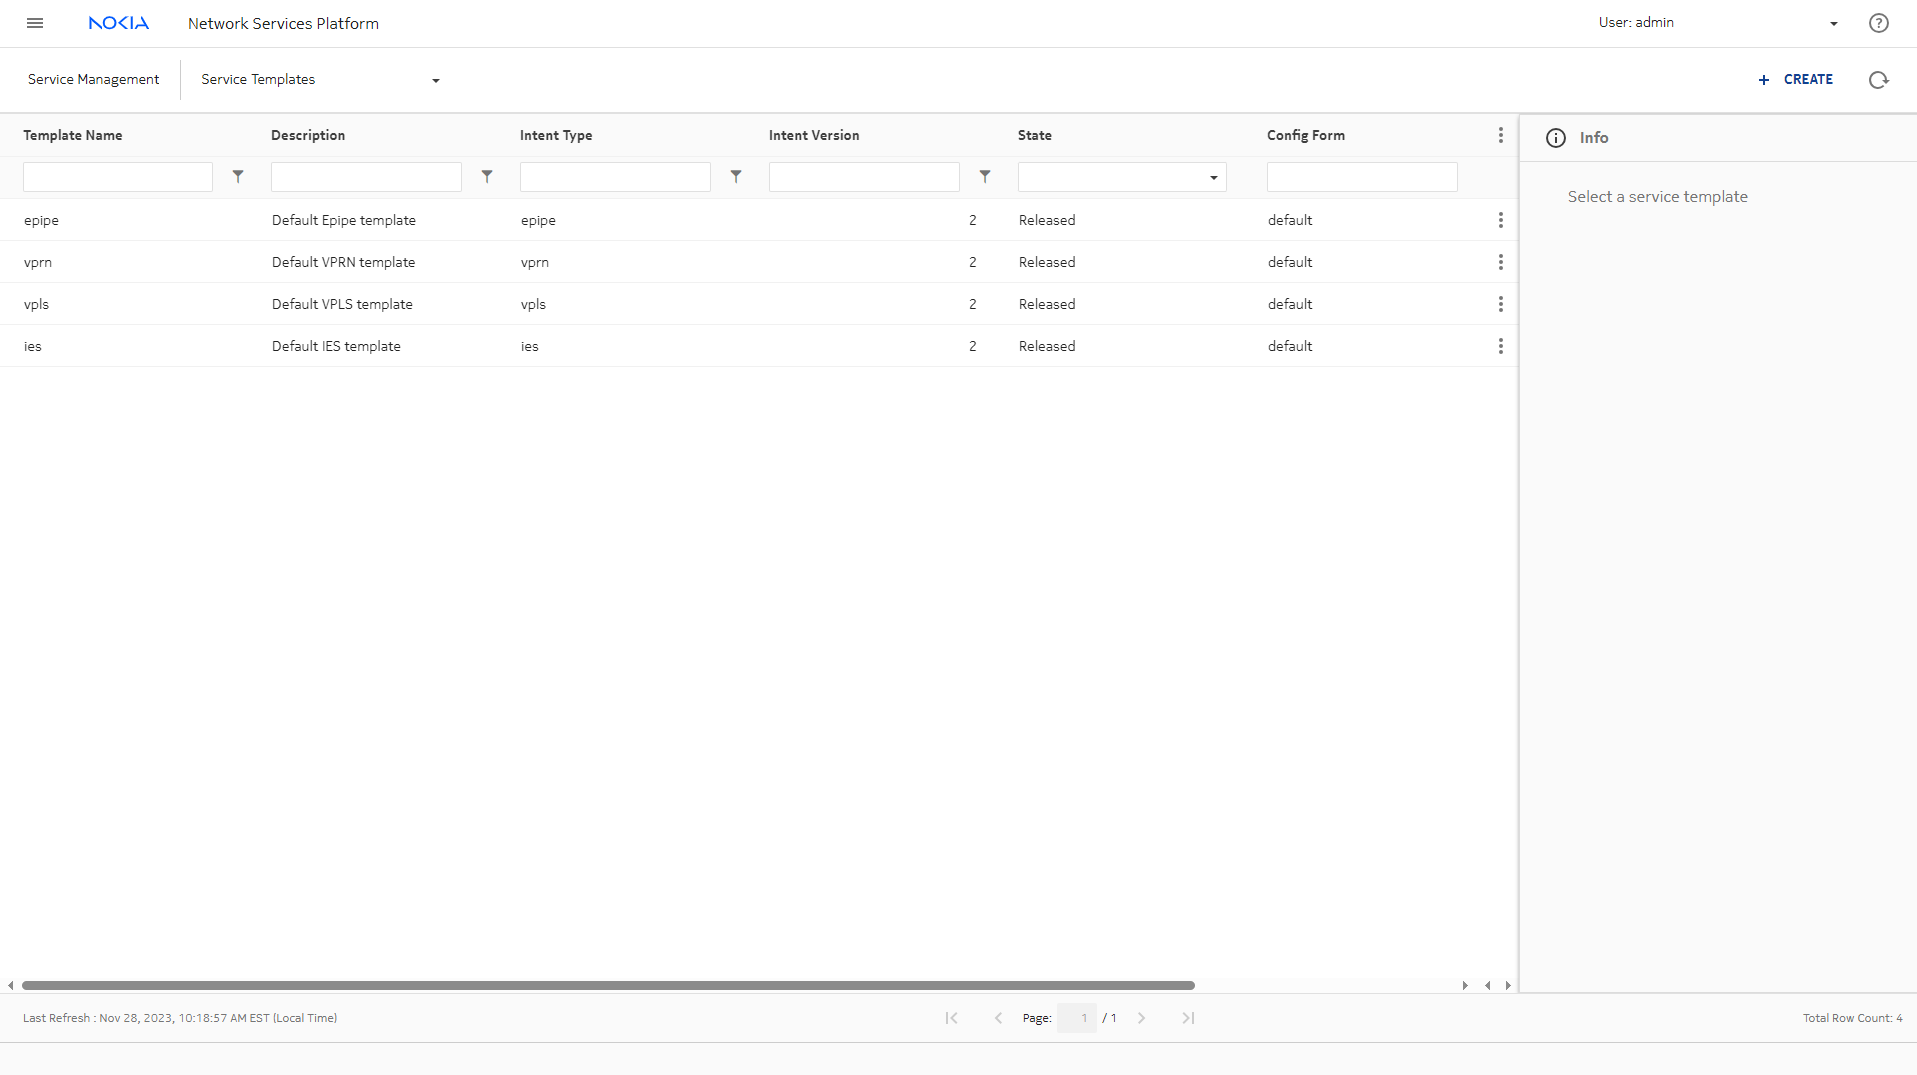
Switching to the Service Management, Service Templates view shows that the intent types have been used to create templates for various service types.

Verify the service parameters
 

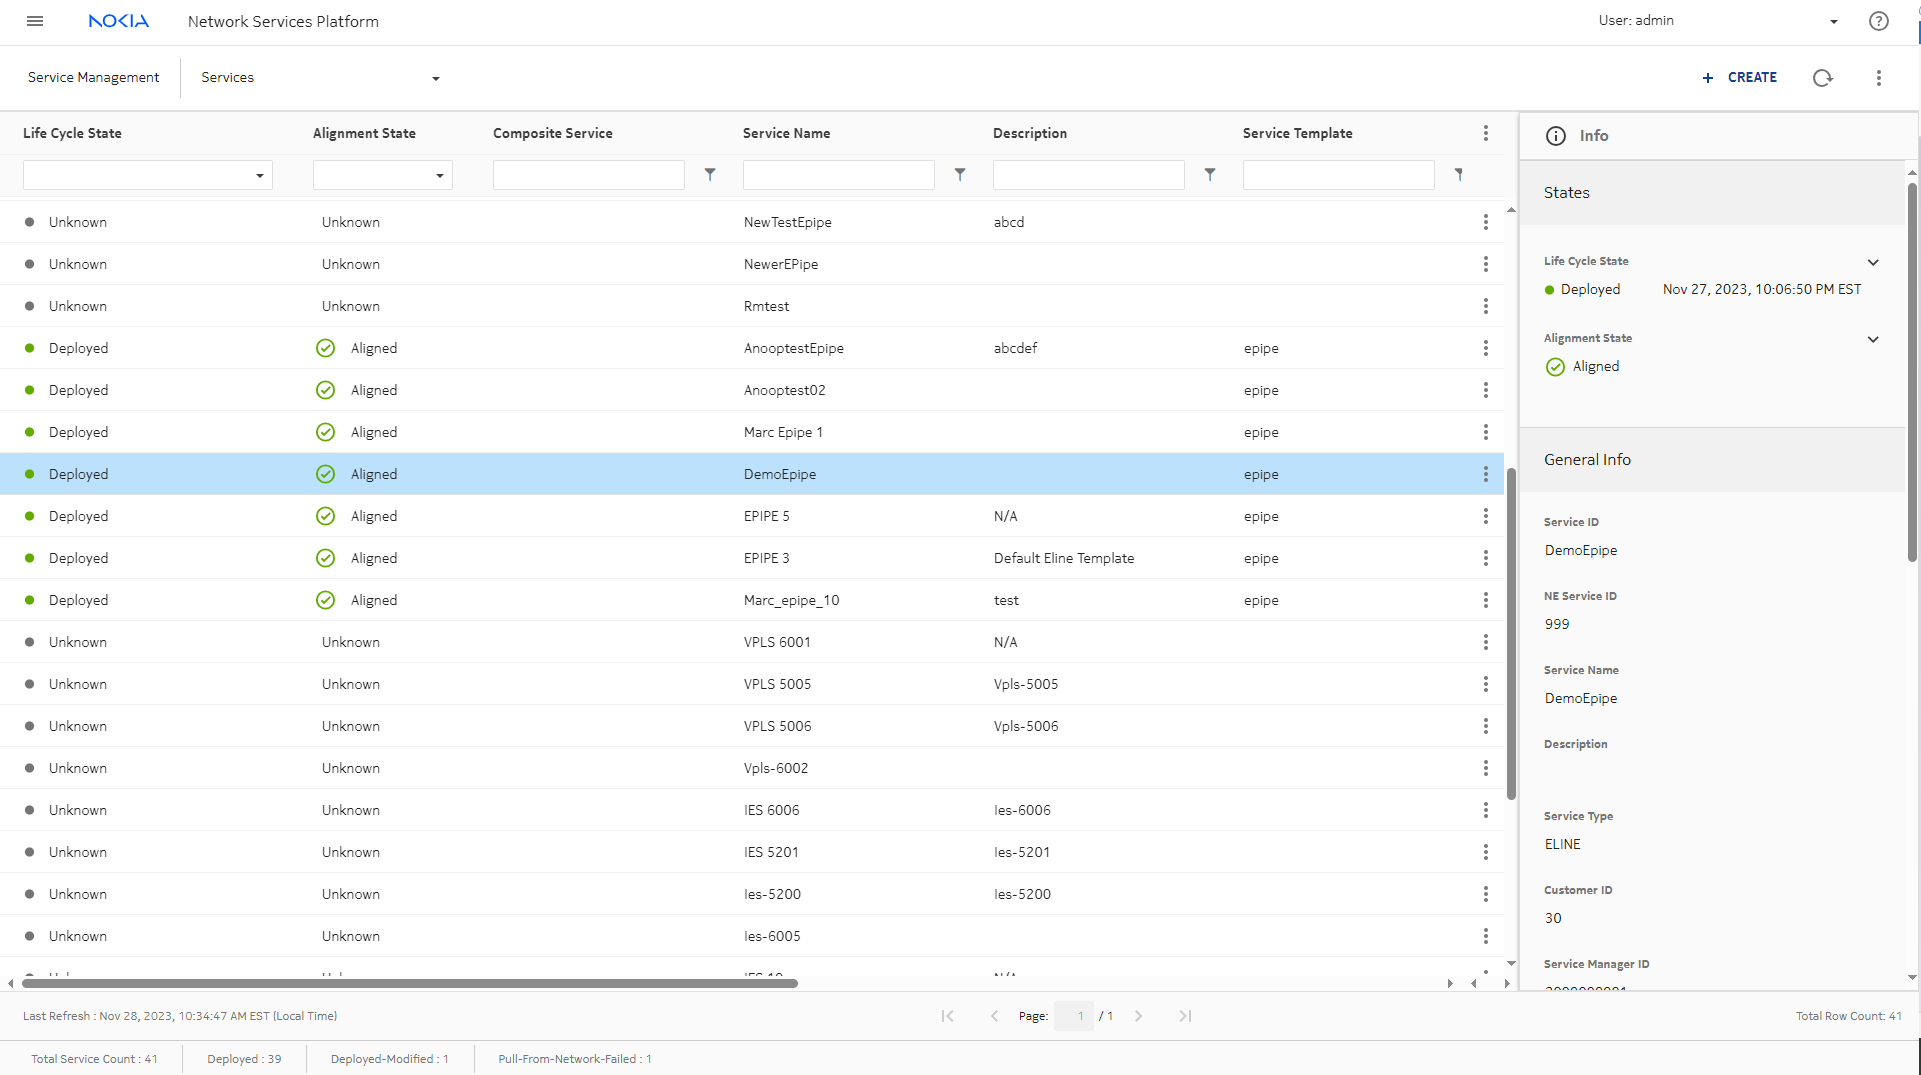
From the Service Management, Services view, we can see the provisioned services.


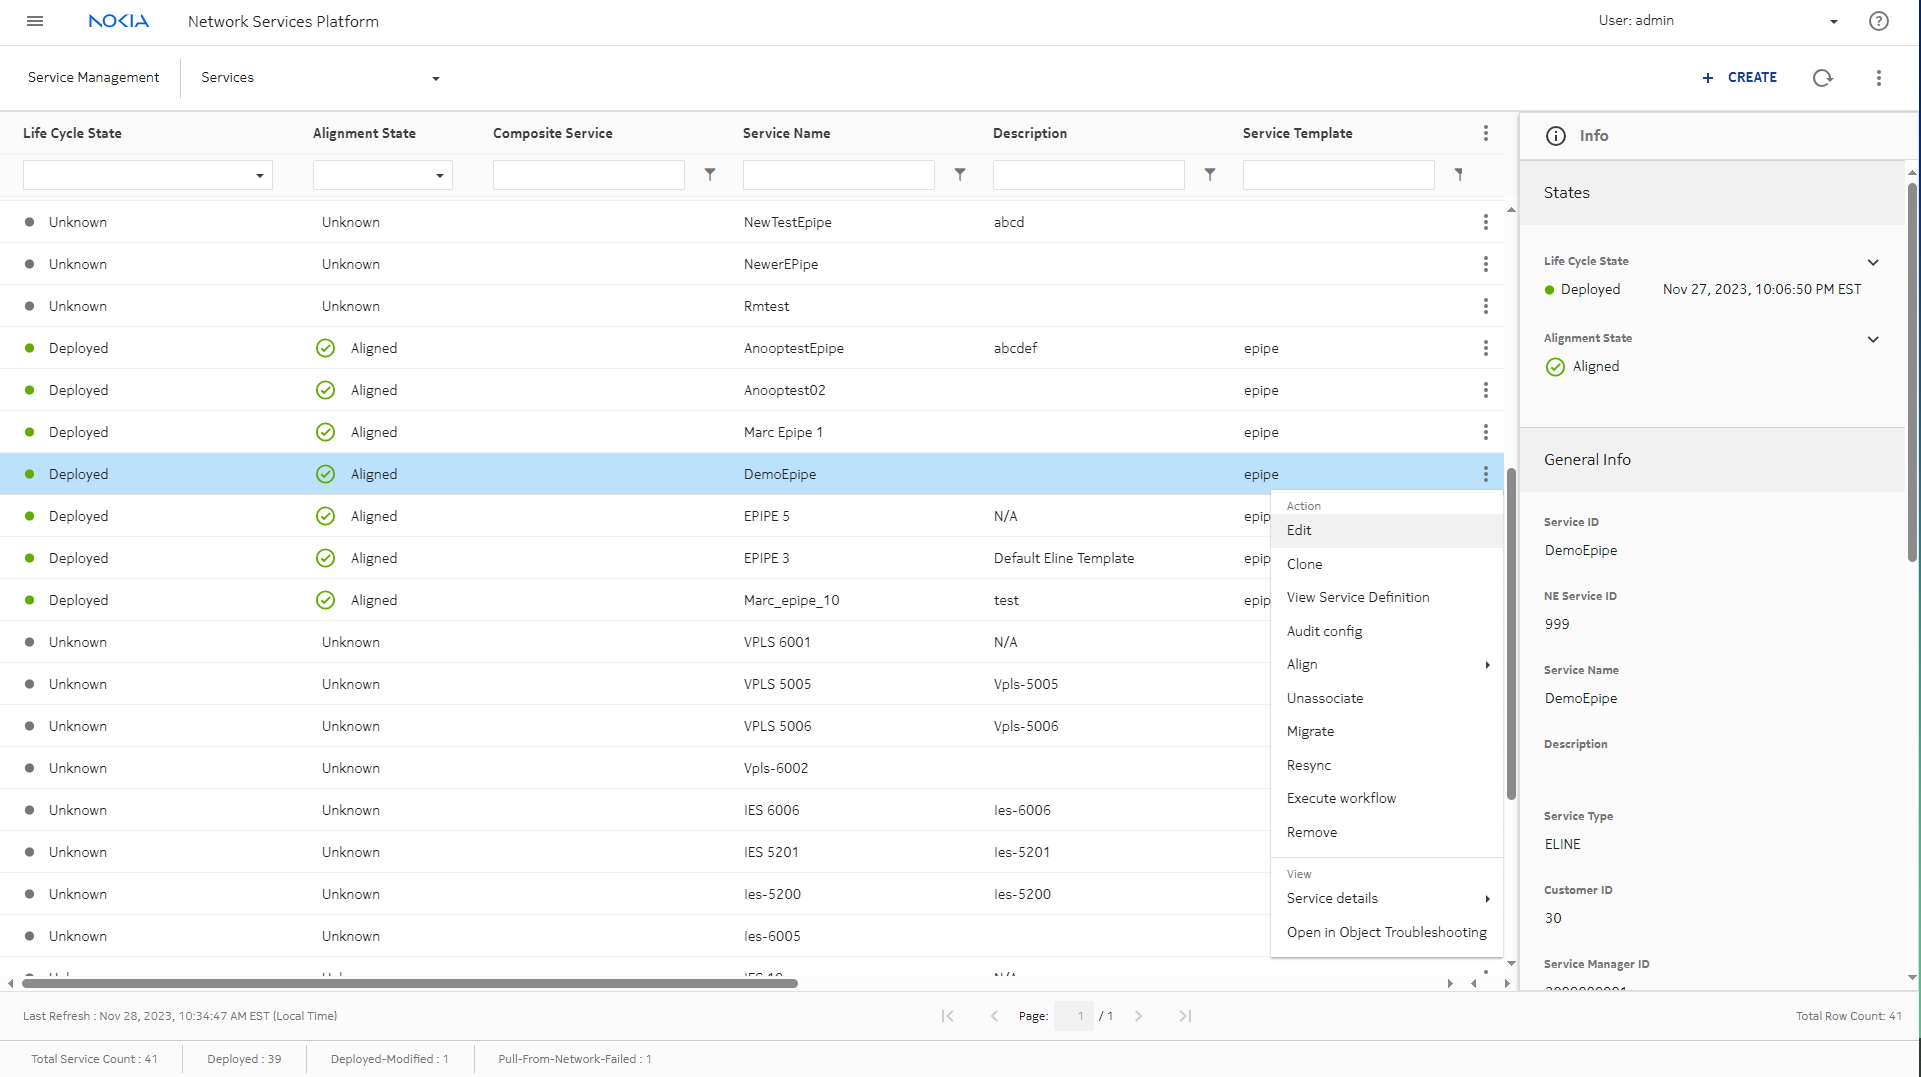
Opening the Edit form for a service will let us verify that everything we’ll need is in place. Select the service and select Edit from the Table row actions menu.


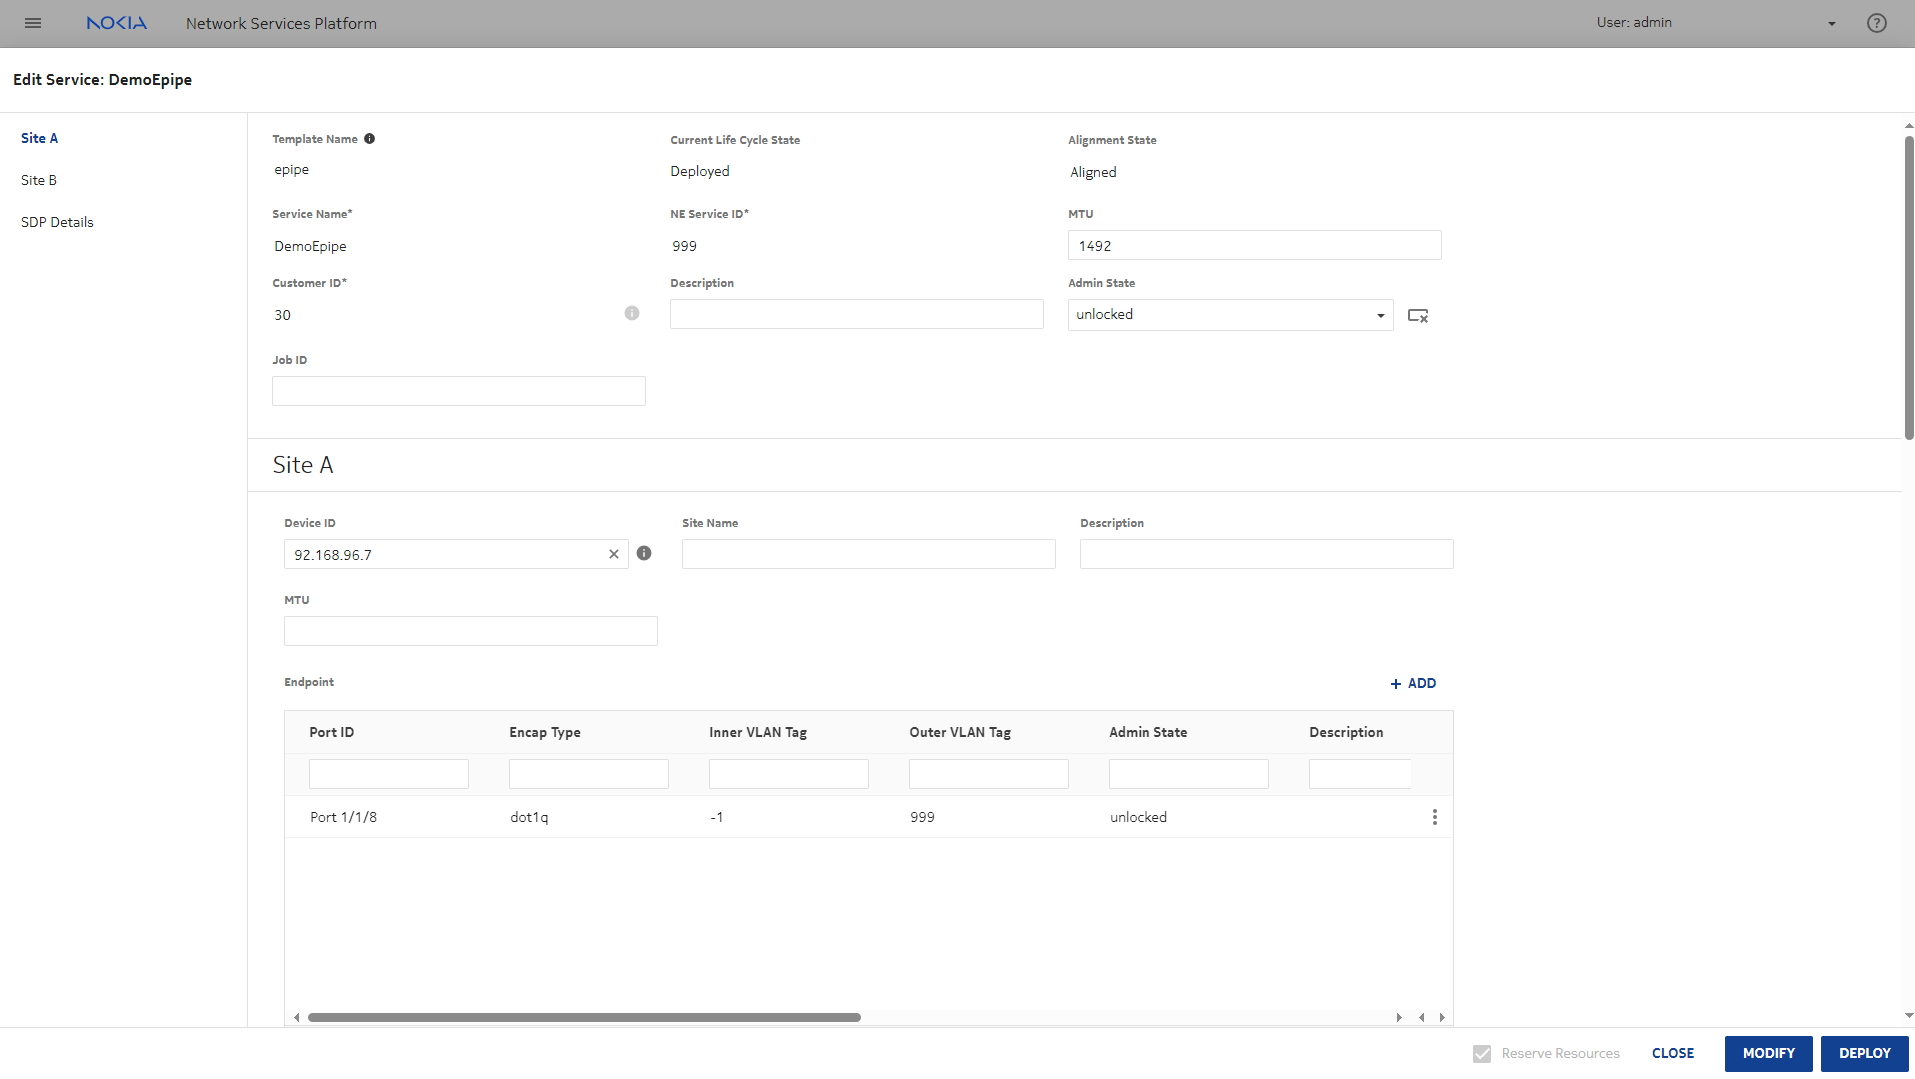
The Edit service form shows the basic service parameters such as service name and customer ID, and the service endpoints.


Site A of the service is on node B. Select the endpoint and choose Edit to verify the endpoint parameters.

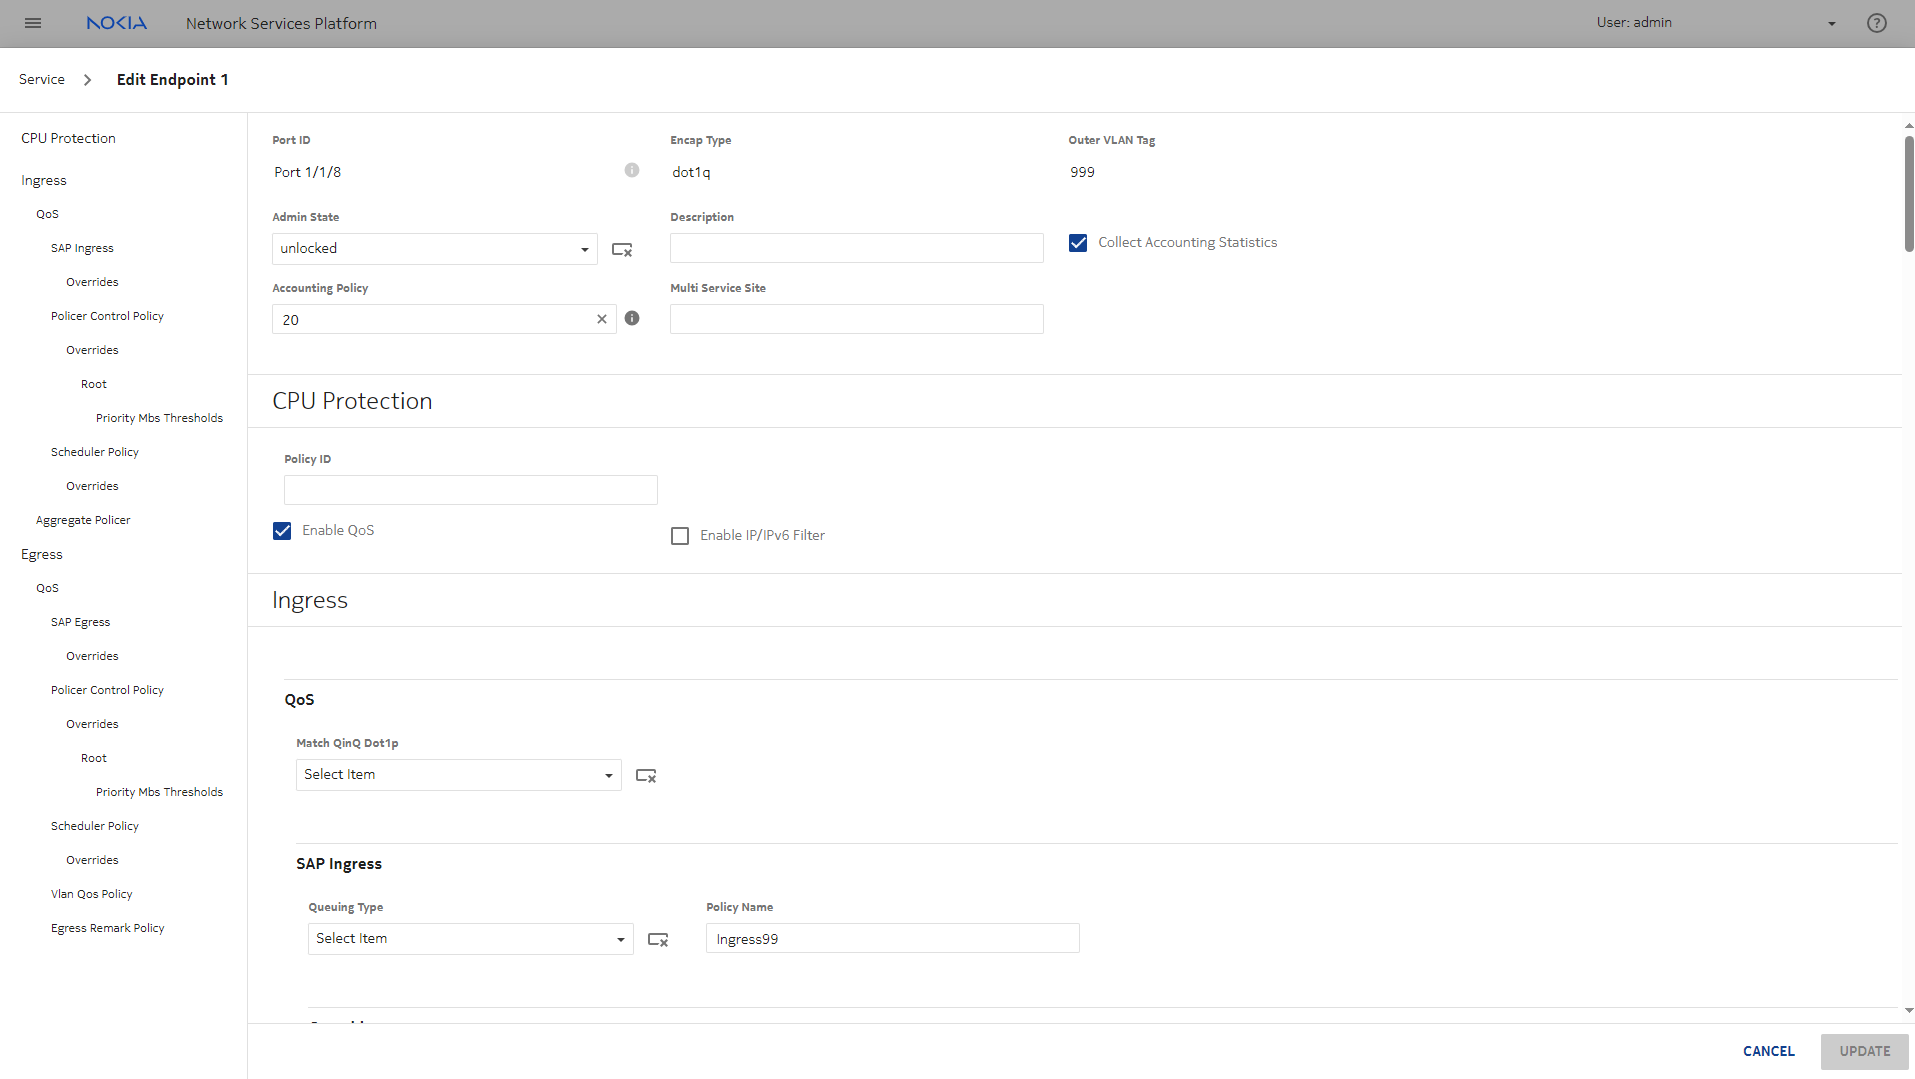
In the Edit Endpoint form, we can see the ingress and egress QoS policies applied, and any overrides that have been added.


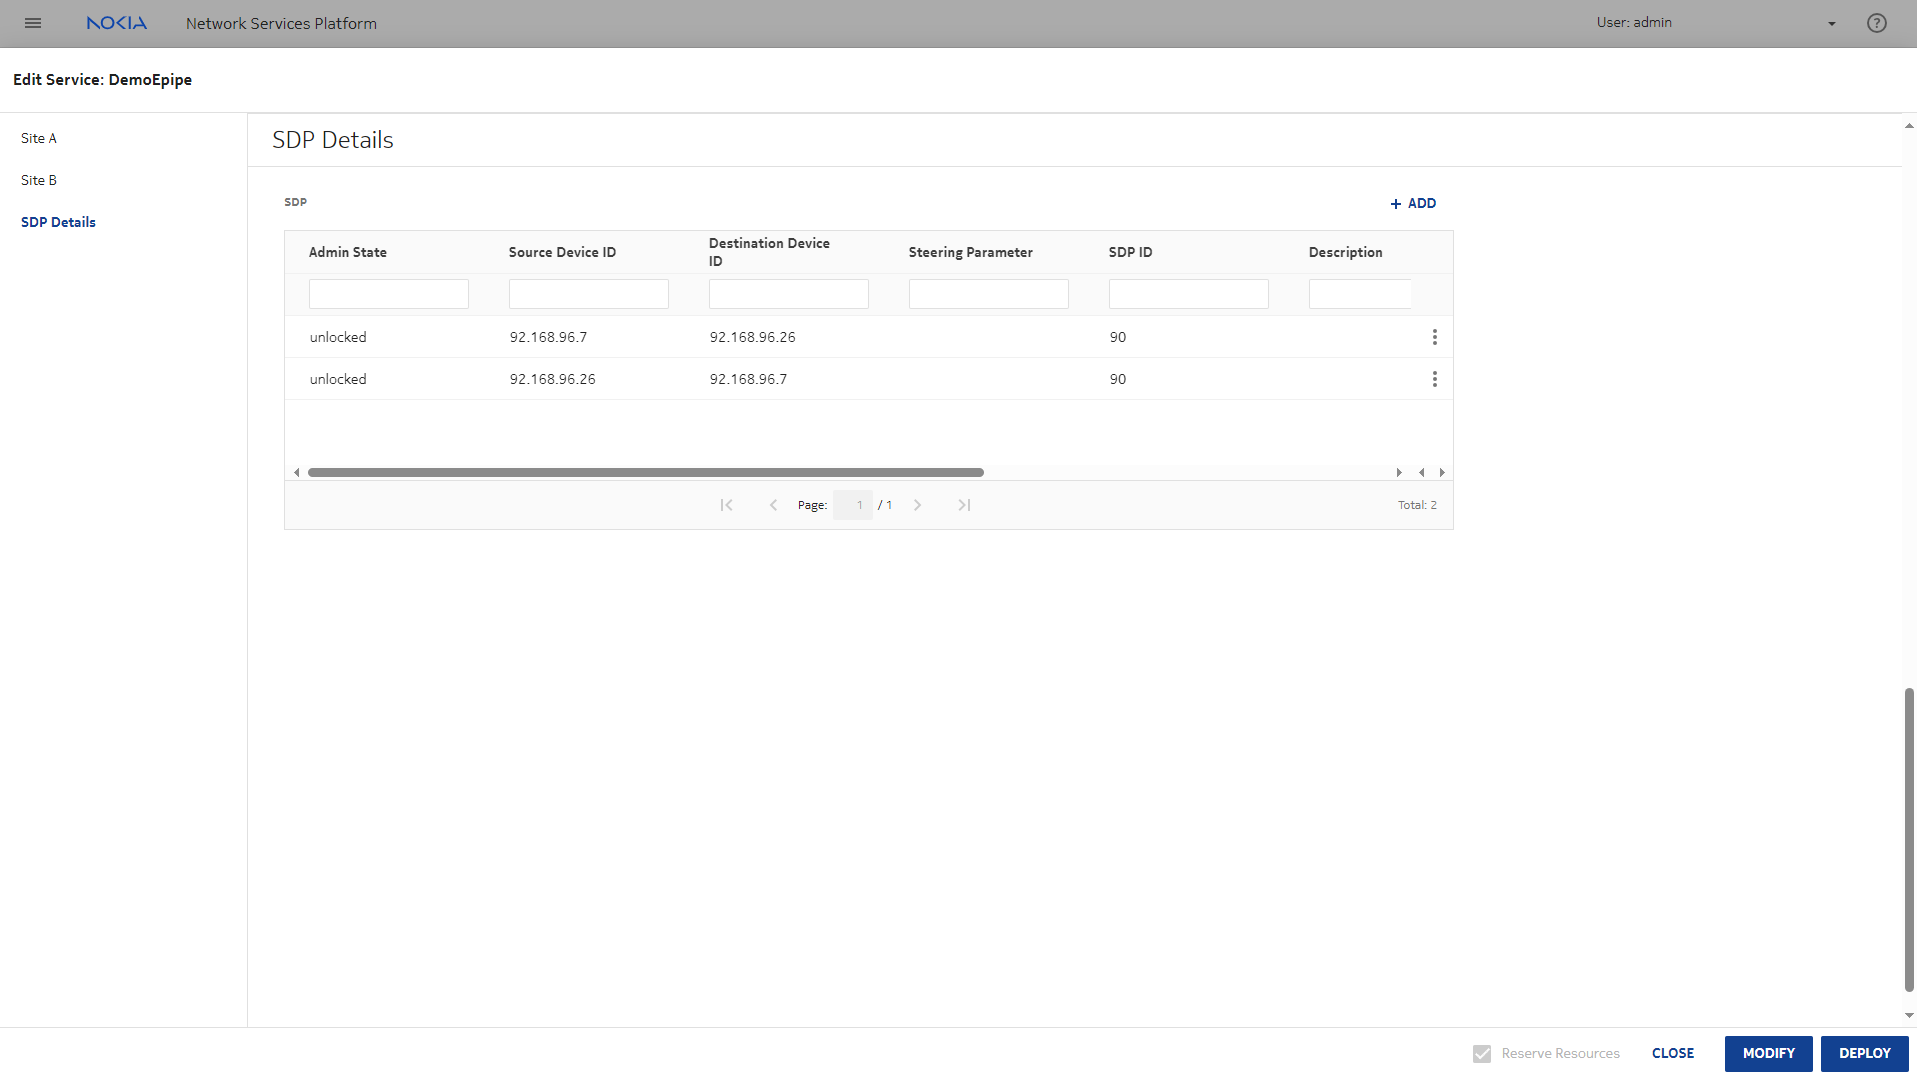
Returning to the Edit Service form, we can see the SDP details, the service destination points. An SDP has been added to the service for each direction.

Each SDP uses an LSP, and it’s this LSP that will provide the throughput telemetry data for our report.

Verify accounting policy configuration
 

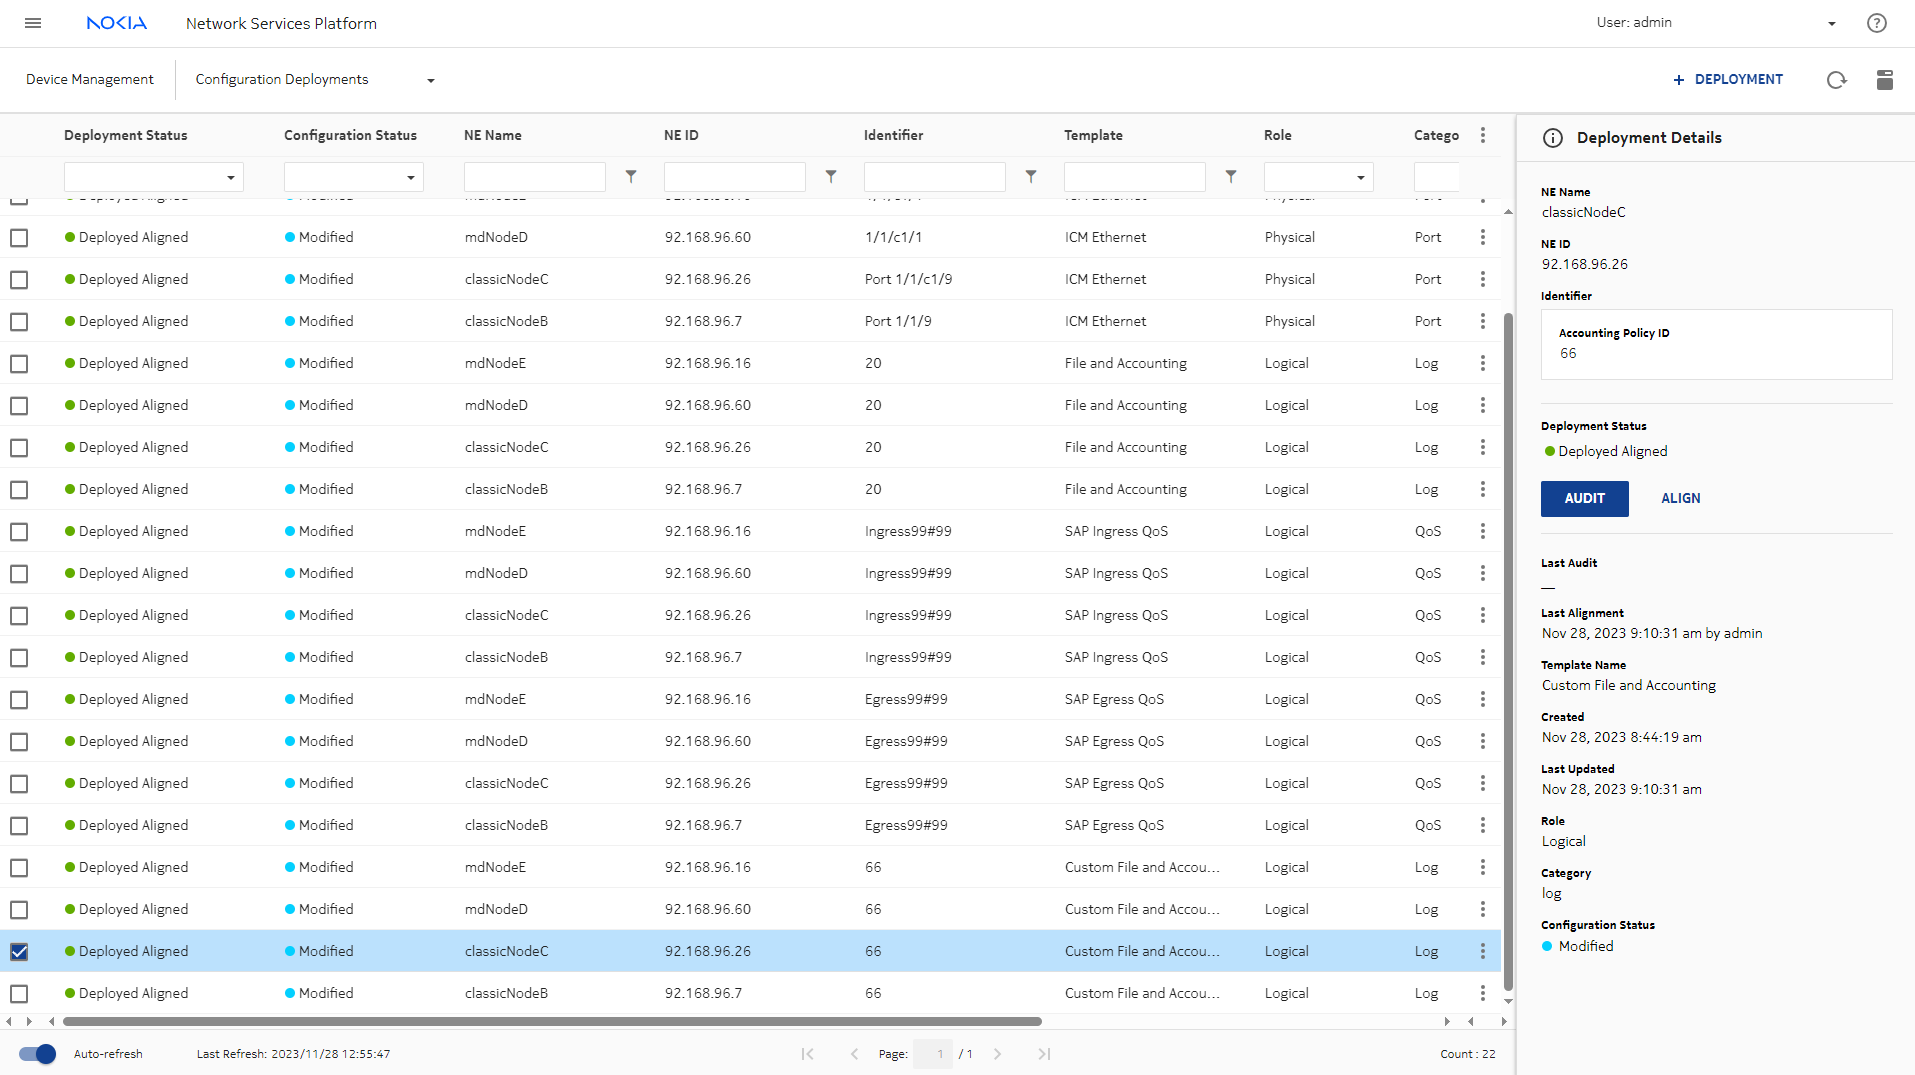
To collect statistics on an NE, a file and accounting policy must be configured on the NE. This can be done by deploying a template in the Device Management, Configuration Deployments view.

In the Configuration Deployments list, we can see that a template called Custom File and Accounting has been deployed on the NE and the Deployment Status is Deployed Aligned.


We can view the template details to see policy details:

  1. Select the deployment and choose View/Edit from the Table row actions menu.

  2. In the form that opens, click VIEW/EDIT TEMPLATE CONFIG.

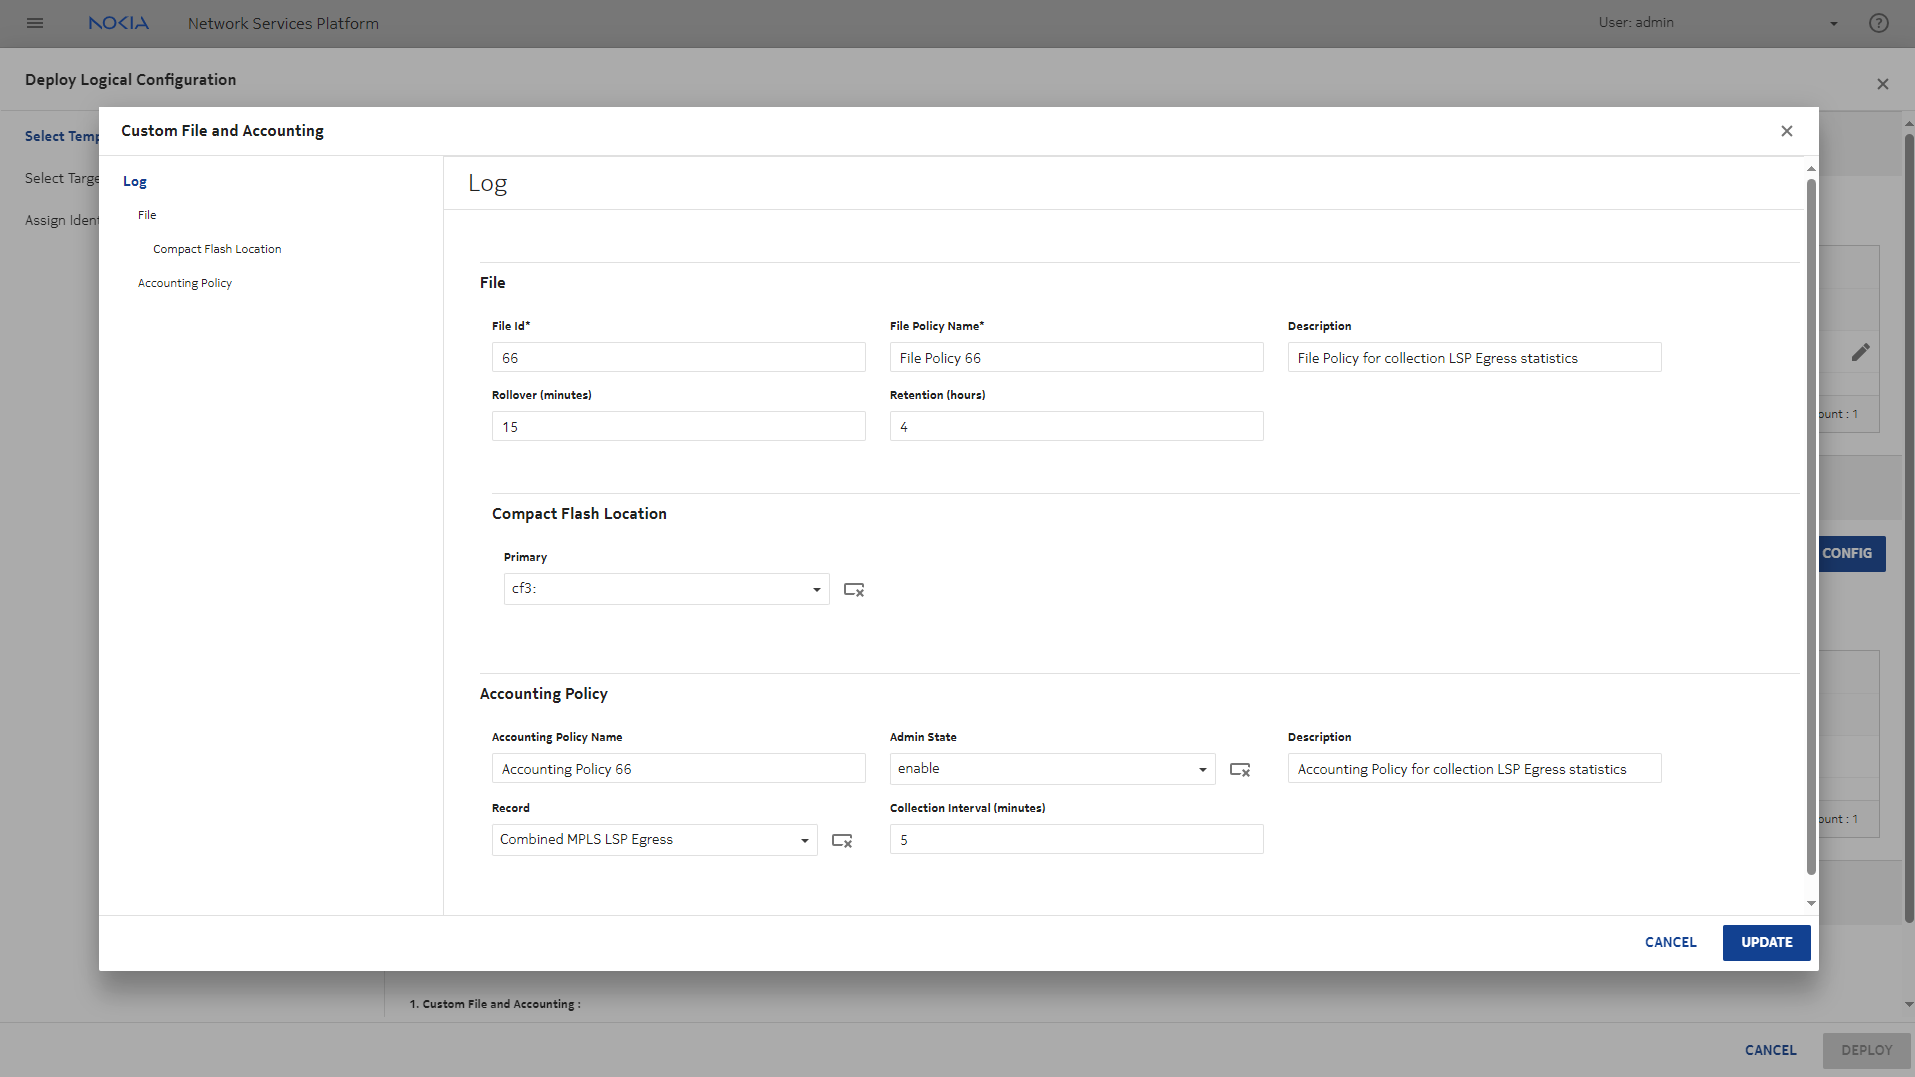
The template information shows the rollover duration, or how long a statistics collection file remains open before a new file is started, the retention period for the file, and the compact flash location where the file is stored. Accounting policy details show that the policy applied is number 66, and it will be collecting Combined MPLS LSP Egress statistics.

Verify the LSP parameters
 

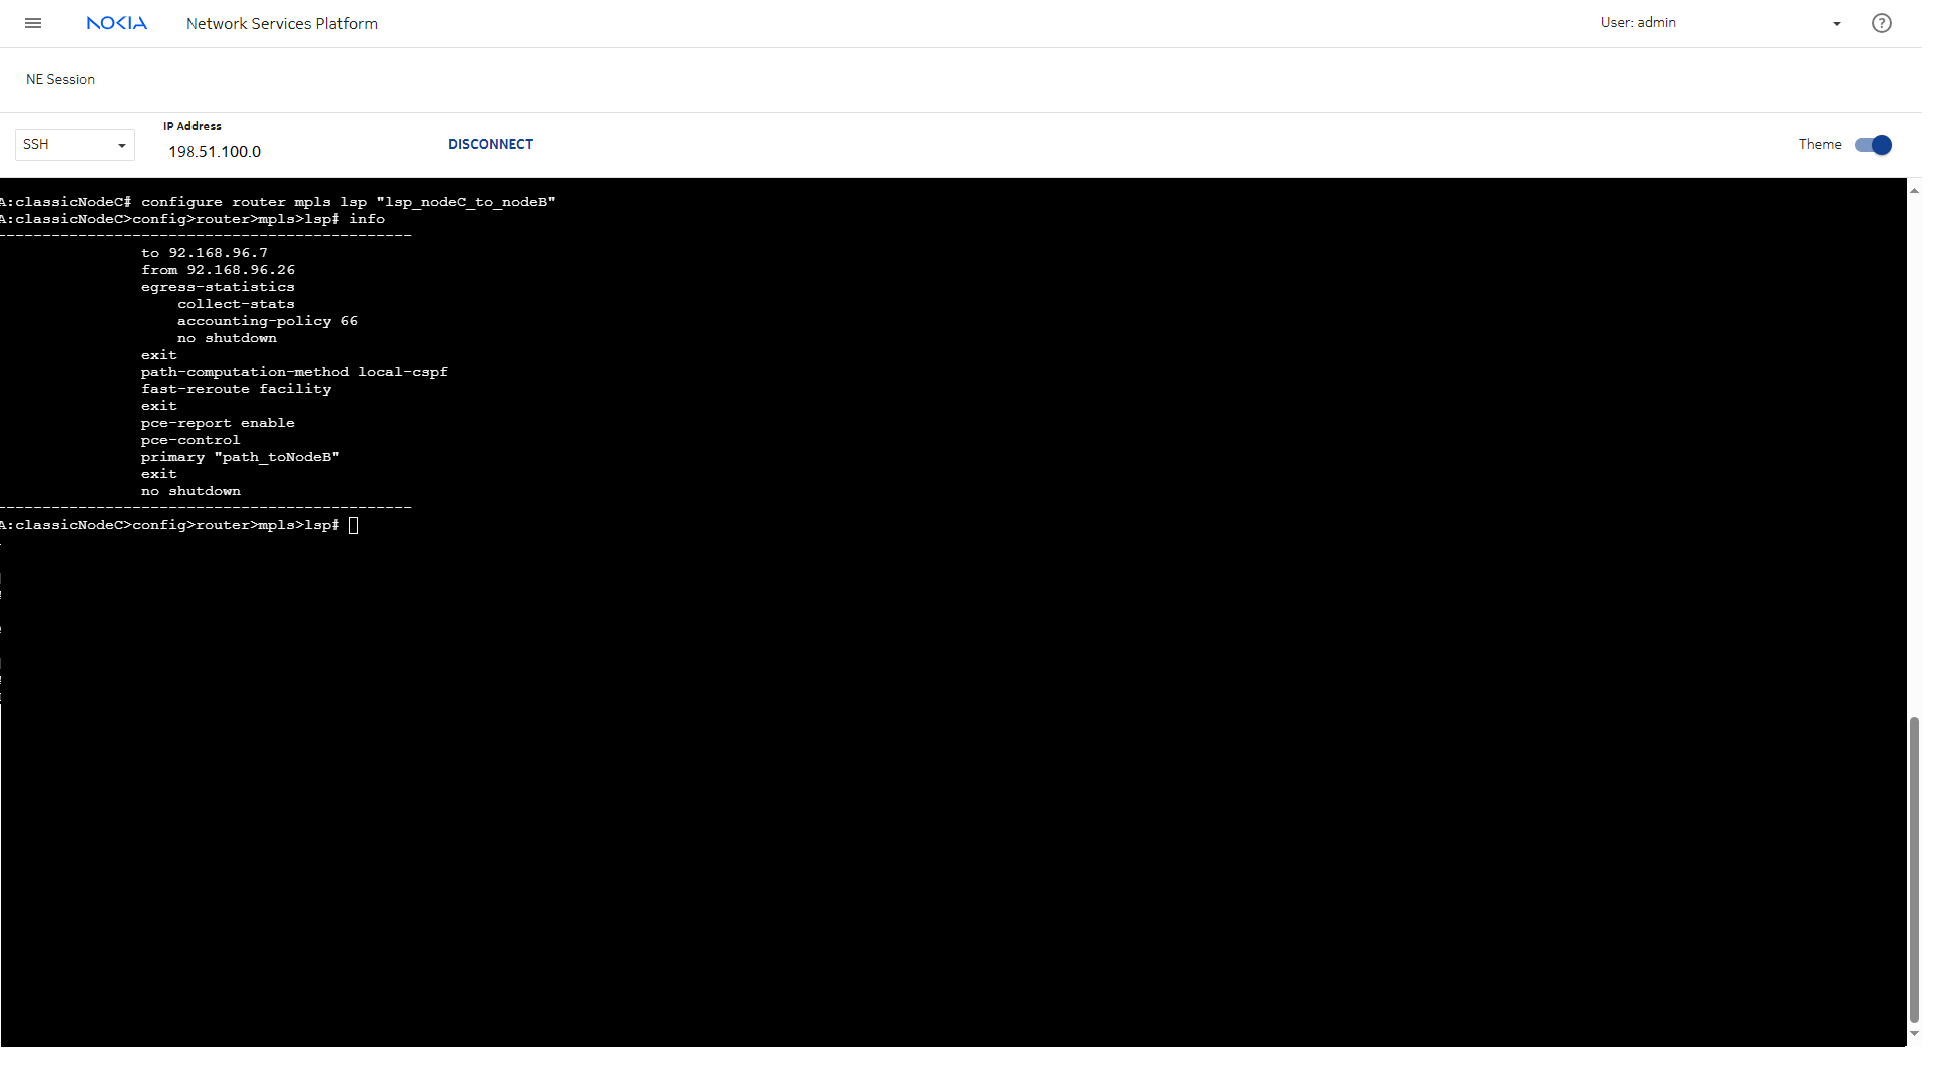
LSPs must be configured on the NE. Opening an NE session will show us the configuration of the LSP in use by the SDP. It’s called lsp_NodeC_to_nodeB.

We can see that an accounting policy is in place on the LSP, and collection of egress statistics is enabled. These are required for any LSPs we want to monitor for LSP Throughput reporting.

The account policy ID for this LSP is 66.

Verify statistics collection configuration

Now that we have verified that the service and LSP are configured, we can confirm that statistics collection has been set up.


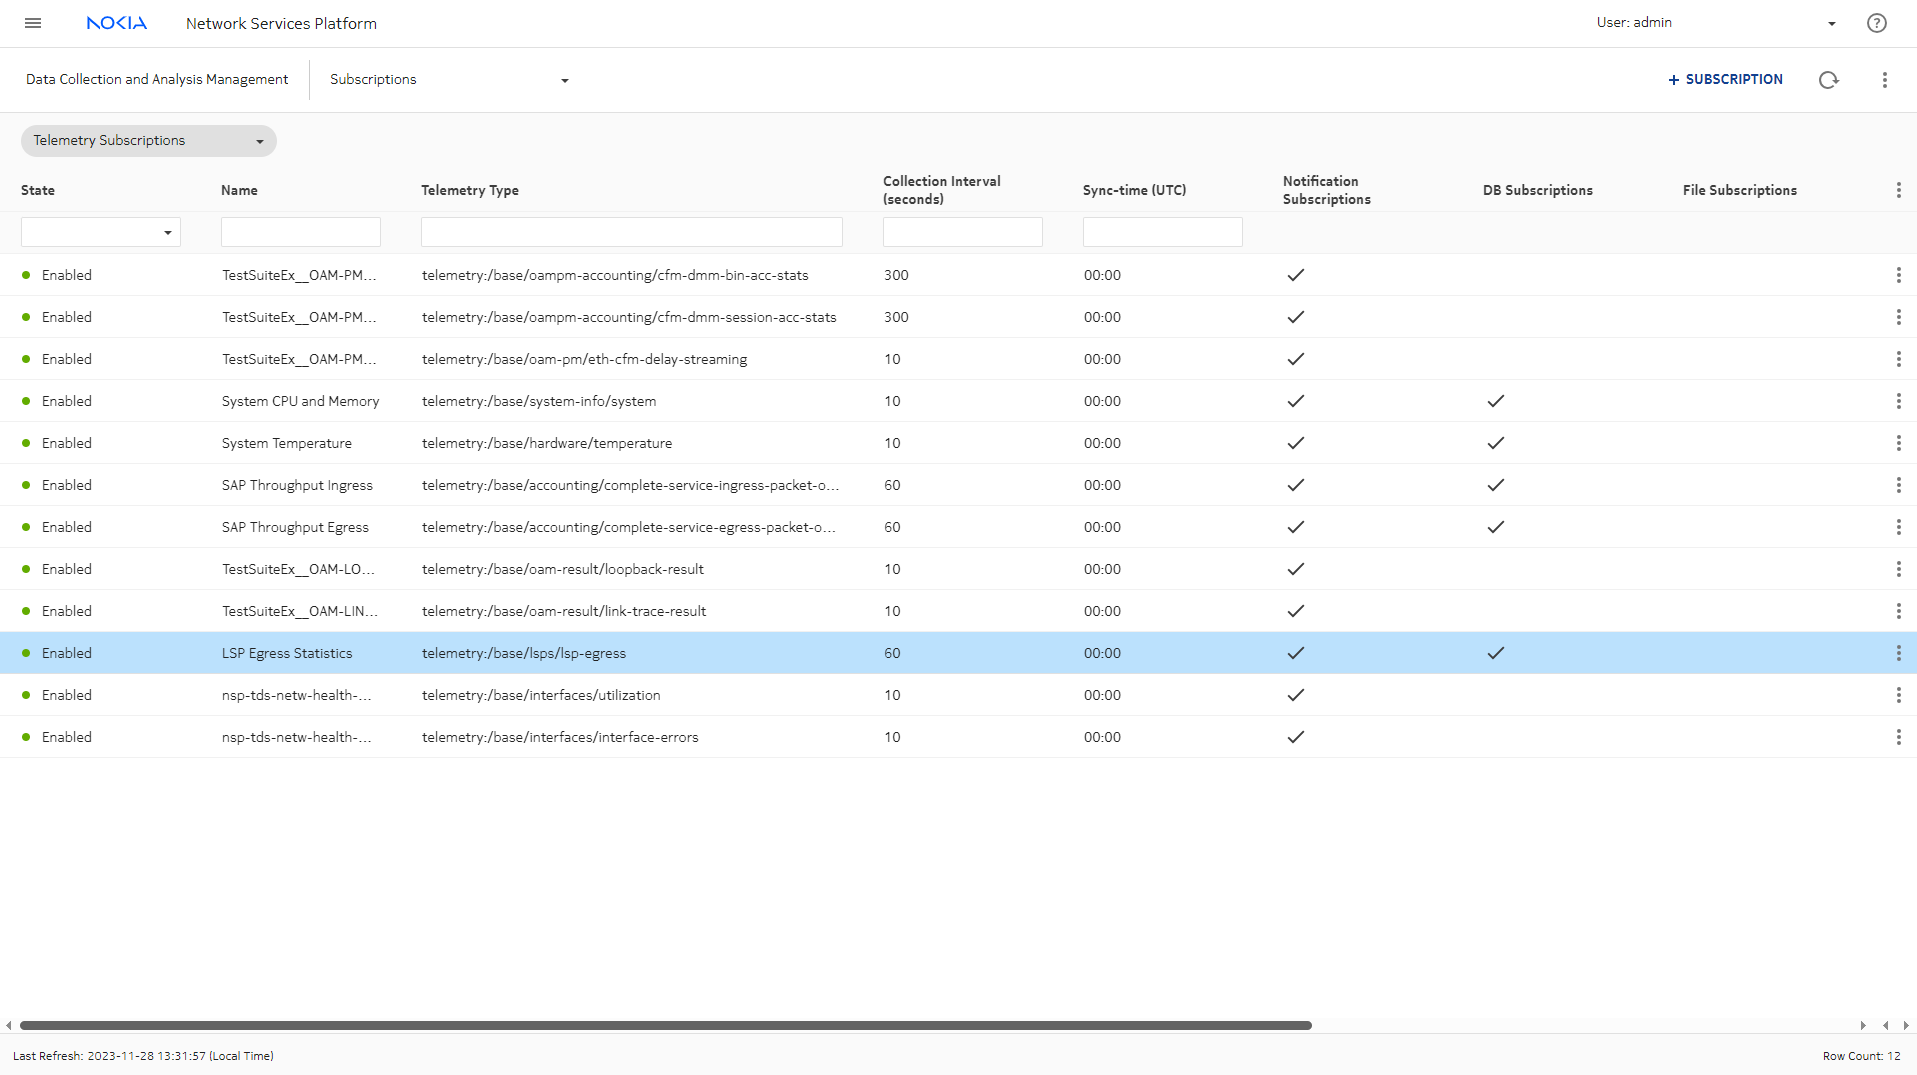
In the Data Collection and Analysis Management, Subscriptions view, we can see that there is a subscription called LSP Egress Statistics.

The telemetry type is base/lsps/lsp-egress. The collection interval is 60 s, meaning that every minute the NSP will collect the statistics from the node.

Most important, database subscriptions are enabled. Data is stored in the auxiliary database, where it will be available to Analytics.


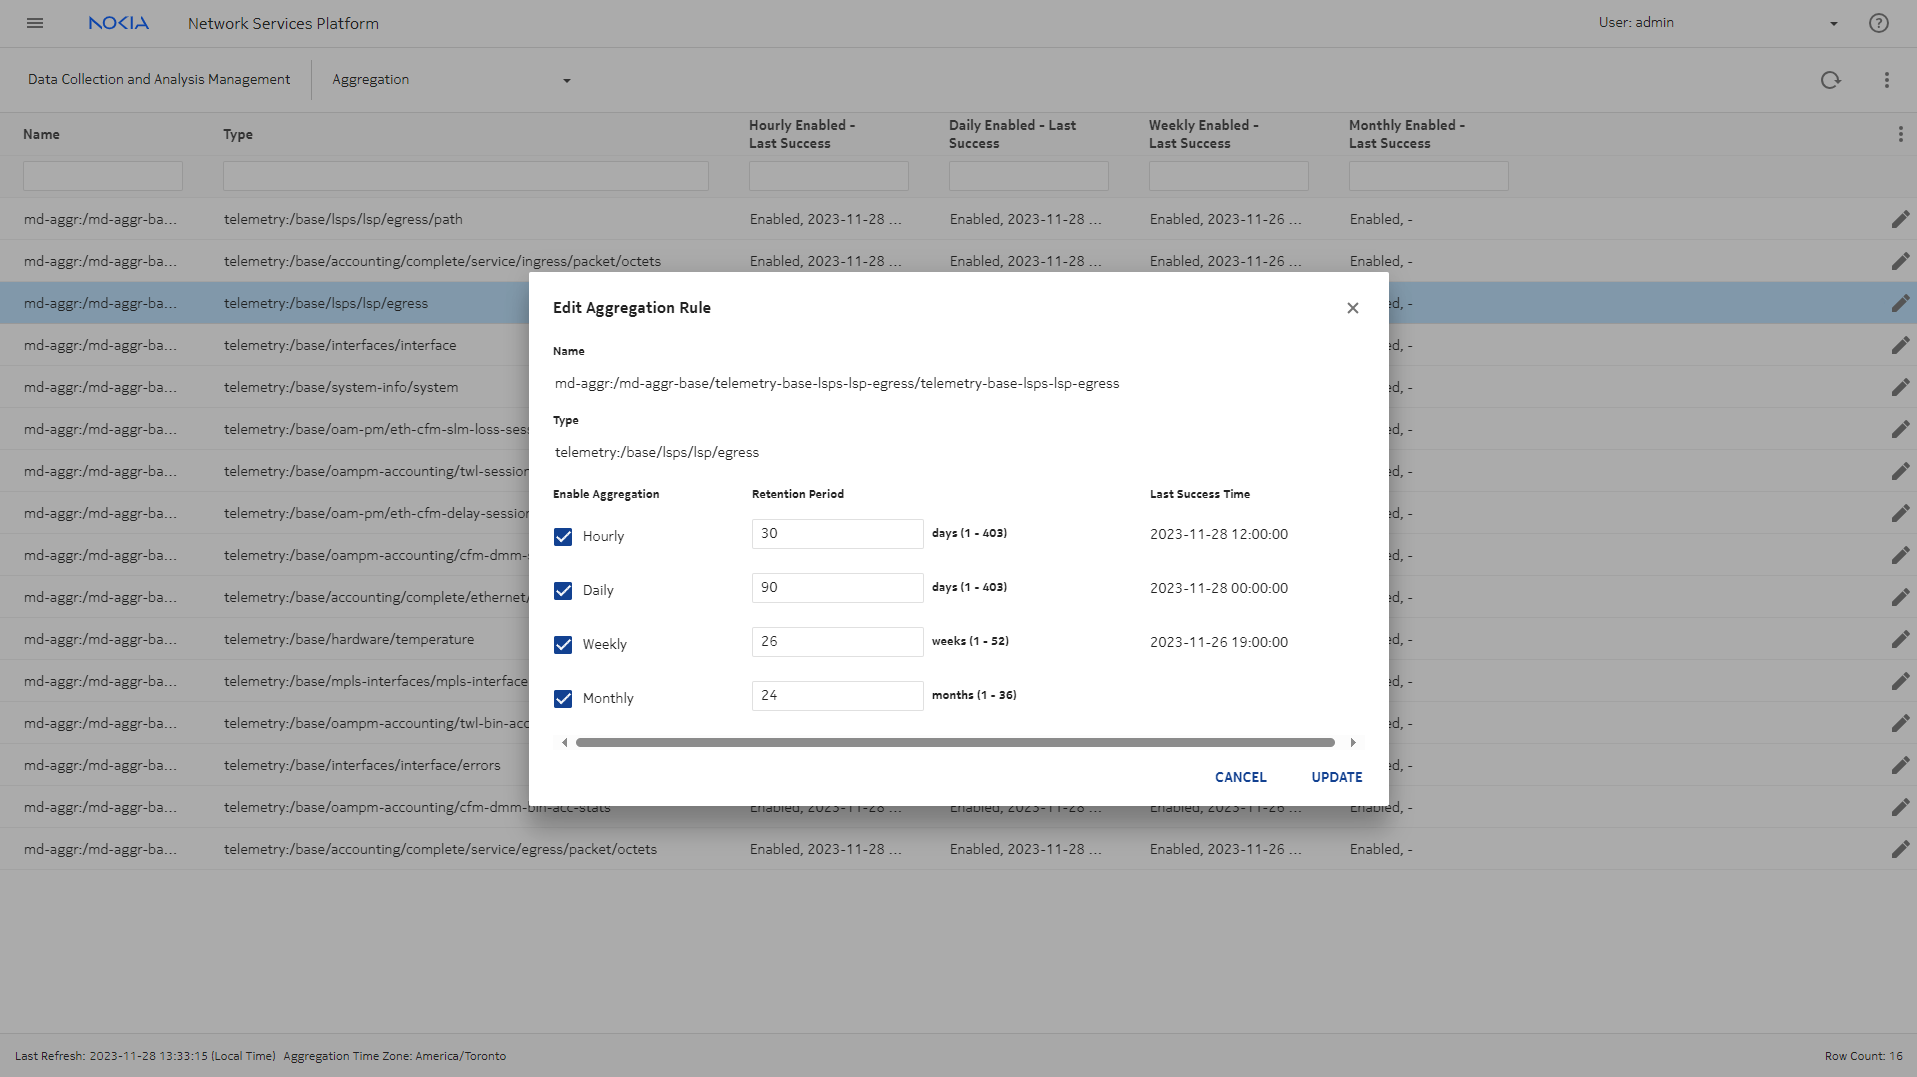
The report we need creates forecasts based on aggregated data. Switching to the Data Collection and Analysis Management, Aggregation view, we’ll take a look at the aggregation settings for the telemetry type. Select the telemetry type and click Edit.

Here we see that all aggregation types are enabled, and the retention period is set for each. The Last Success Time can also be used to verify that the subscriptions are working. For example, the last success time for daily aggregation should not be longer than a day ago.


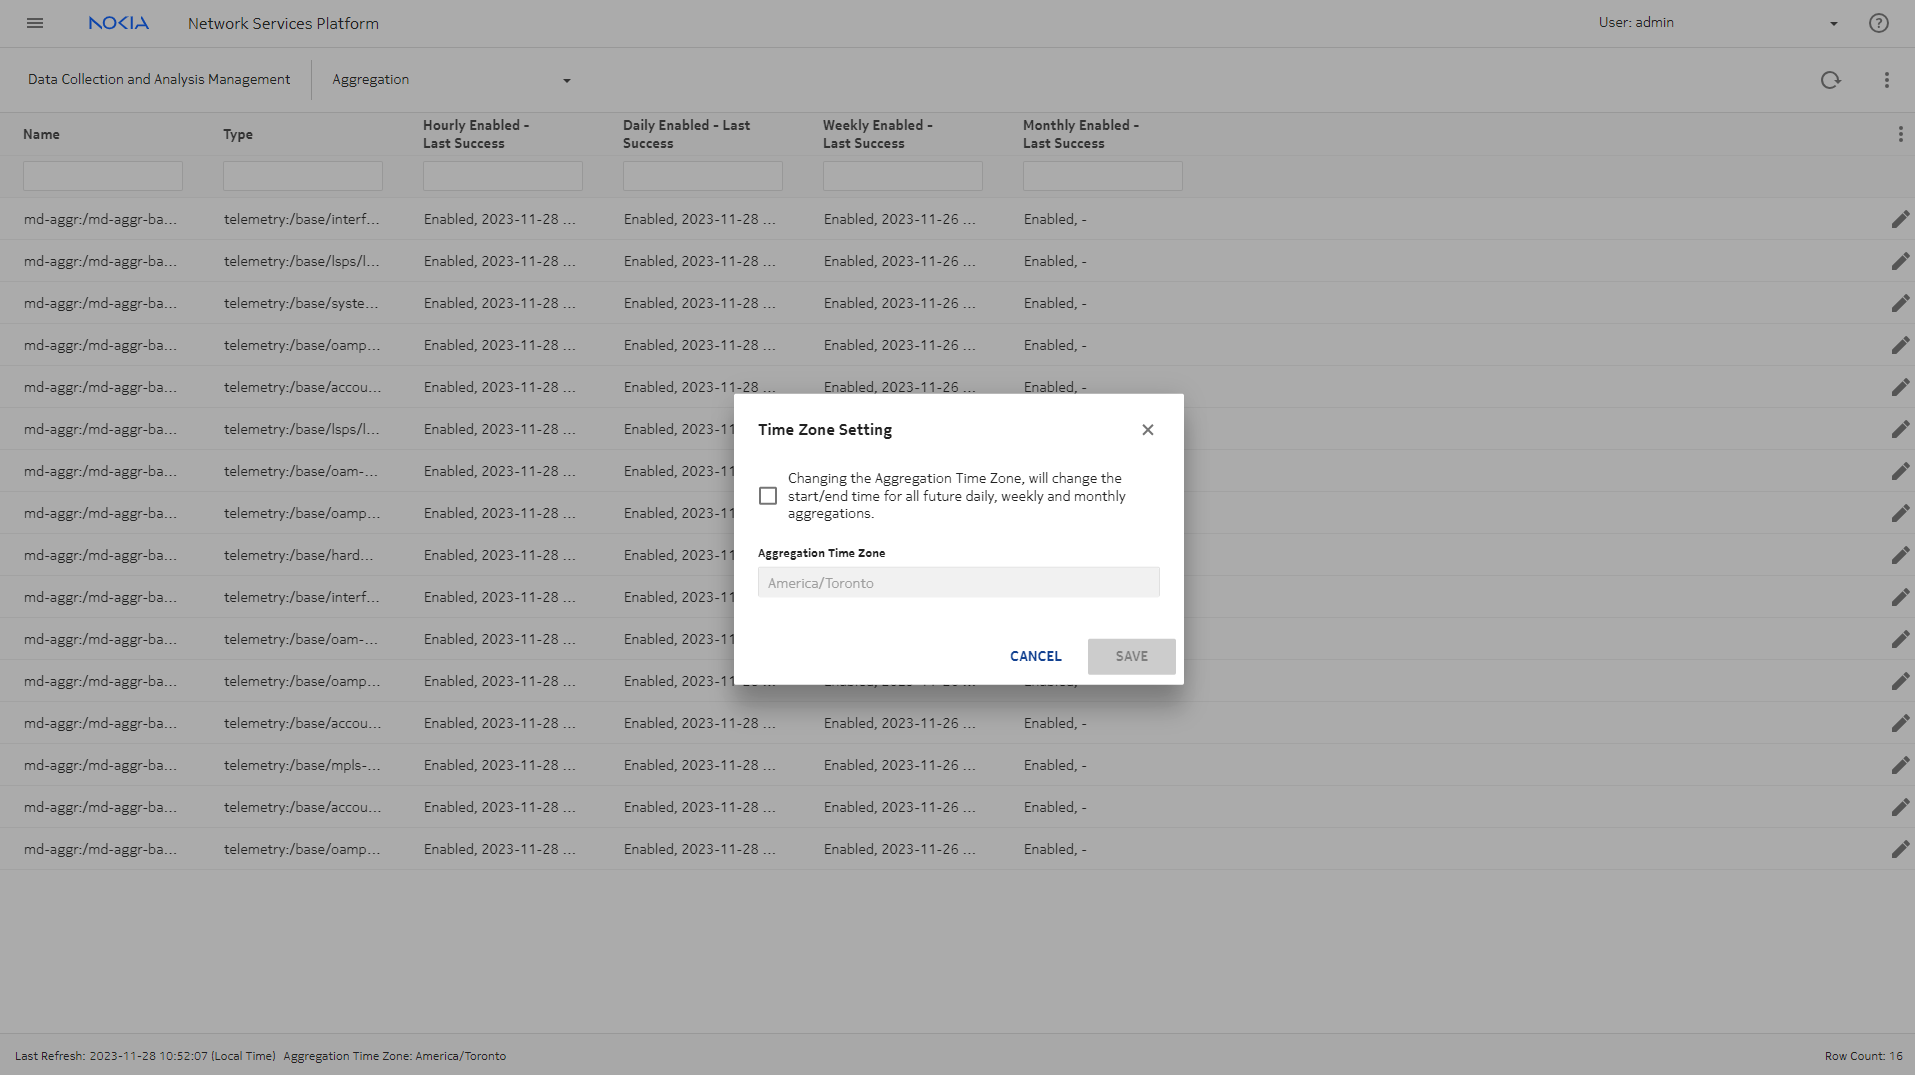
We also need to confirm that the aggregation time zone has been set correctly. If the aggregation time zone doesn’t match the reporting time zone, Analytics will show an error when we try to generate an aggregated report. Click on the More Actions menu at the top of the page and select Time Zone Setting.

The time zone has been set to local time.


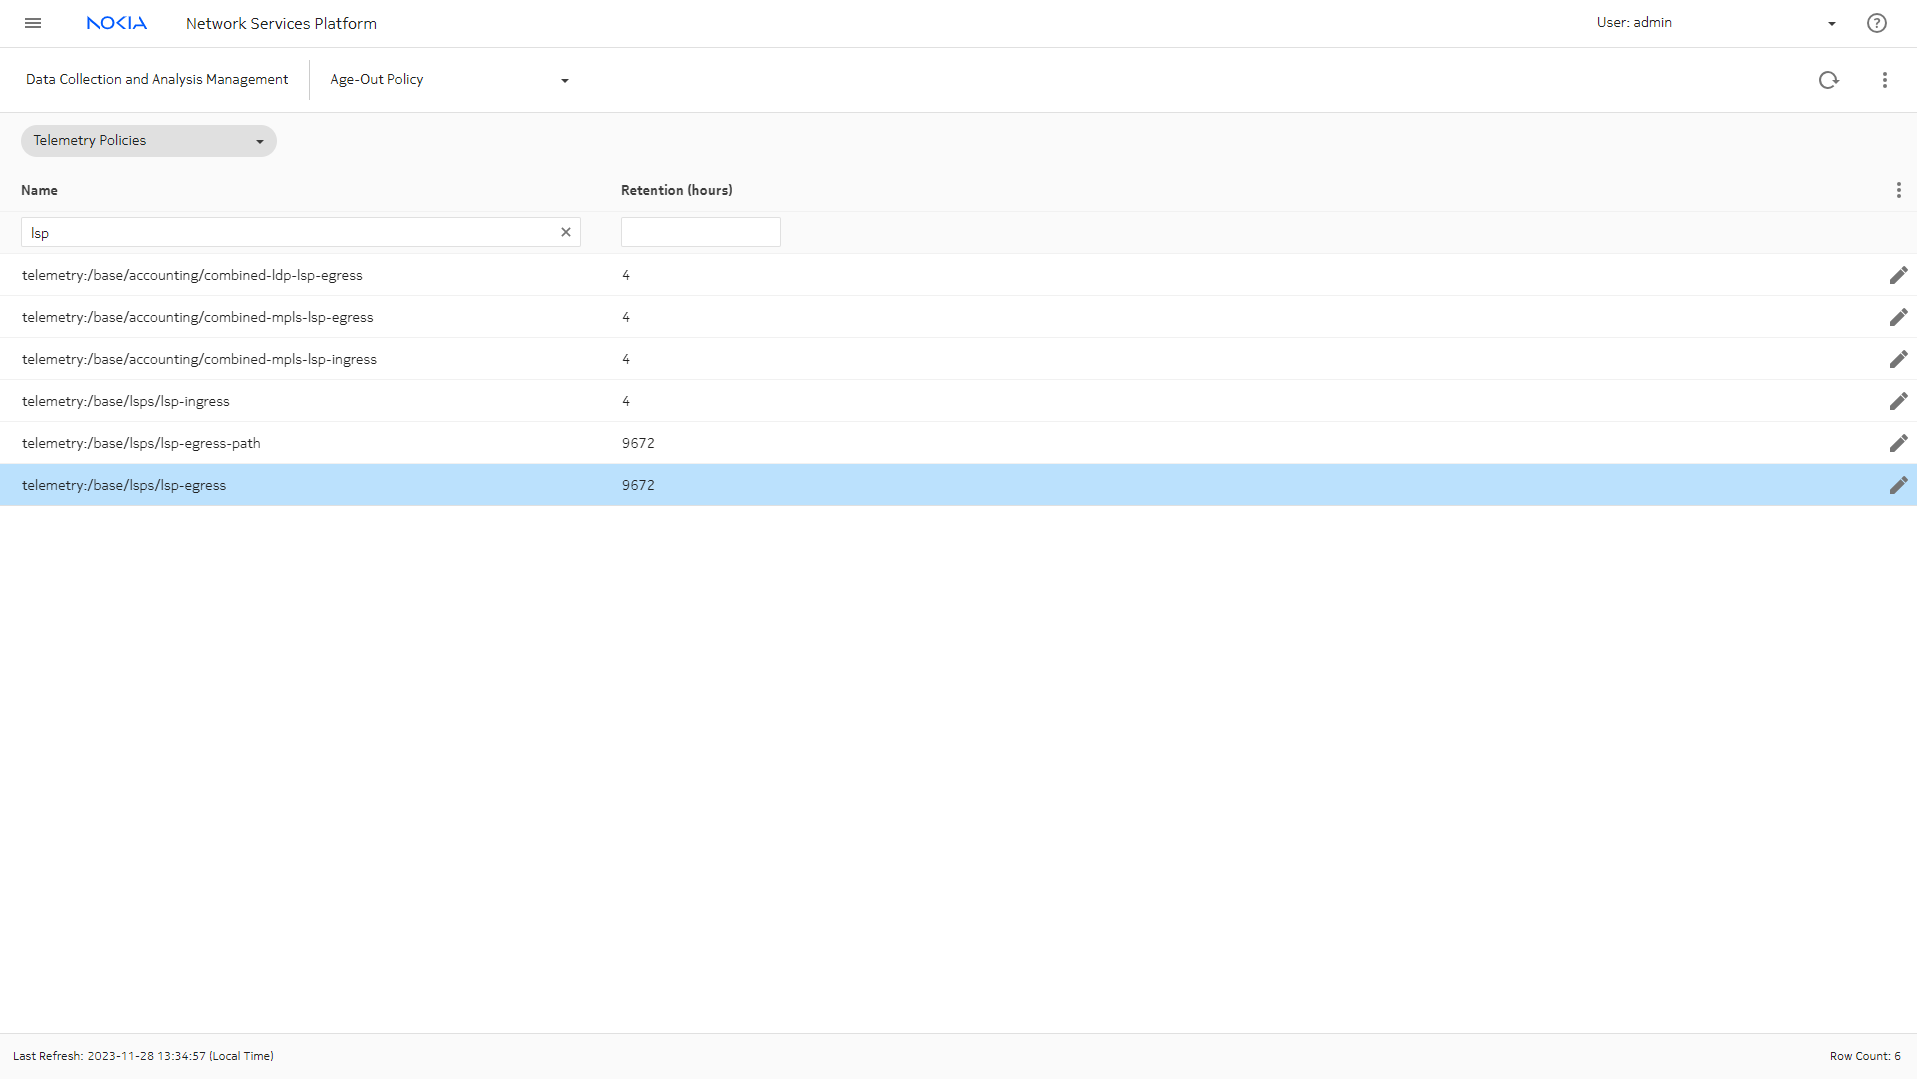
To generate a report using daily or monthly data, we need to ensure we have an appropriate retention policy for the telemetry type. Switching to the Data Collection and Analysis Management, Age-Out Policy view, we can see that the retention policy for the telemetry type has been set to the maximum.

Generate the report in Analytics

Now that we’ve confirmed that all the prerequisites are in place, we can run the report.
 

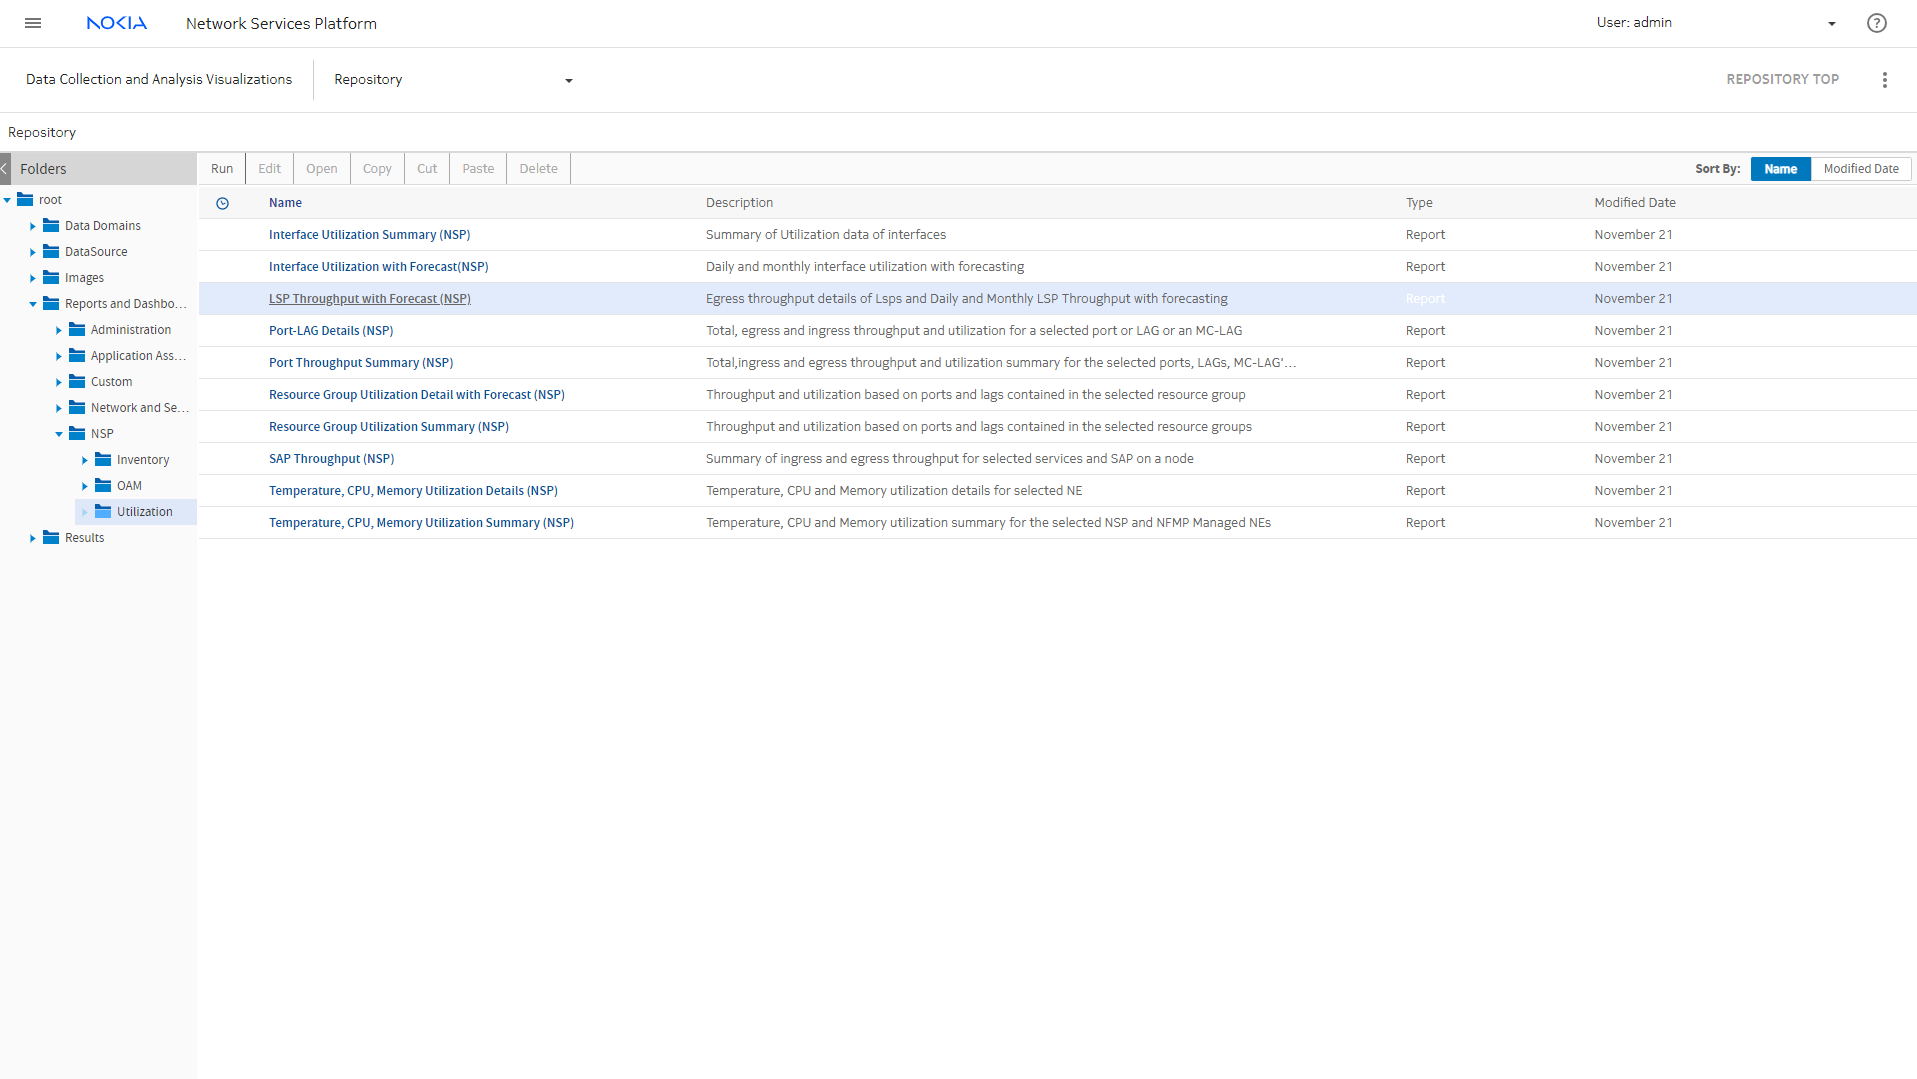
In the Analytics repository, the report we need is under Reports and Dashboards, NSP, Utilization. Navigate through the folders and choose LSP Throughput with Forecast (NSP).


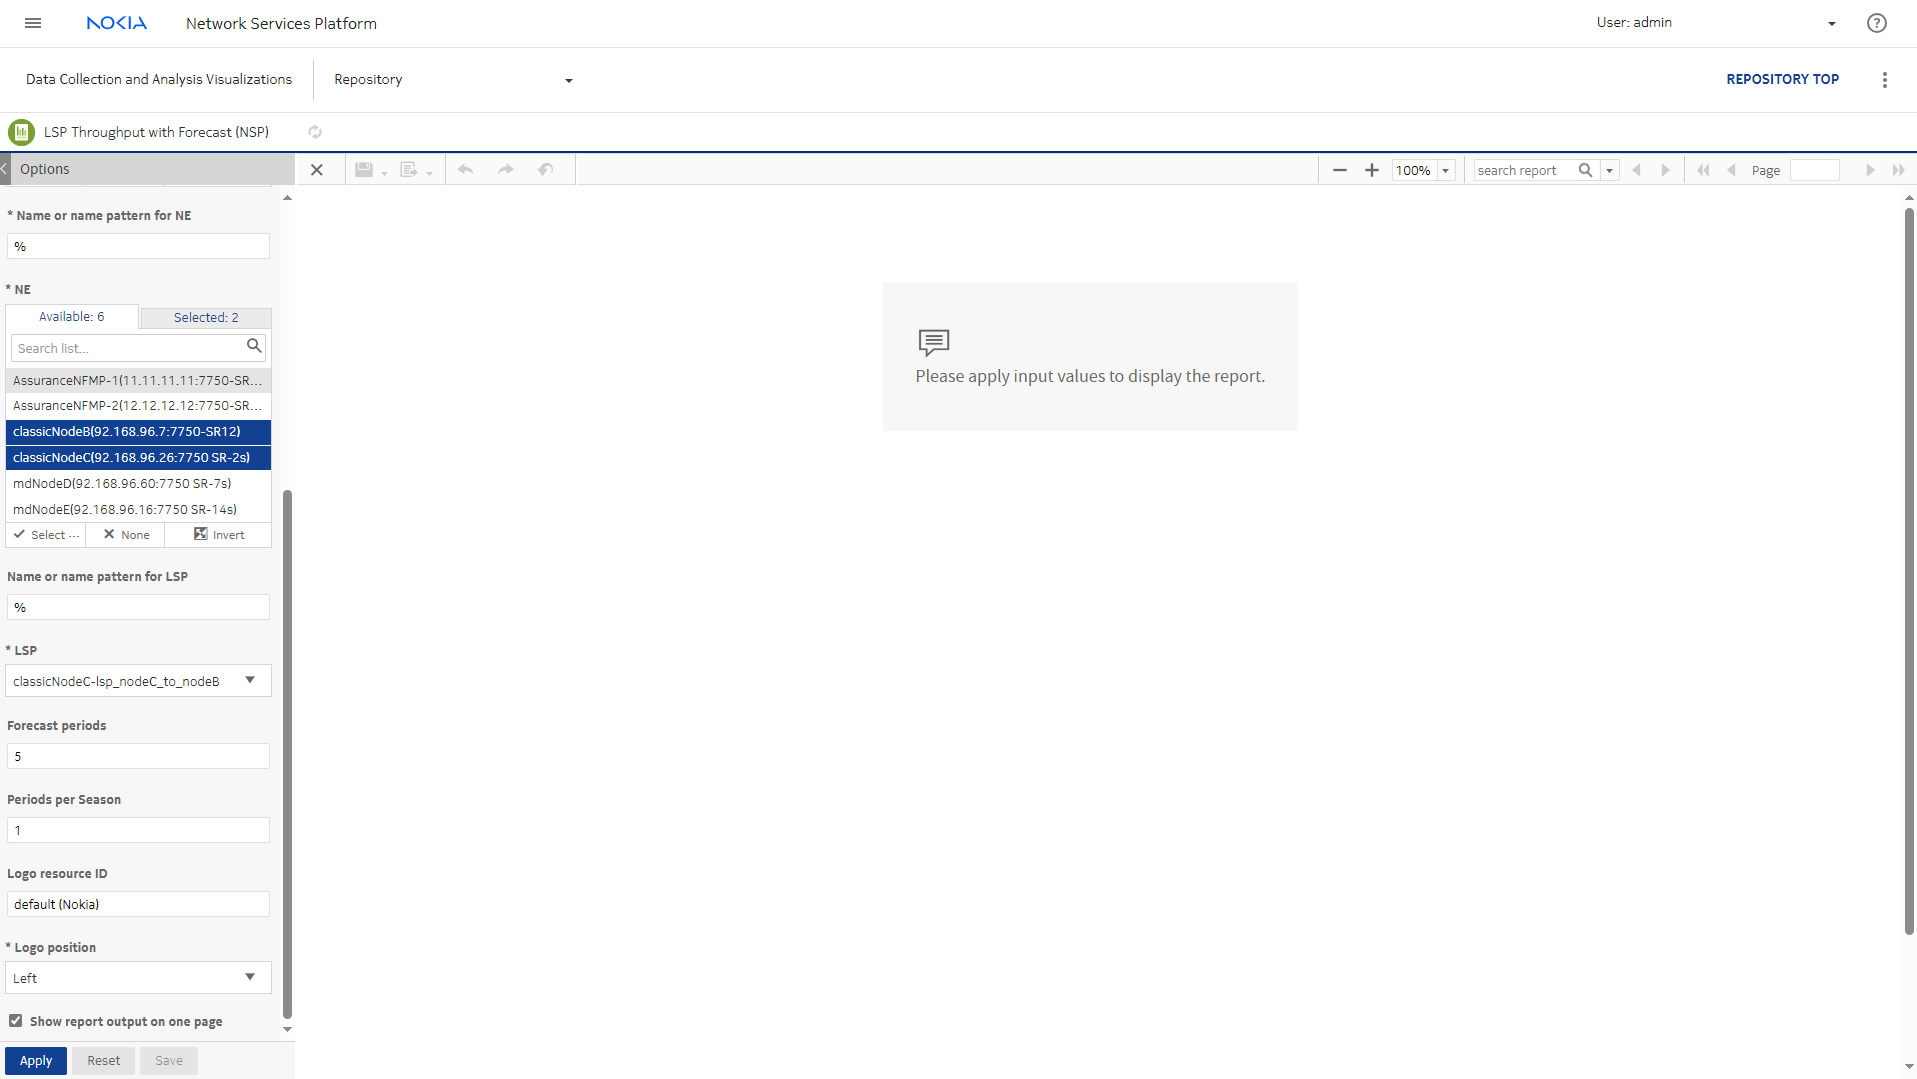
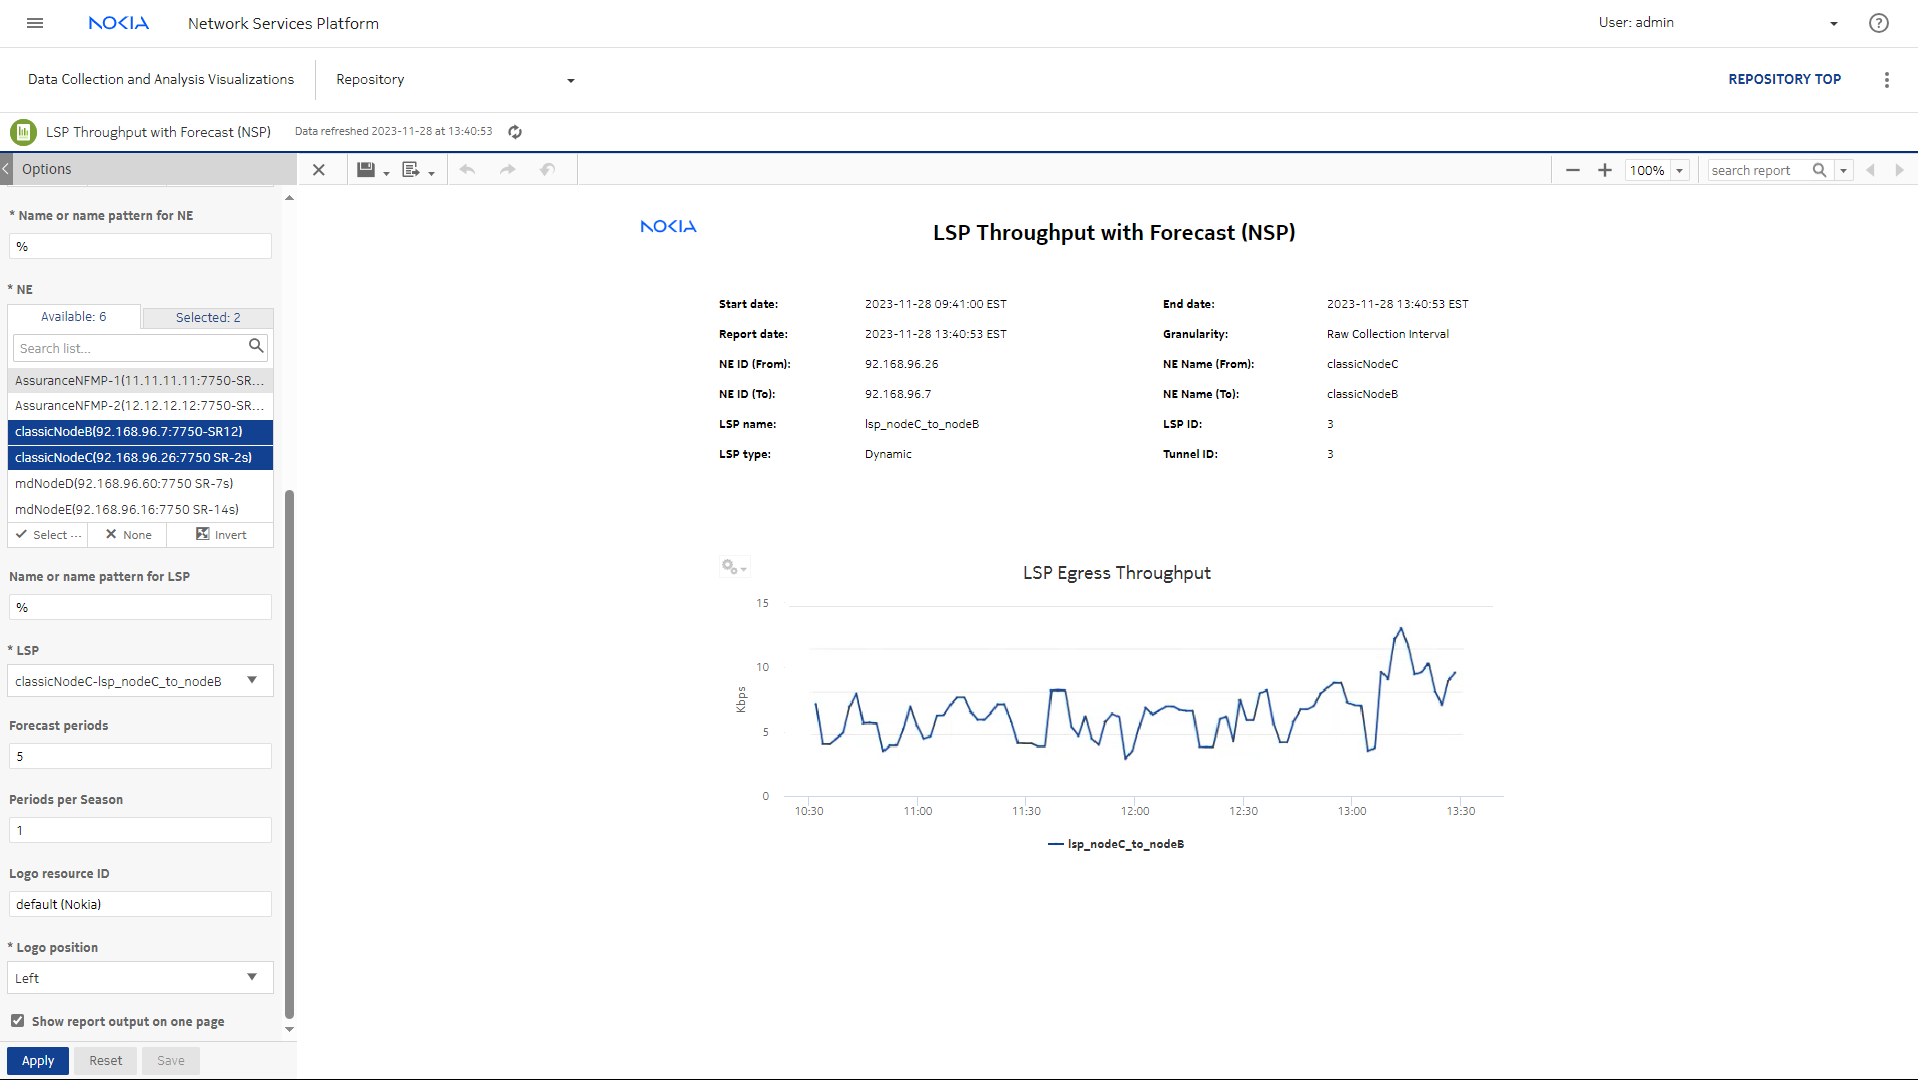
We’ll start with a raw data report.

  1. Select all the NE types.

  2. In the NE list, choose NEs that host the service endpoints.

  3. In the LSP field, choose the LSP between the two NEs.

  4. Select the Show report output on one page check box.

  5. Click Apply.

The report shows the raw LSP utilization data.


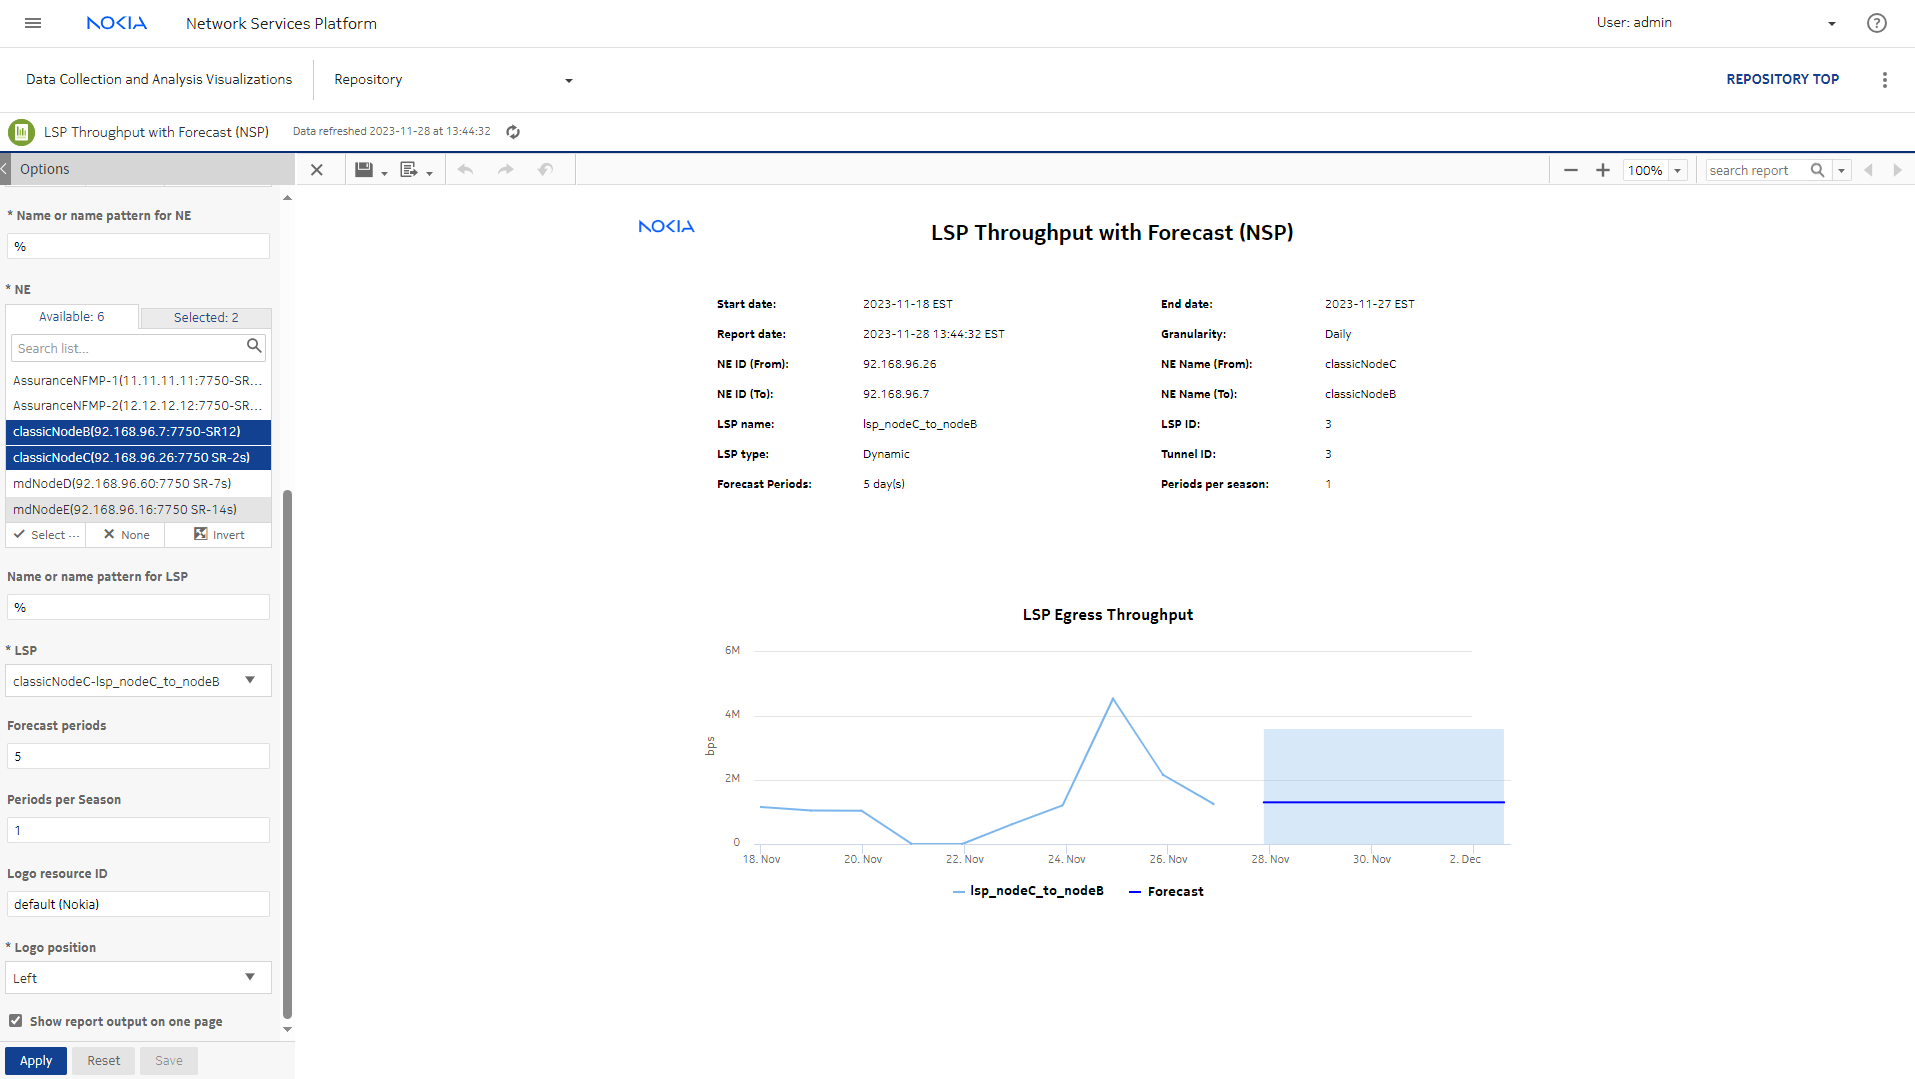
Next, we’ll re-run the report on daily aggregated data. When you run this report with daily or monthly aggregation, a forecast is provided.

We’ll set the report range to 10 days, the forecast periods to 5 and the periods per season to 1.

Periods per season refers to the number of aggregations you want to track to see a repeating pattern. For example, to see a weekly pattern with daily aggregation, you would set Periods per season to 7. Setting this to one means we expect traffic to be similar from one day to the next.

To generate a forecast, you must provide at least two seasons of data, although more may be required if the input data is not linear. For example, if you choose a periods per season value of 7 and the granularity is daily, you must use a report range of at least 14 days.


View the report.

This report shows the 10 days of collected data and 5 days of forecasting based on that data. The blank space on the graph indicates that data hasn’t been aggregated yet for the current date.

After the current date is the forecasted data. The shading shows the upper and lower range of the predicted throughput, and the line shows the expected throughput value for the next five days.