End-to-end link troubleshooting scenario

Purpose

This process shows you how to use NSP in troubleshooting issues on links.

In this scenario, a link is experiencing problems.

View the Network Map
 

The Network Map provides a graphical view of links in the network. Problem links are displayed in red on the map.

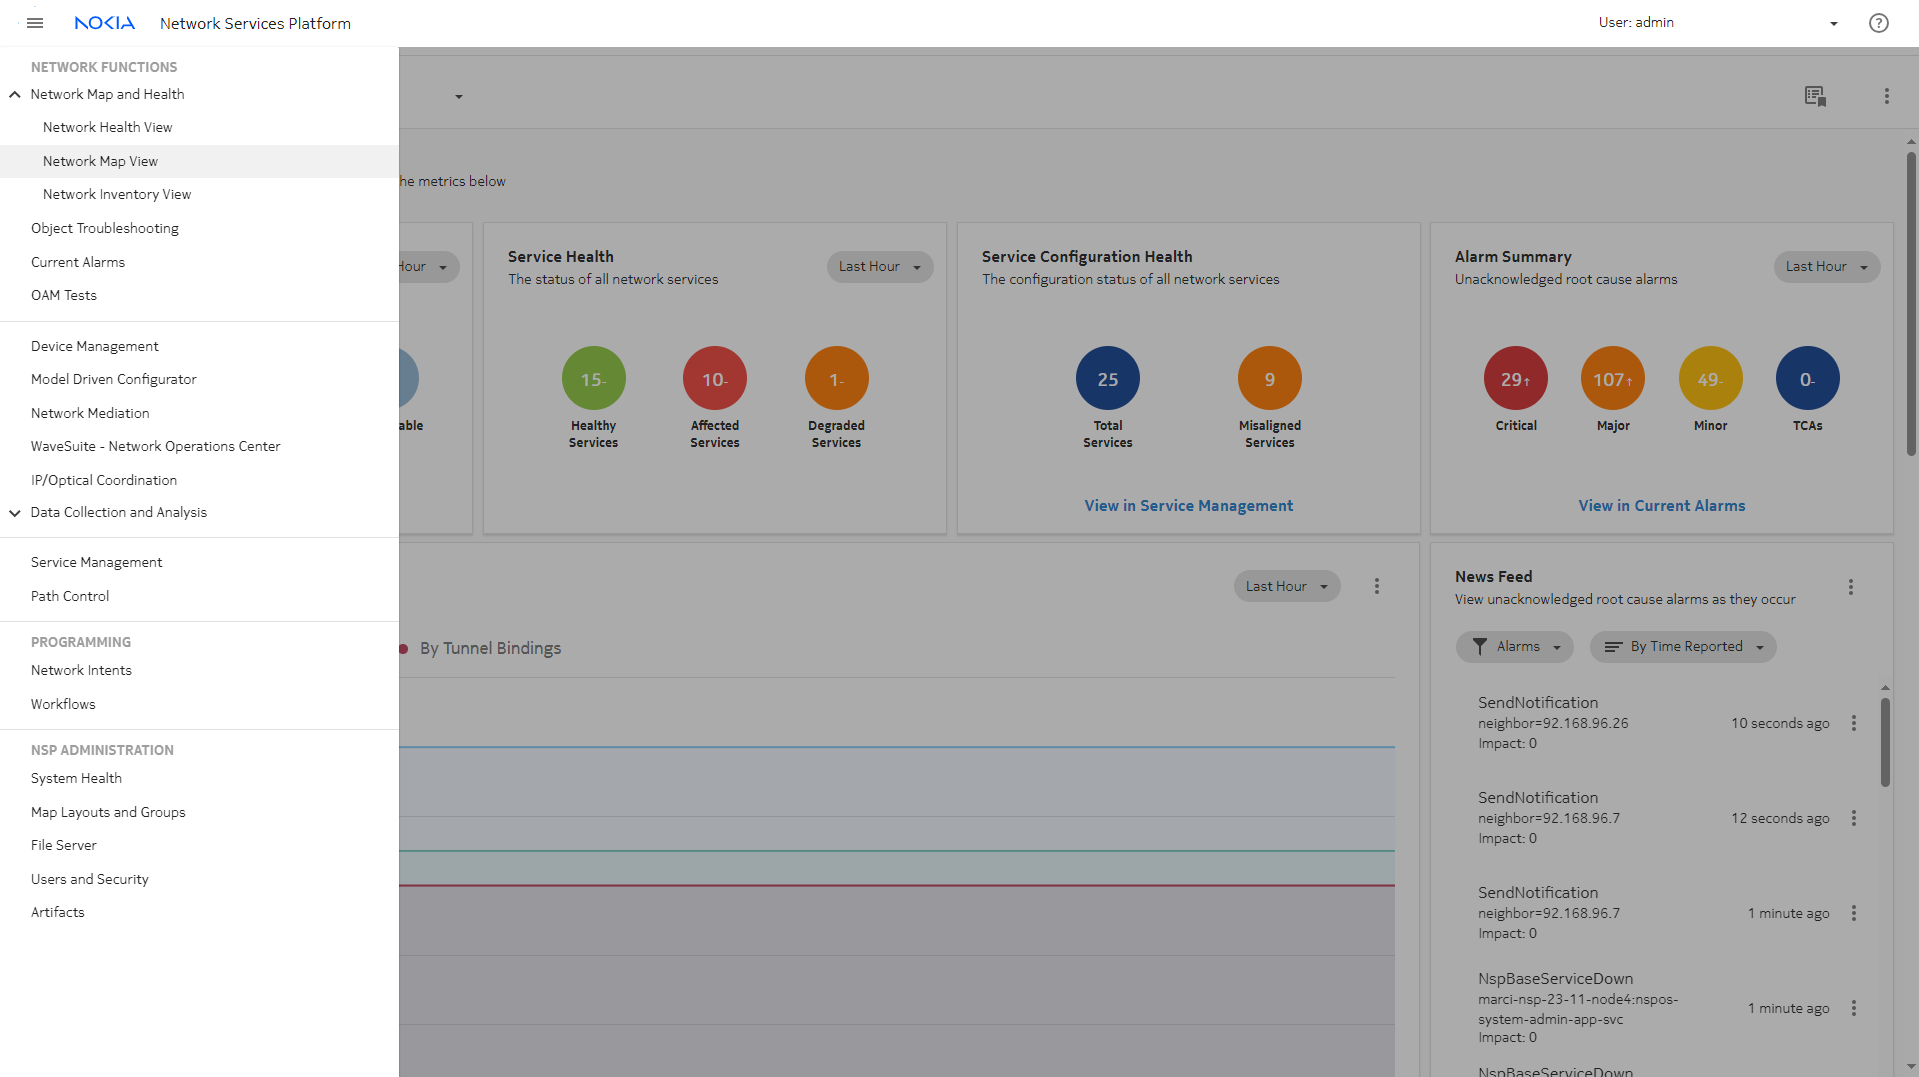
Open Network Map and Health, Network Map View.

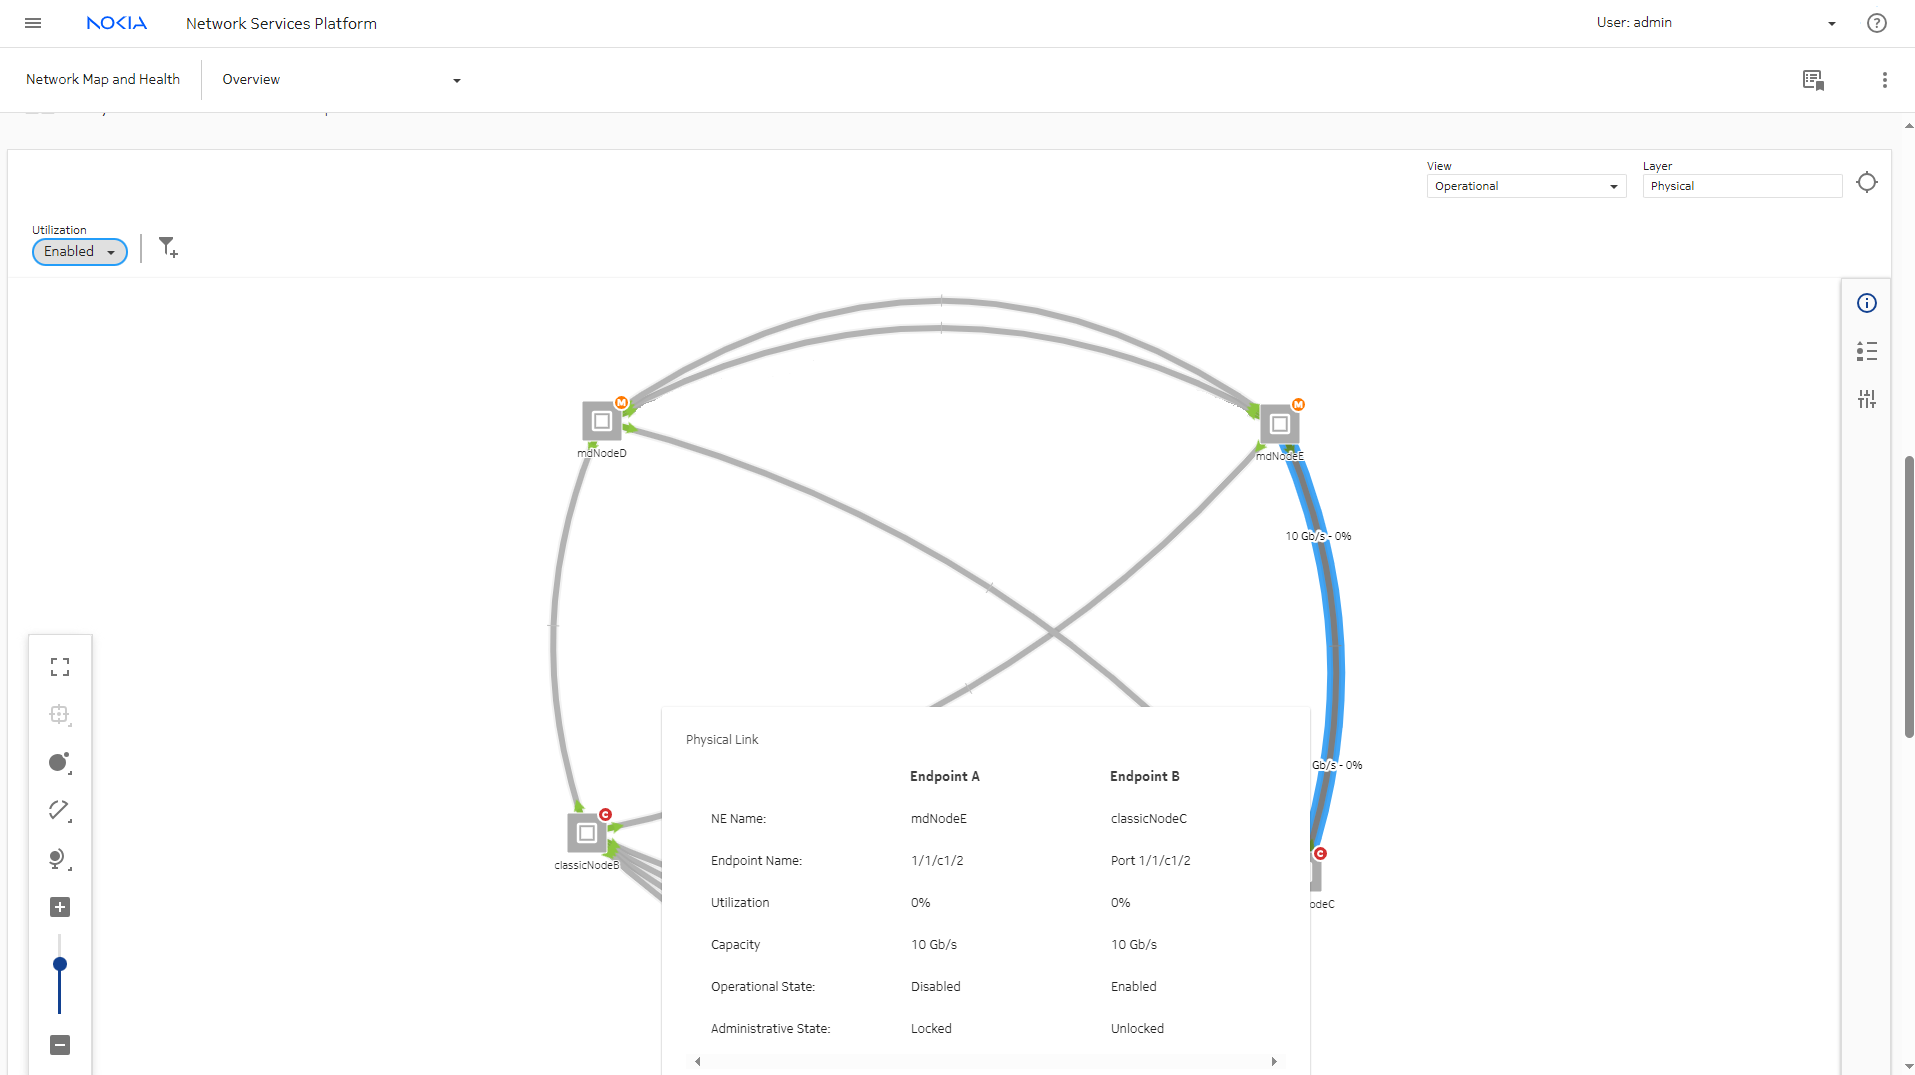
Hover over a problem link to display link details.


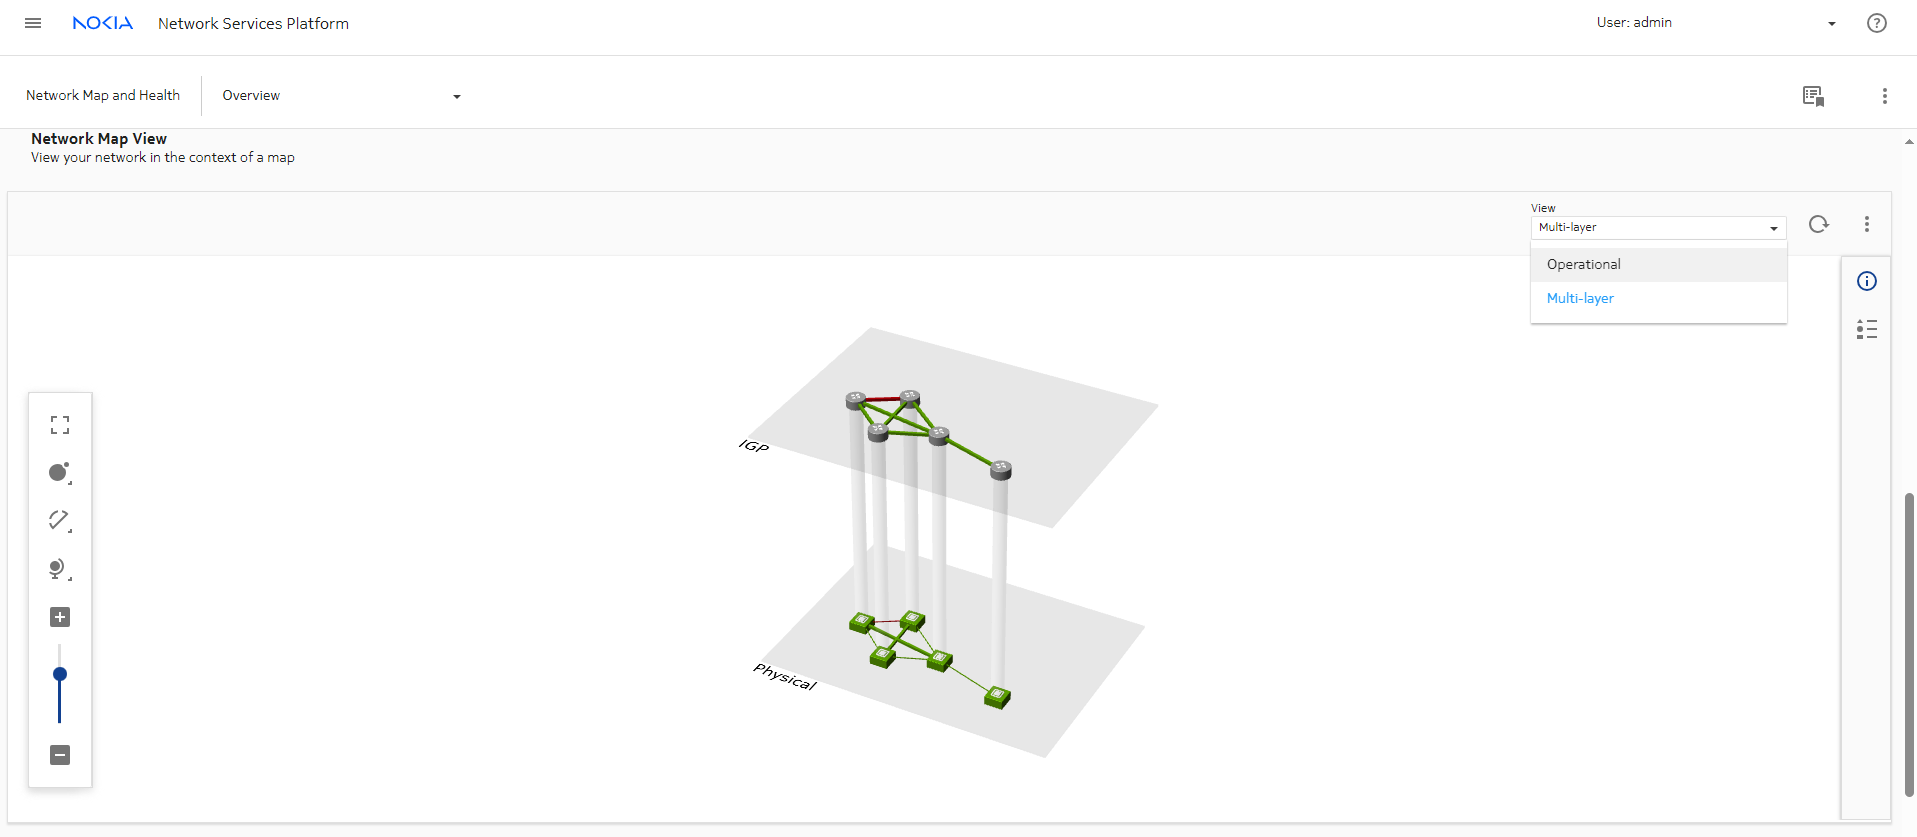
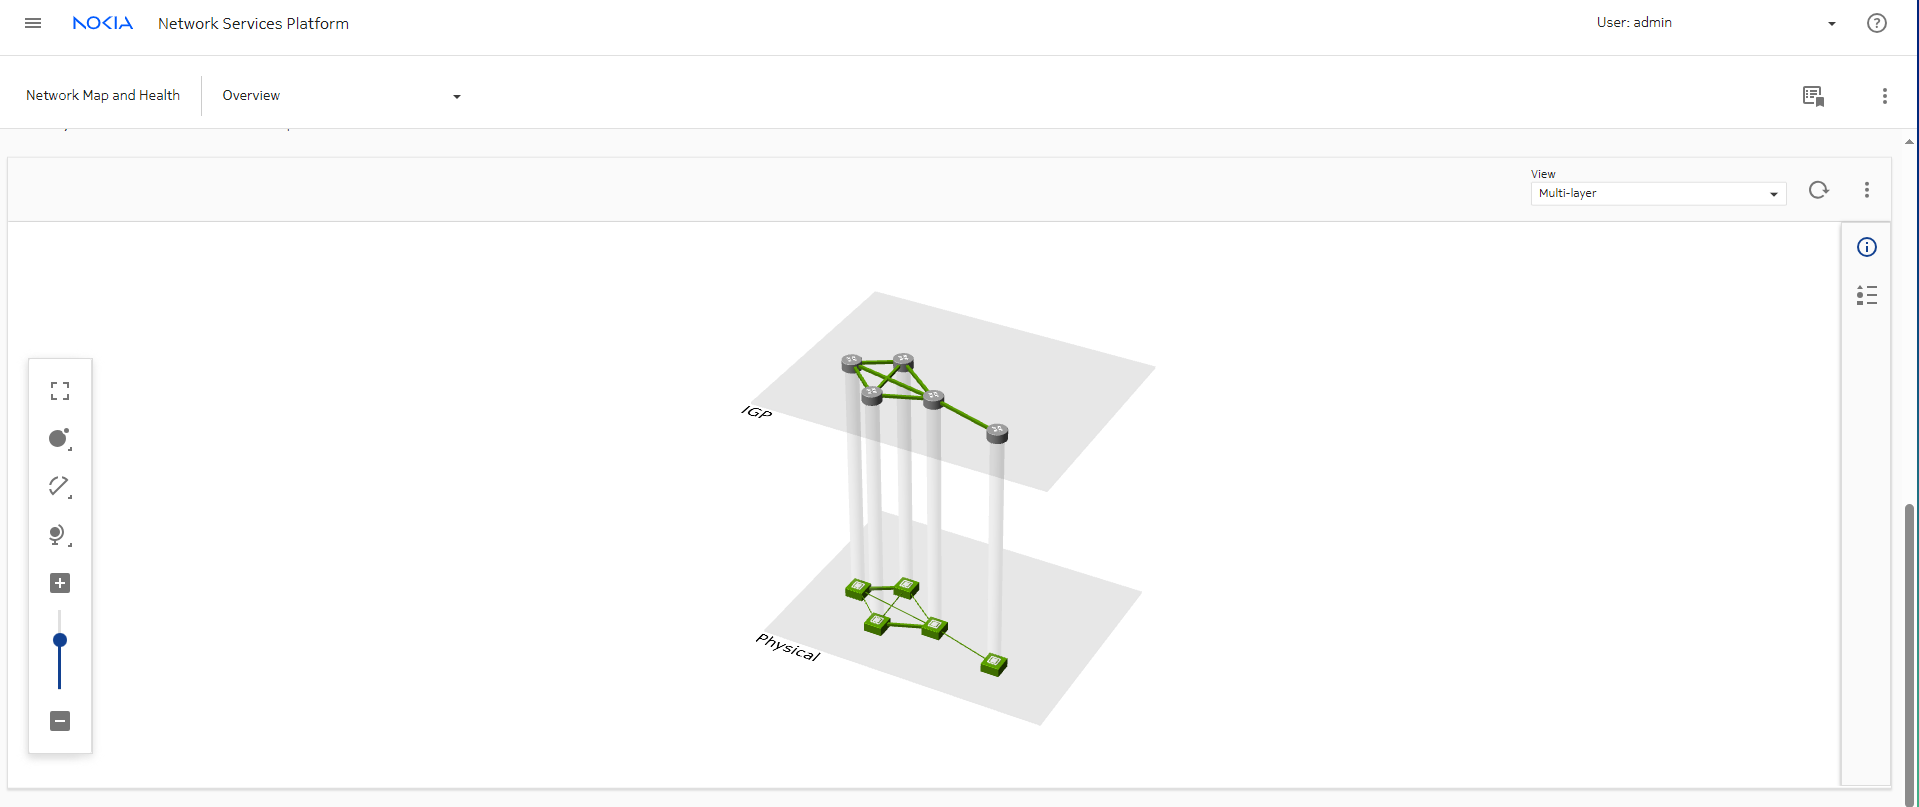
Choose Multi-layer from the View drop-down above the map to show the IGP links in a plane above the physical links.

If there are problems in both layers, the link is displayed in red on both planes.


Choose Operational from the View drop-down to return to the previous view.


We can view utilization data from the Network Map.

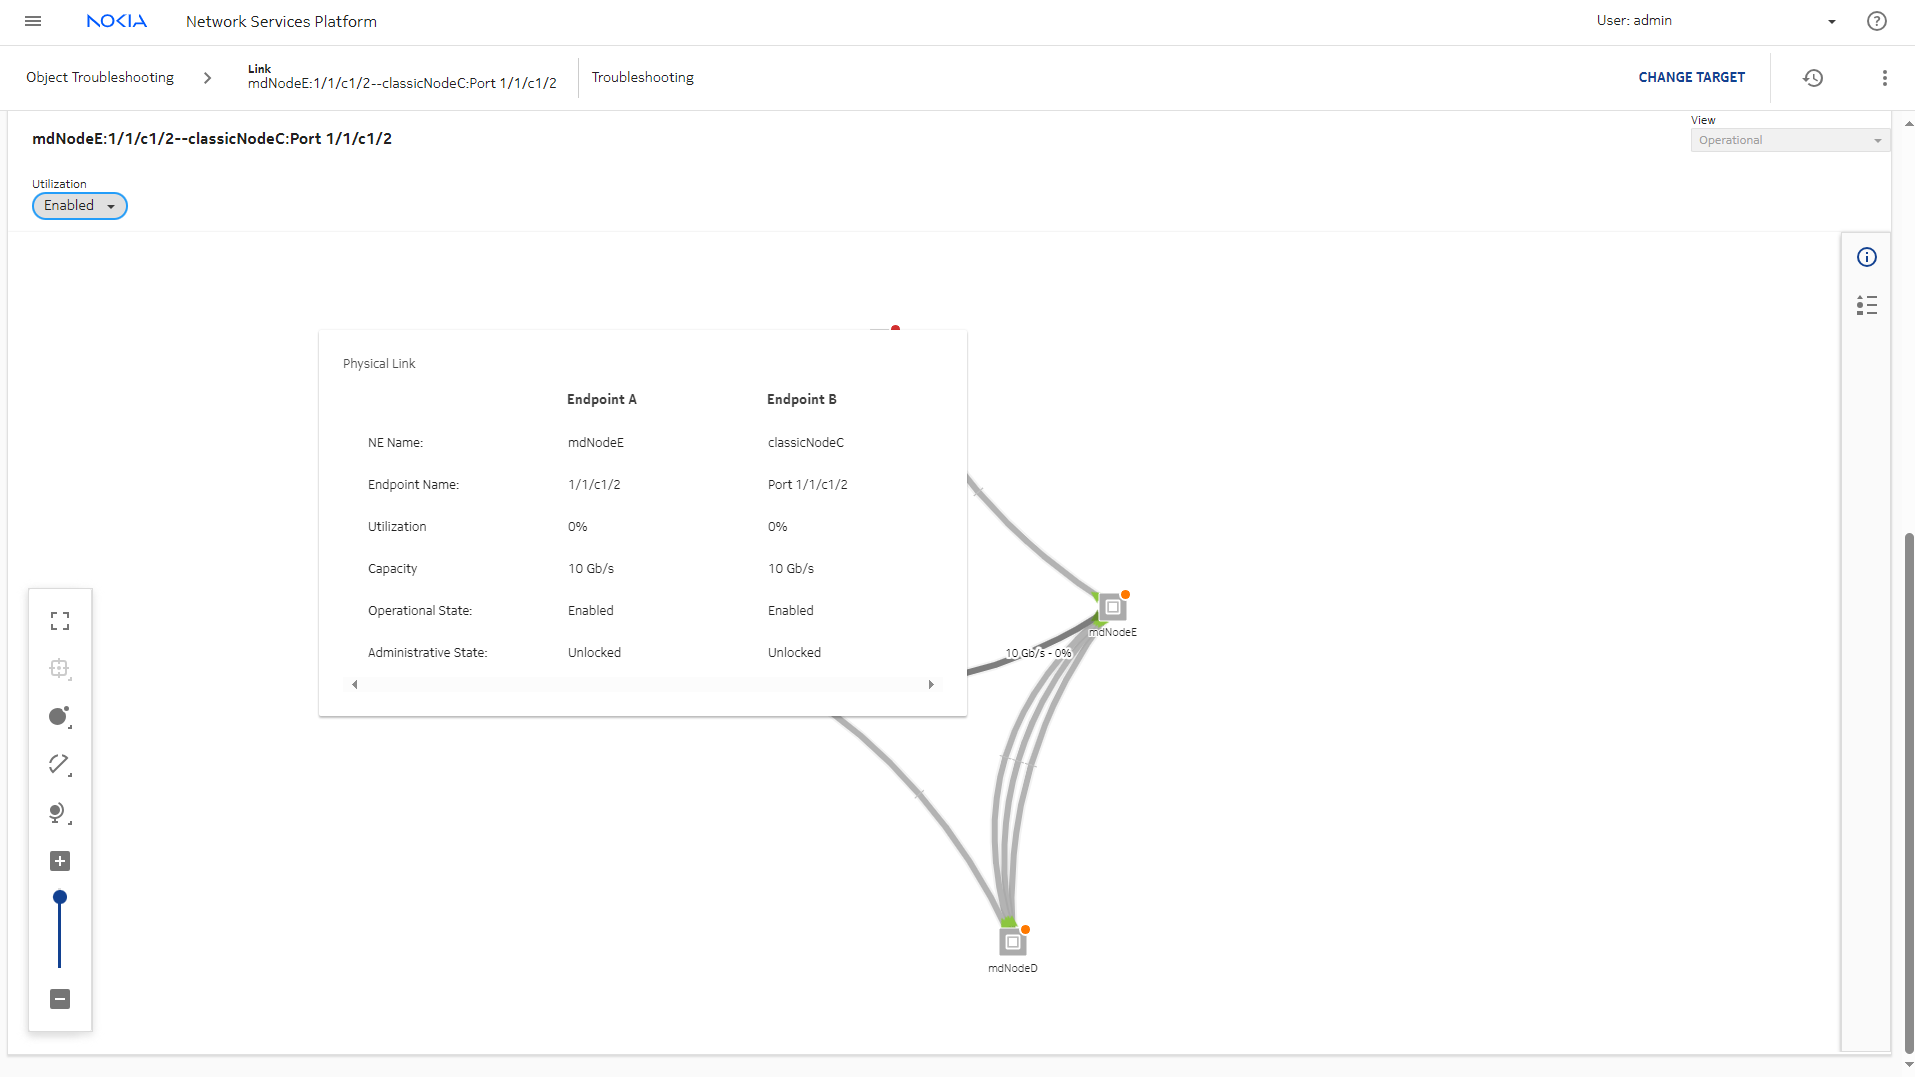
Choose Enabled from the Utilization drop-down. With utilization enabled, hover over the problem link to see utilization information.


We can also open a utilization tracking chart from the link list.

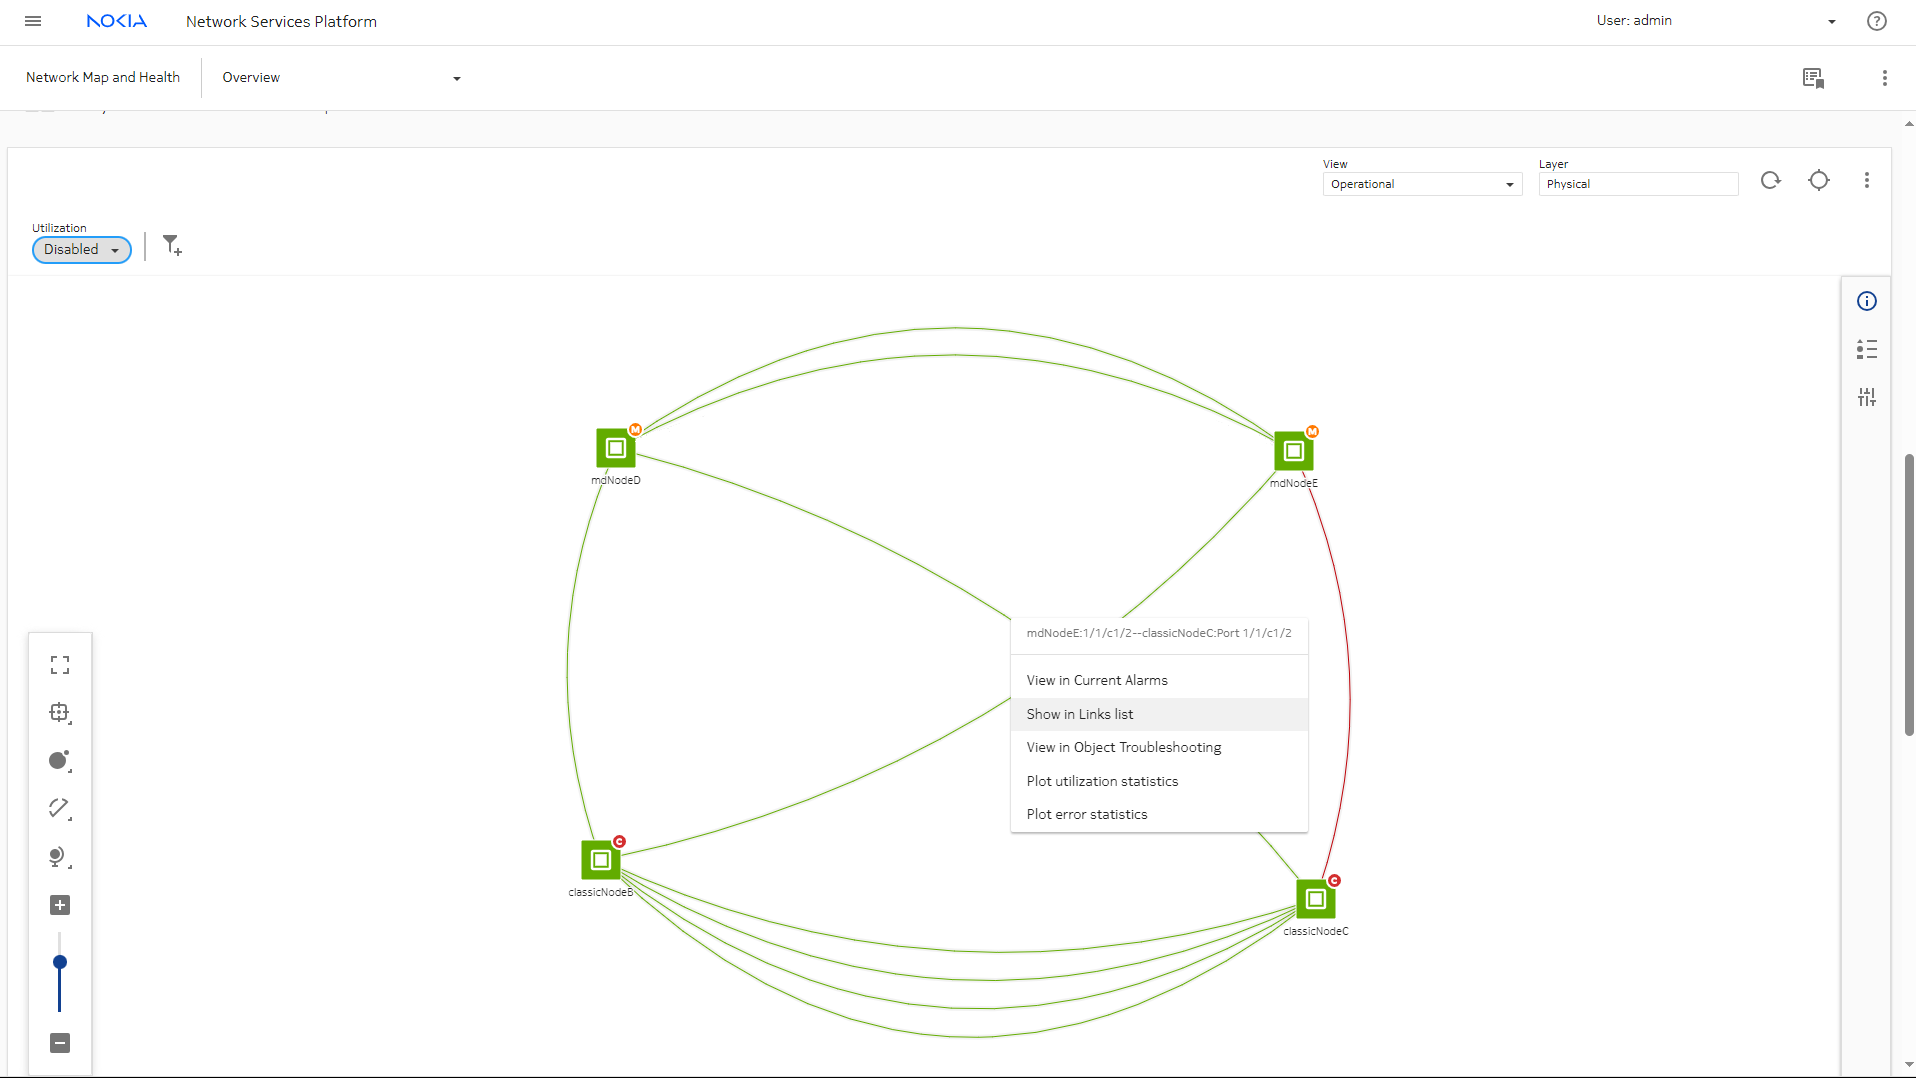
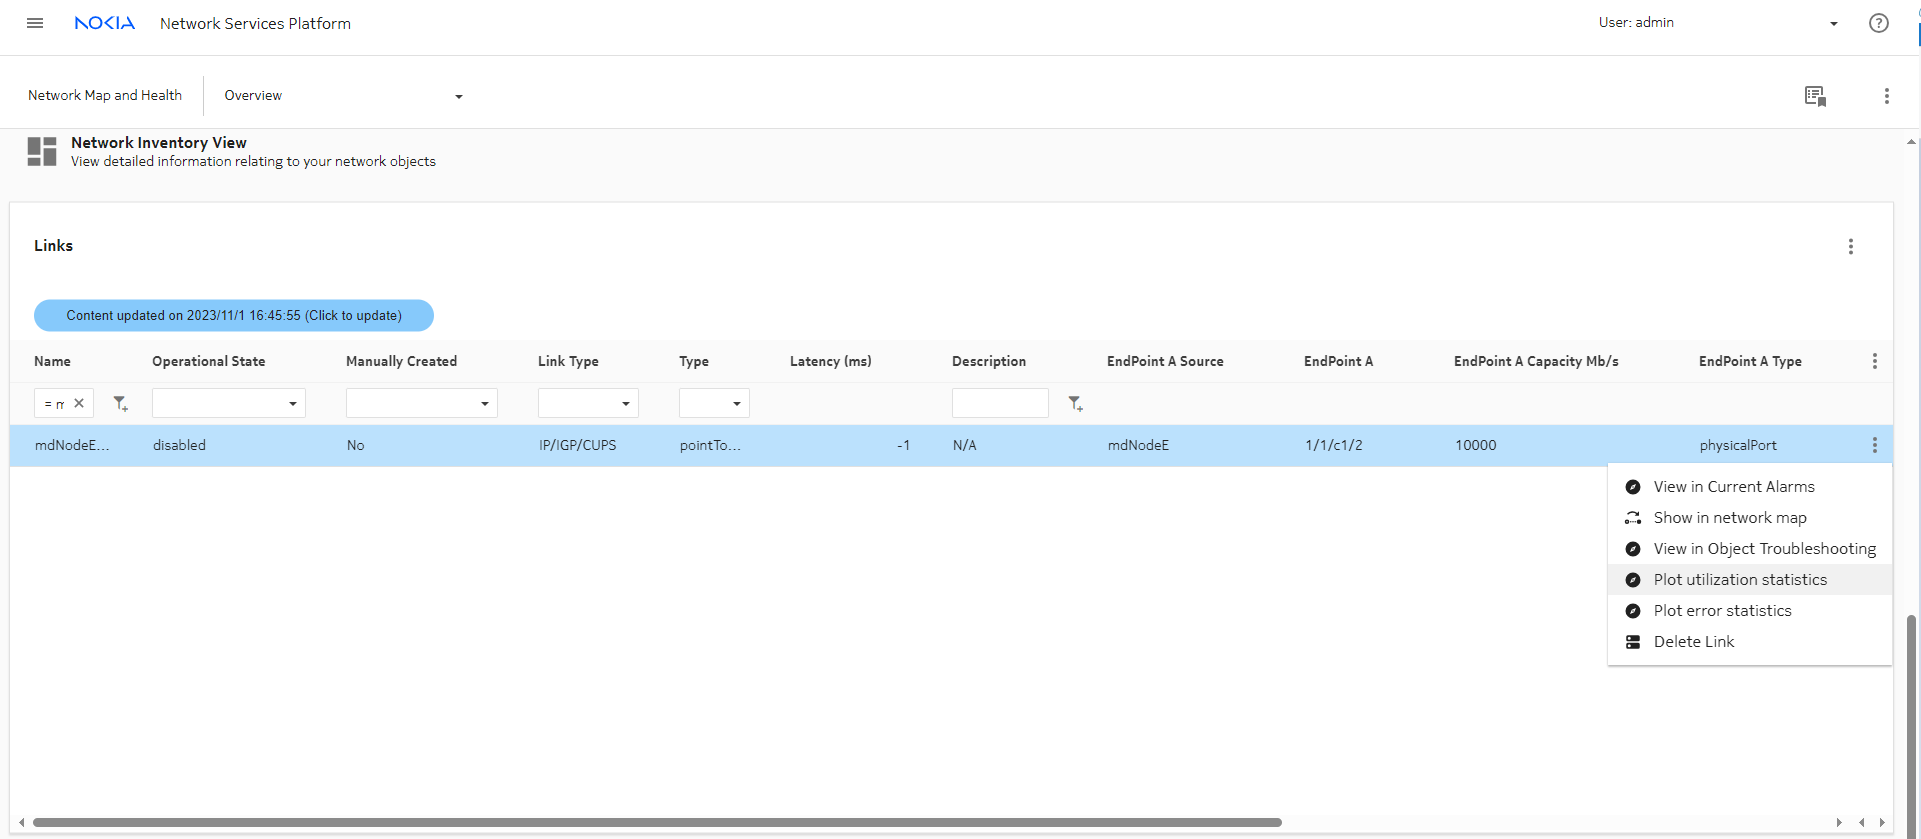
Choose Disabled from the Utilization drop-down, then right-click on the link and choose Show in Links list from the context menu.

The Links dashlet in the Network Map and Health dashboard opens, filtered to the target link.


Click on the link and choose png2.png (Table row actions), Plot utilization statistics.


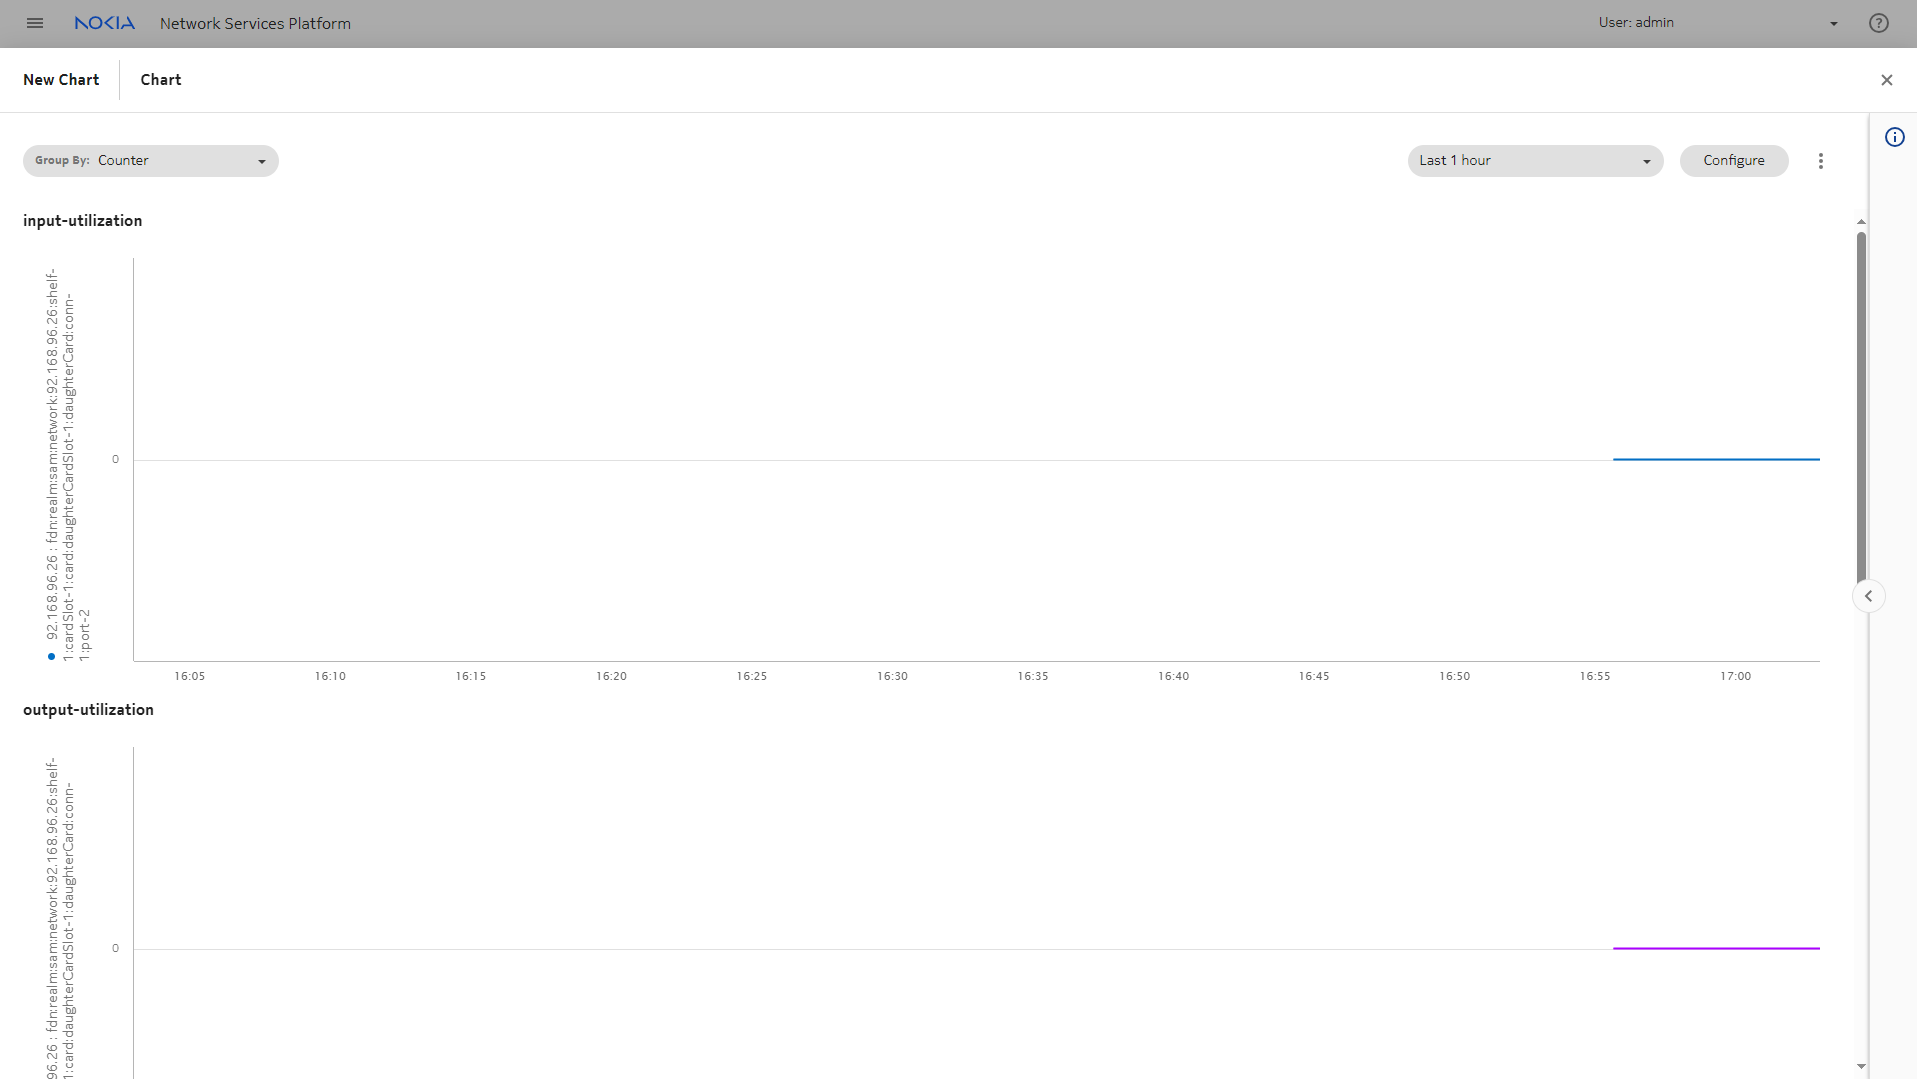
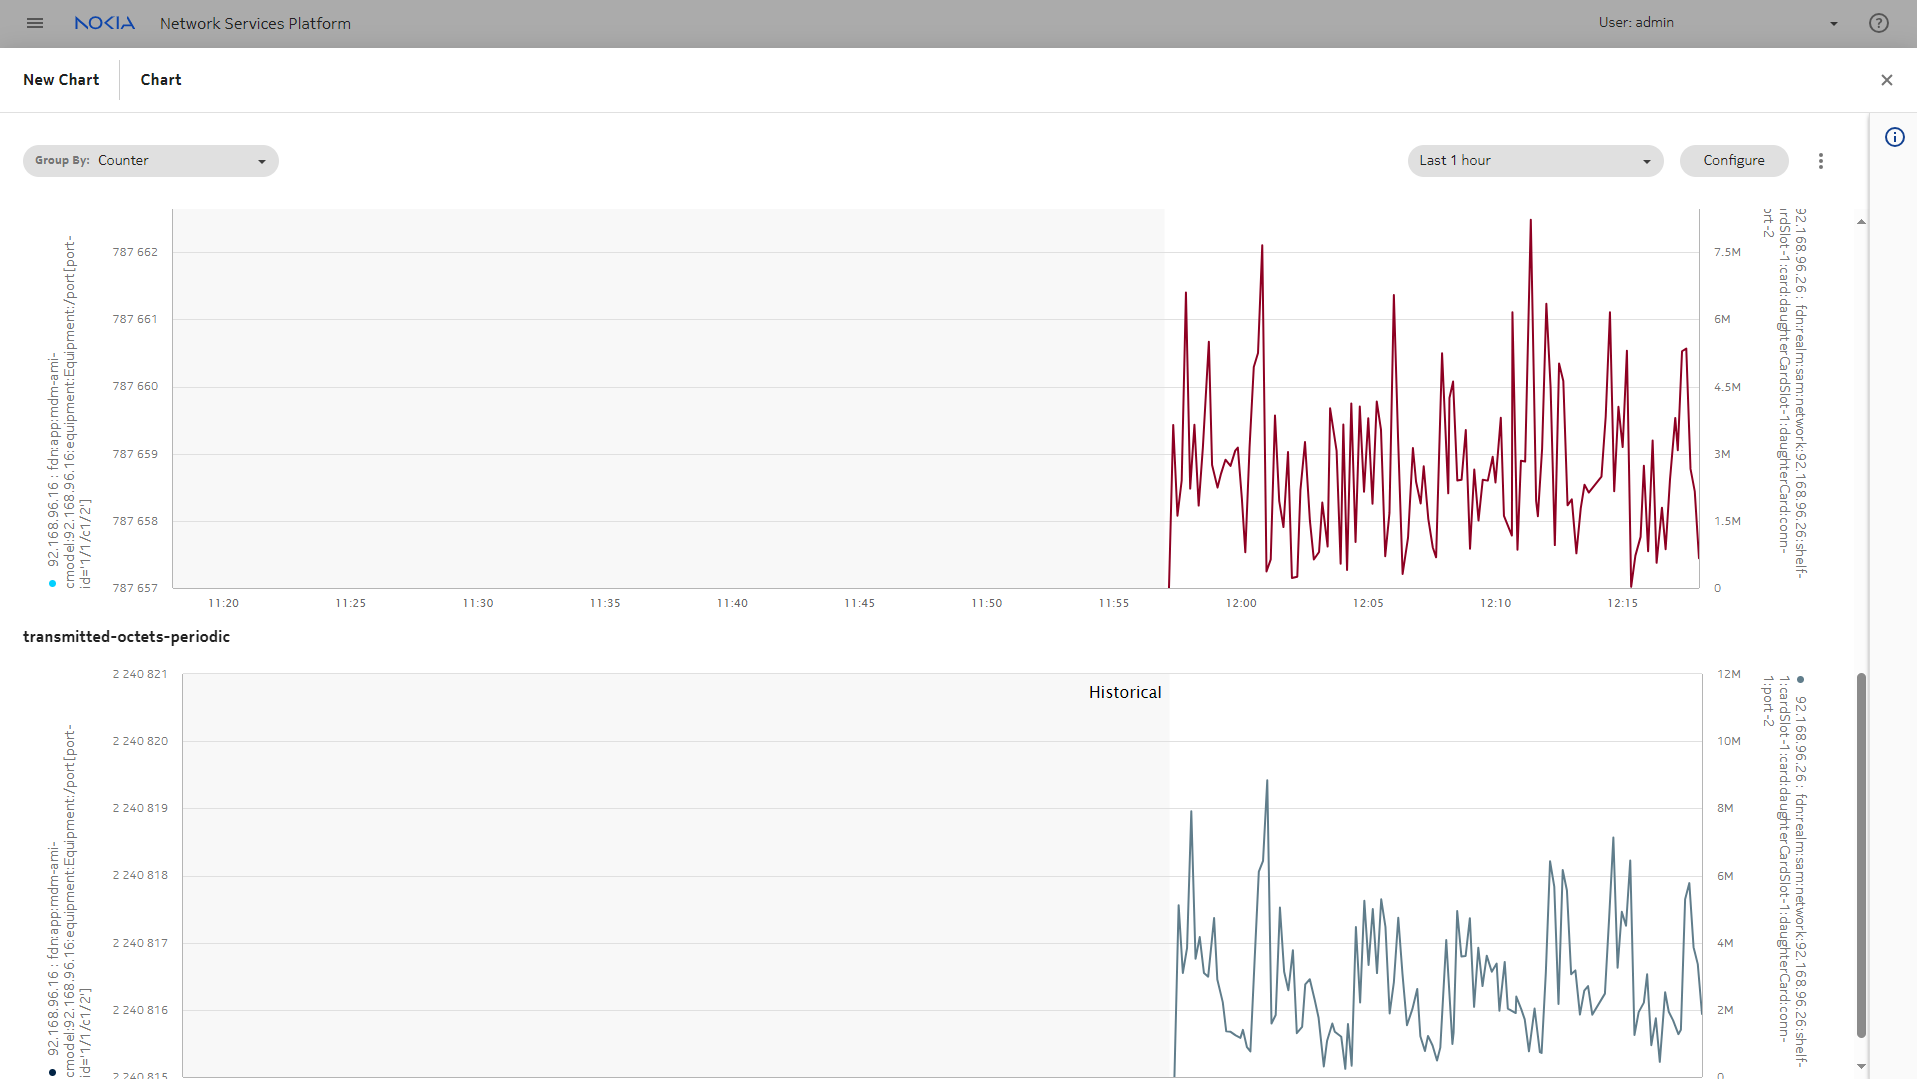
A new tab opens in Data Collection and Analysis Visualizations, showing utilization charts.

You can leave the tab open to check again later.

Investigate from the Object Troubleshooting dashboard
 

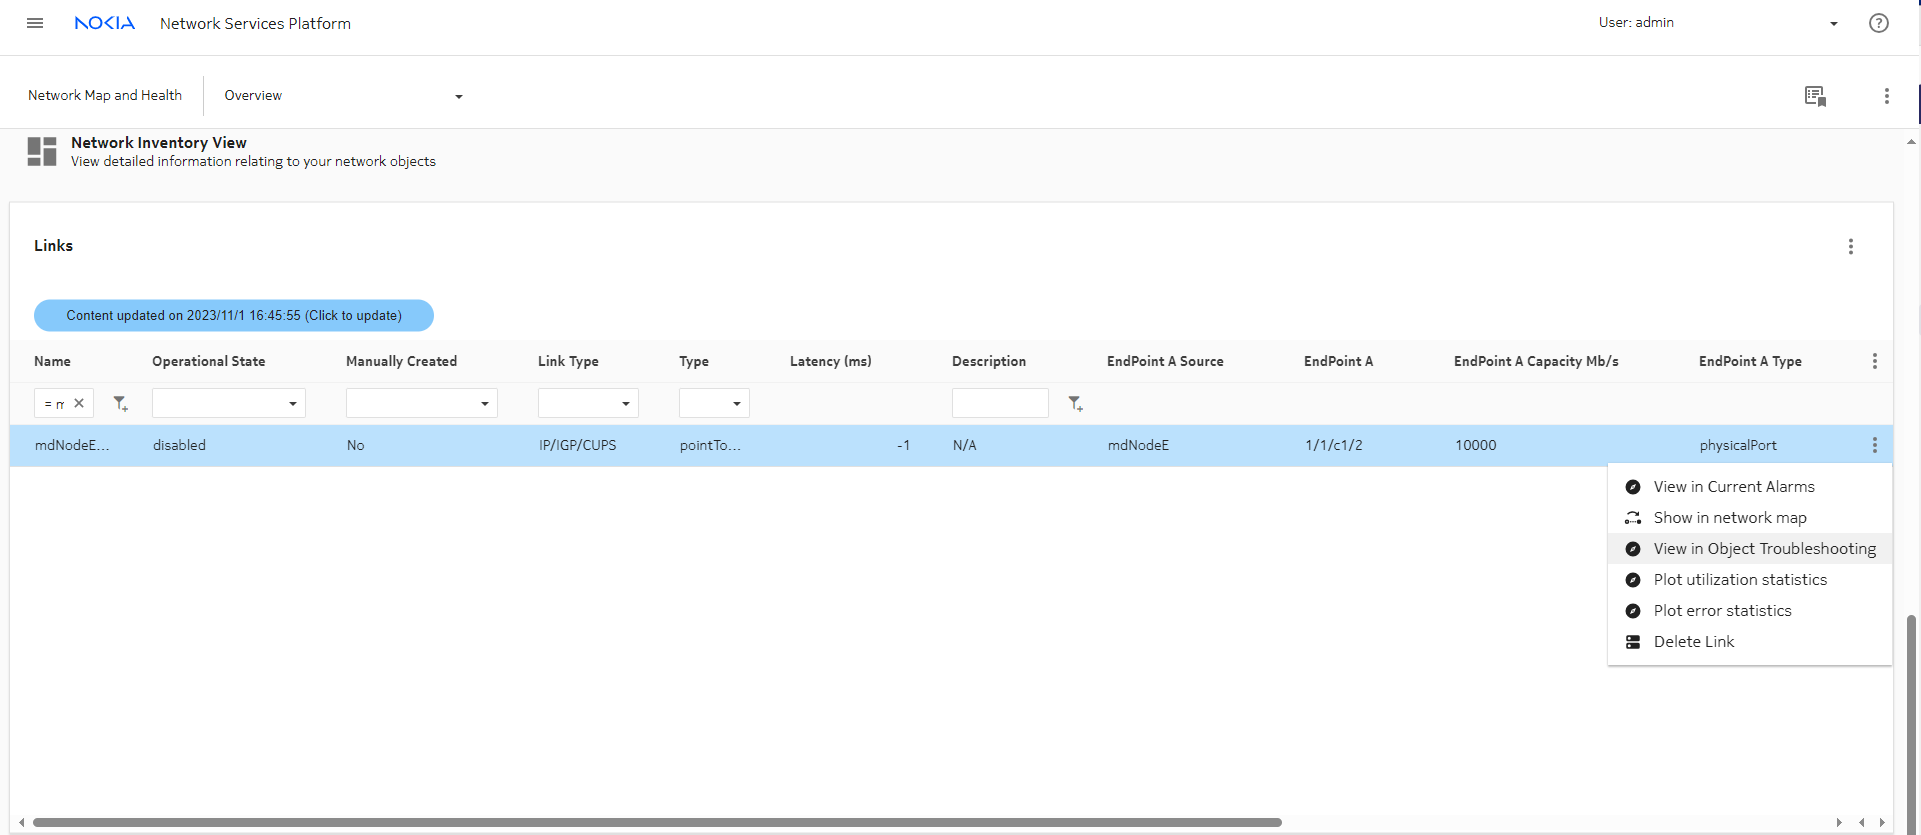
Returning to the Links dashlet, choose png2.png (Table row actions), View in Object Troubleshooting.

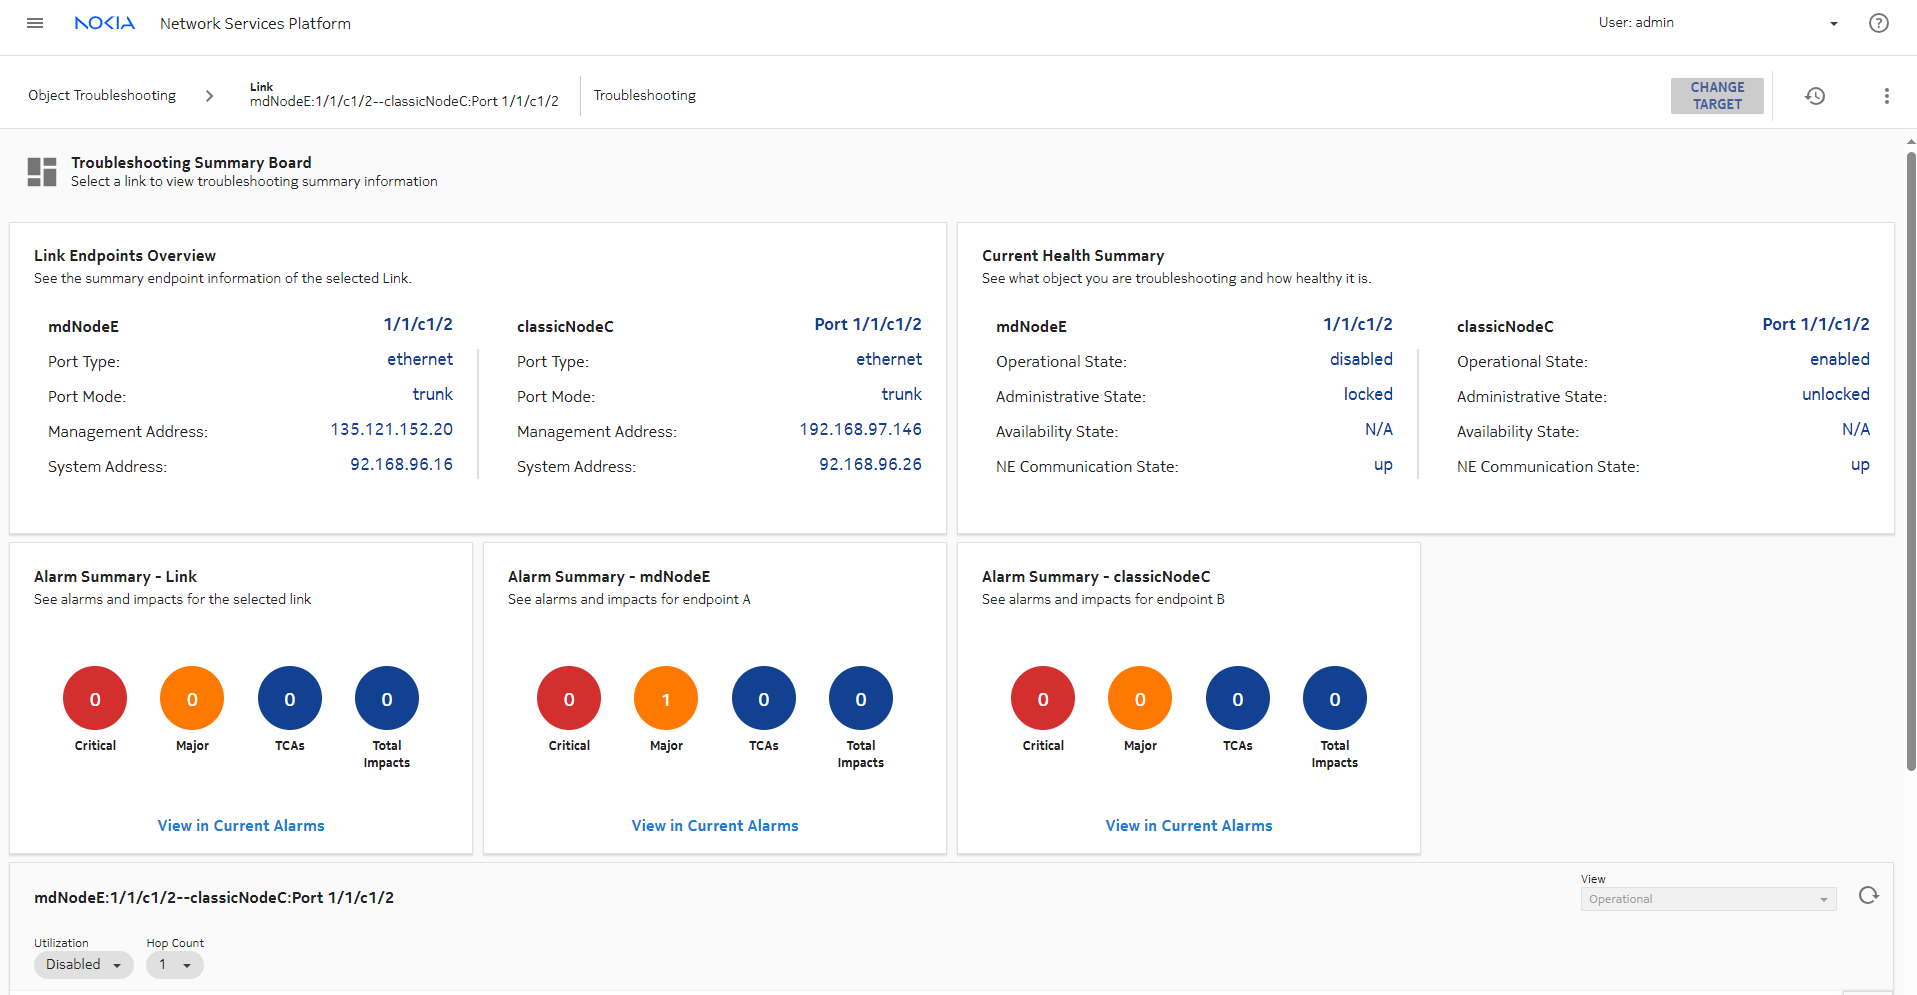
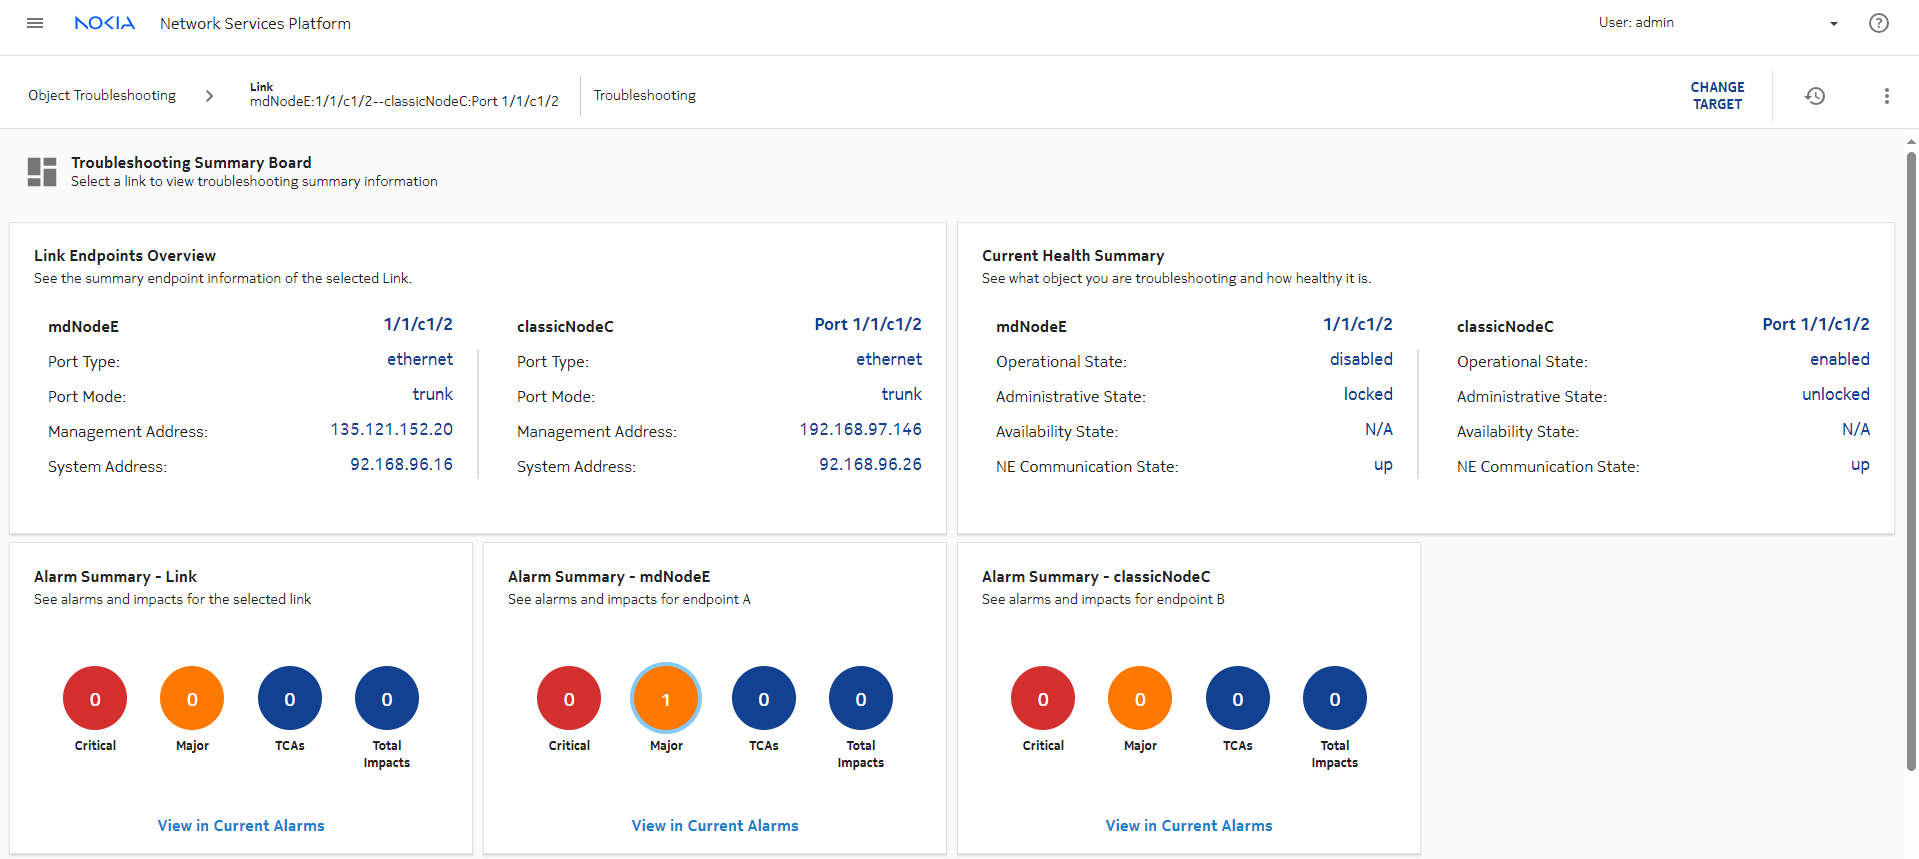
In the Object Troubleshooting dashboard, you can click CHANGE TARGET to view another object.

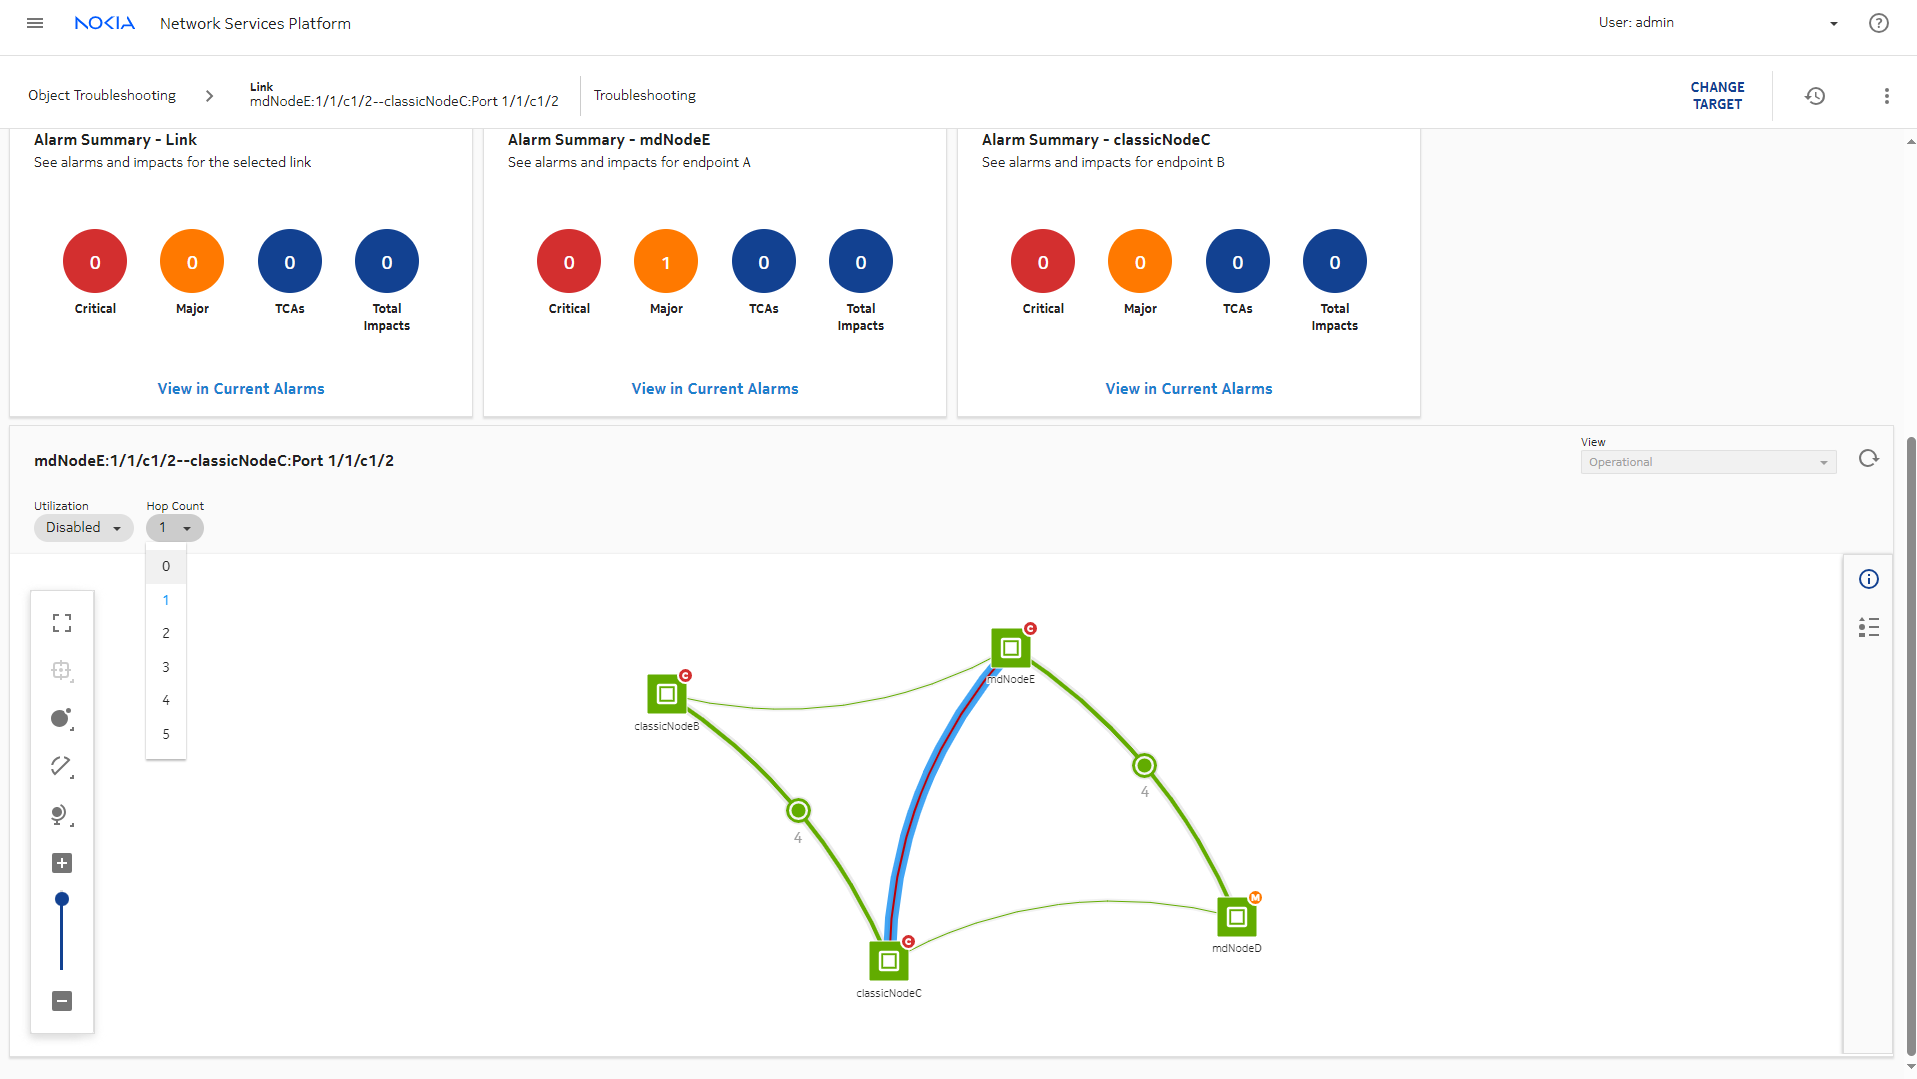
In the Object Troubleshooting dashboard map, we can change the Hop Count to see nodes that are further from the target.

You can selection Utilization to display link utilization statistics on the Troubleshooting map as well.

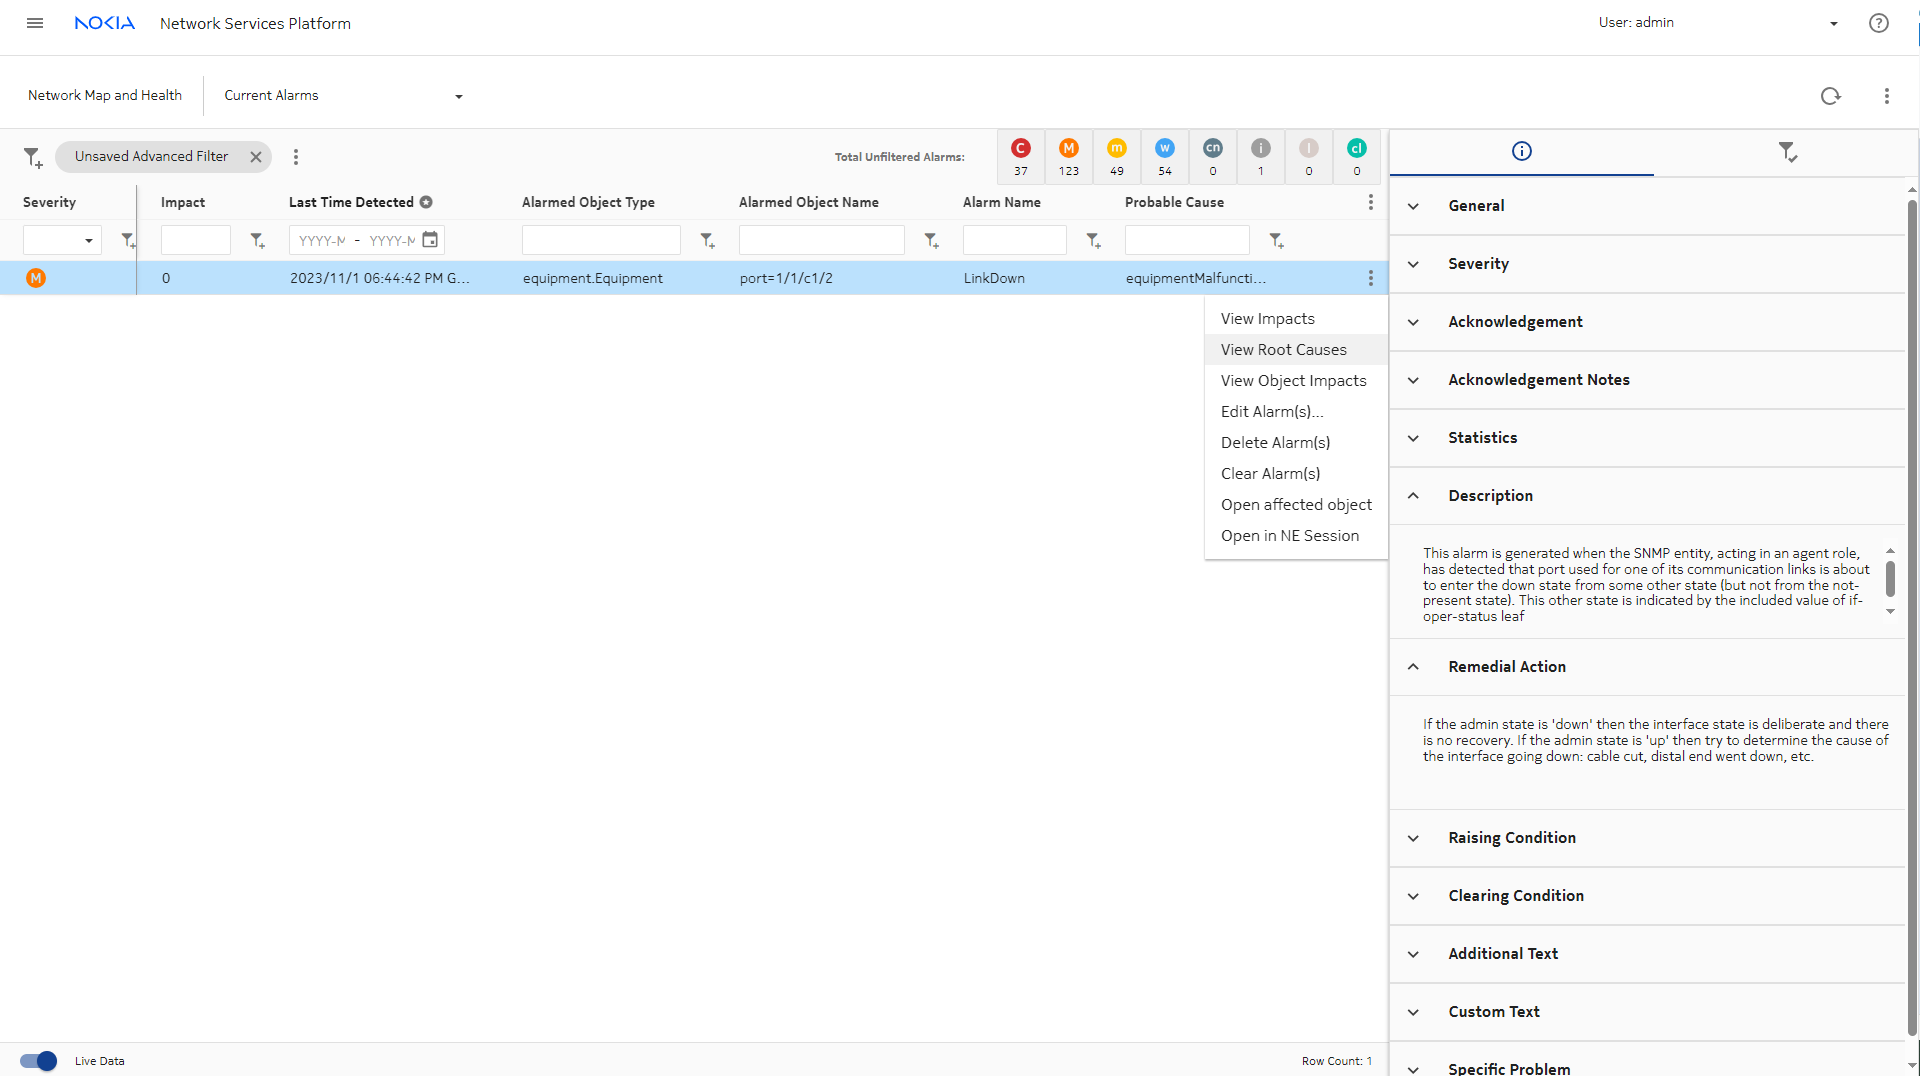
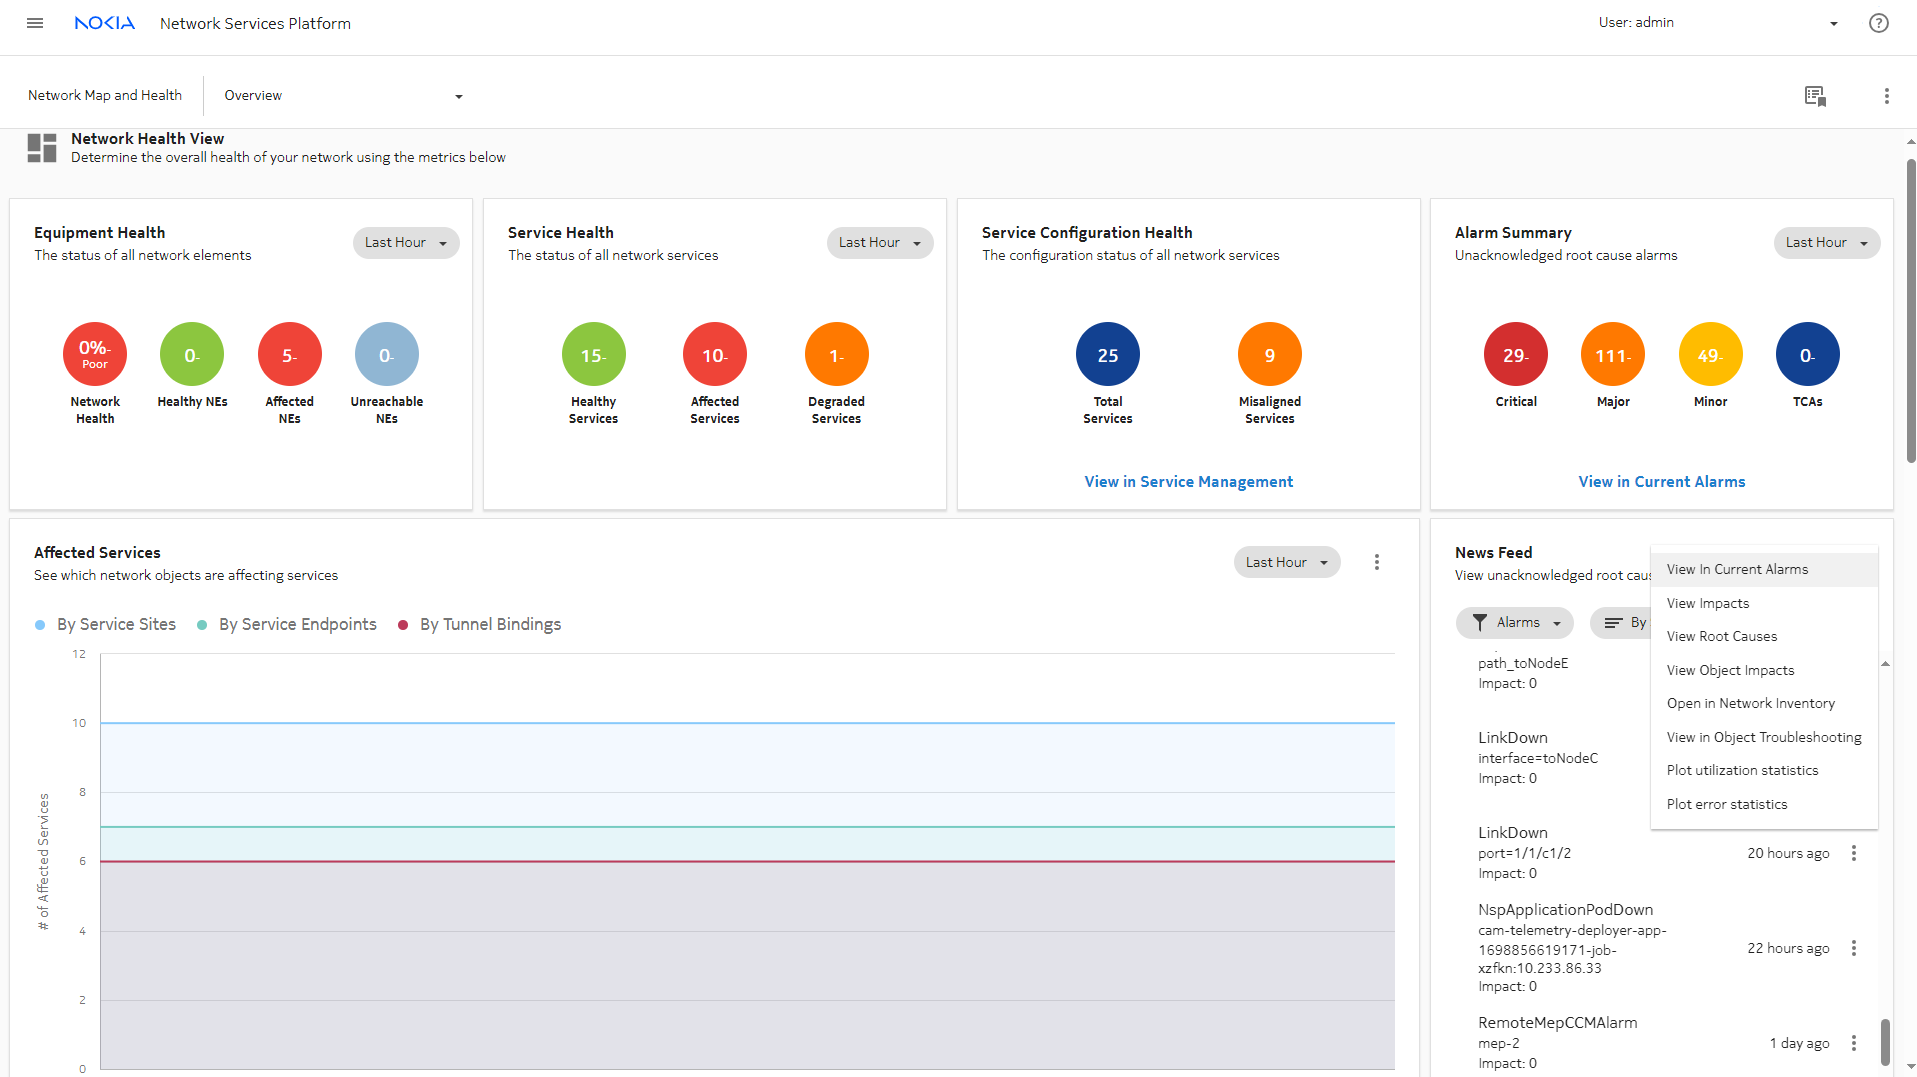
Back in the Object Troubleshooting dashboard, navigate to the Alarm Summary dashlet and click the Major alarm circle to view Current Alarms with a filter for the pertinent alarm.

Click on the alarm, choose png2.png (Table row actions), and, select View Root Causes.

Investigate link alarms from the News Feed

Another option for investigating alarm details is to start from the News Feed. The News Feed provides a live feed of unacknowledged root cause alarms as they occur in real time. Alarm severity and number of impacts are displayed, and cross launch is available depending on the alarm. All alarms can cross launch to Current Alarms.


From the News Feed in the Network Map and Health dashboard, select the alarm and choose View in Current Alarms from the More menu.

Current Alarms cross launches, with the alarm selected.


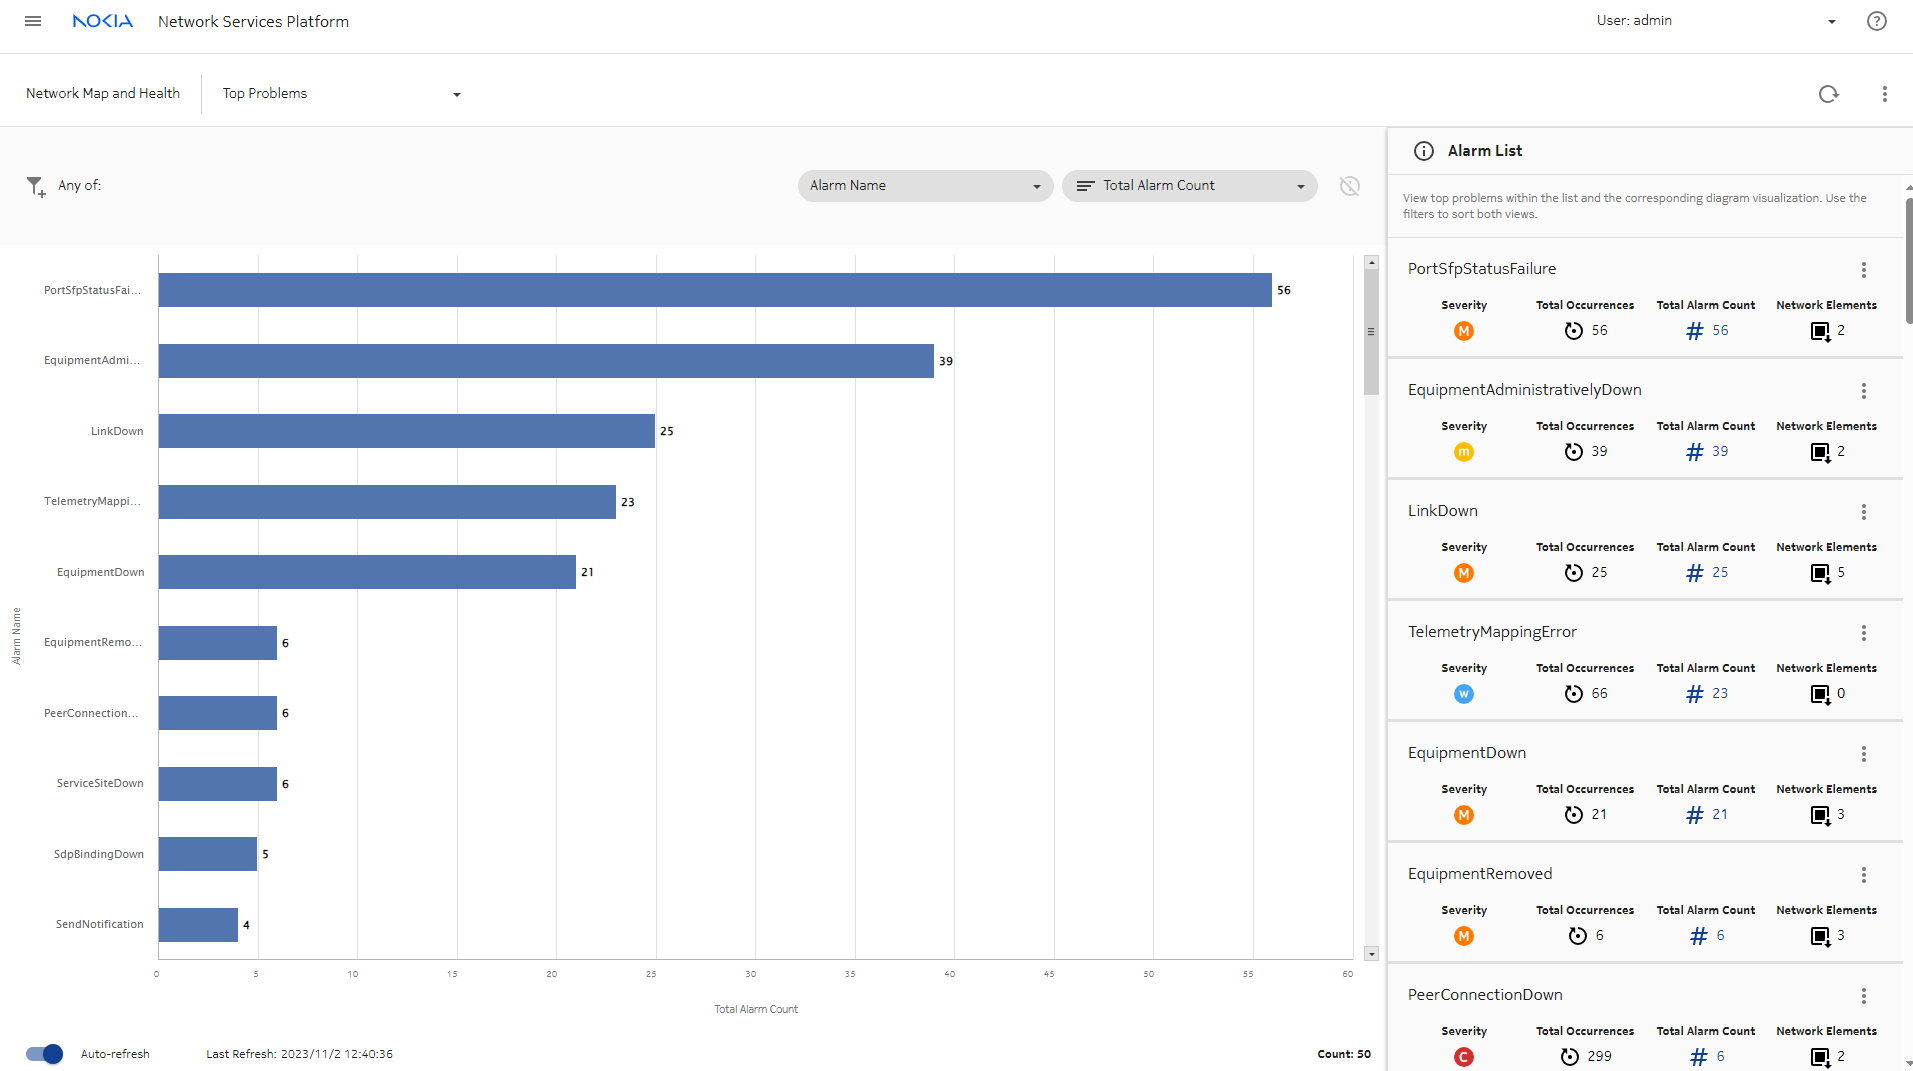
From Current Alarms, you can view the NE in the Unhealthy NEs tab to see what correlated alarms may be present on the endpoint NEs, or check Top Problems to see what other issues the network is experiencing. Here we see that Link Down is currently the third most common problem.

View port details
 

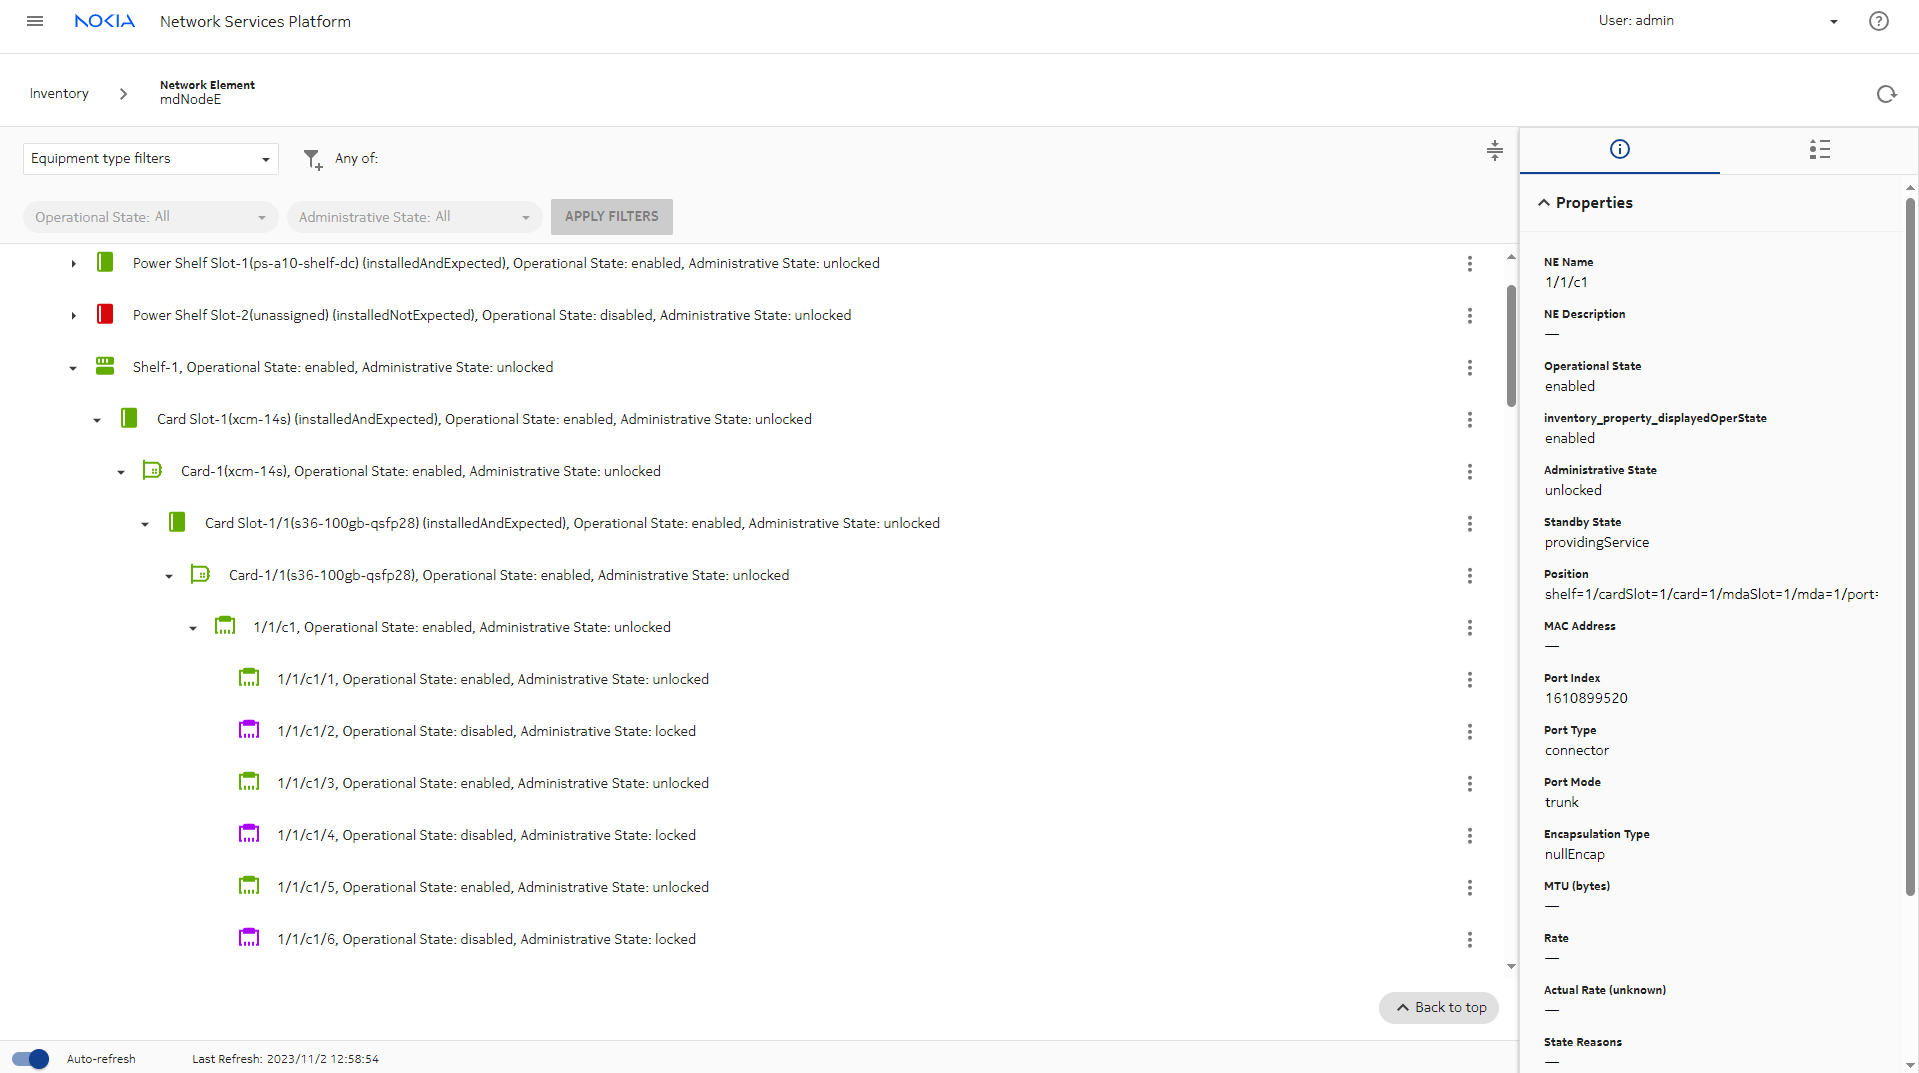
Returning to the Object Troubleshooting dashboard, click on one of the ports to cross launch Network Inventory to look at the status of the endpoint ports.

Evaluate the NE configuration
 

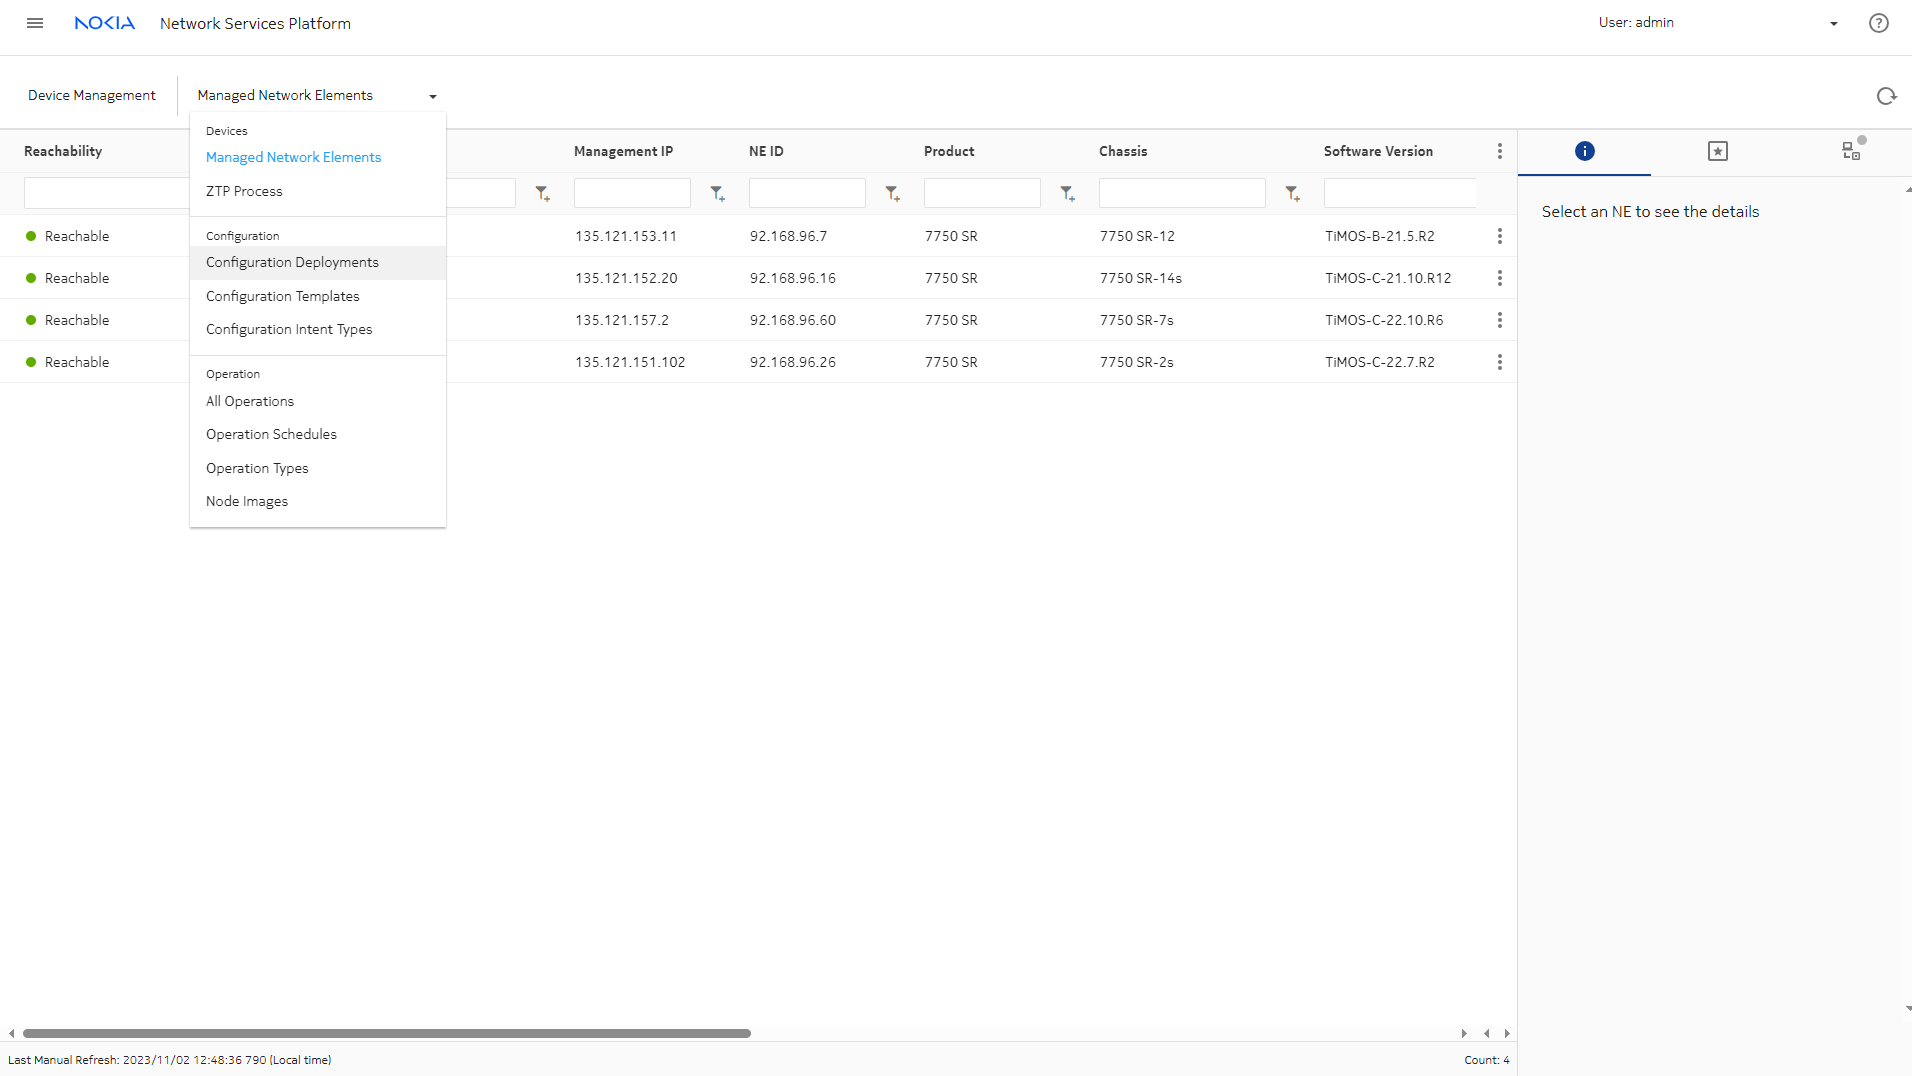
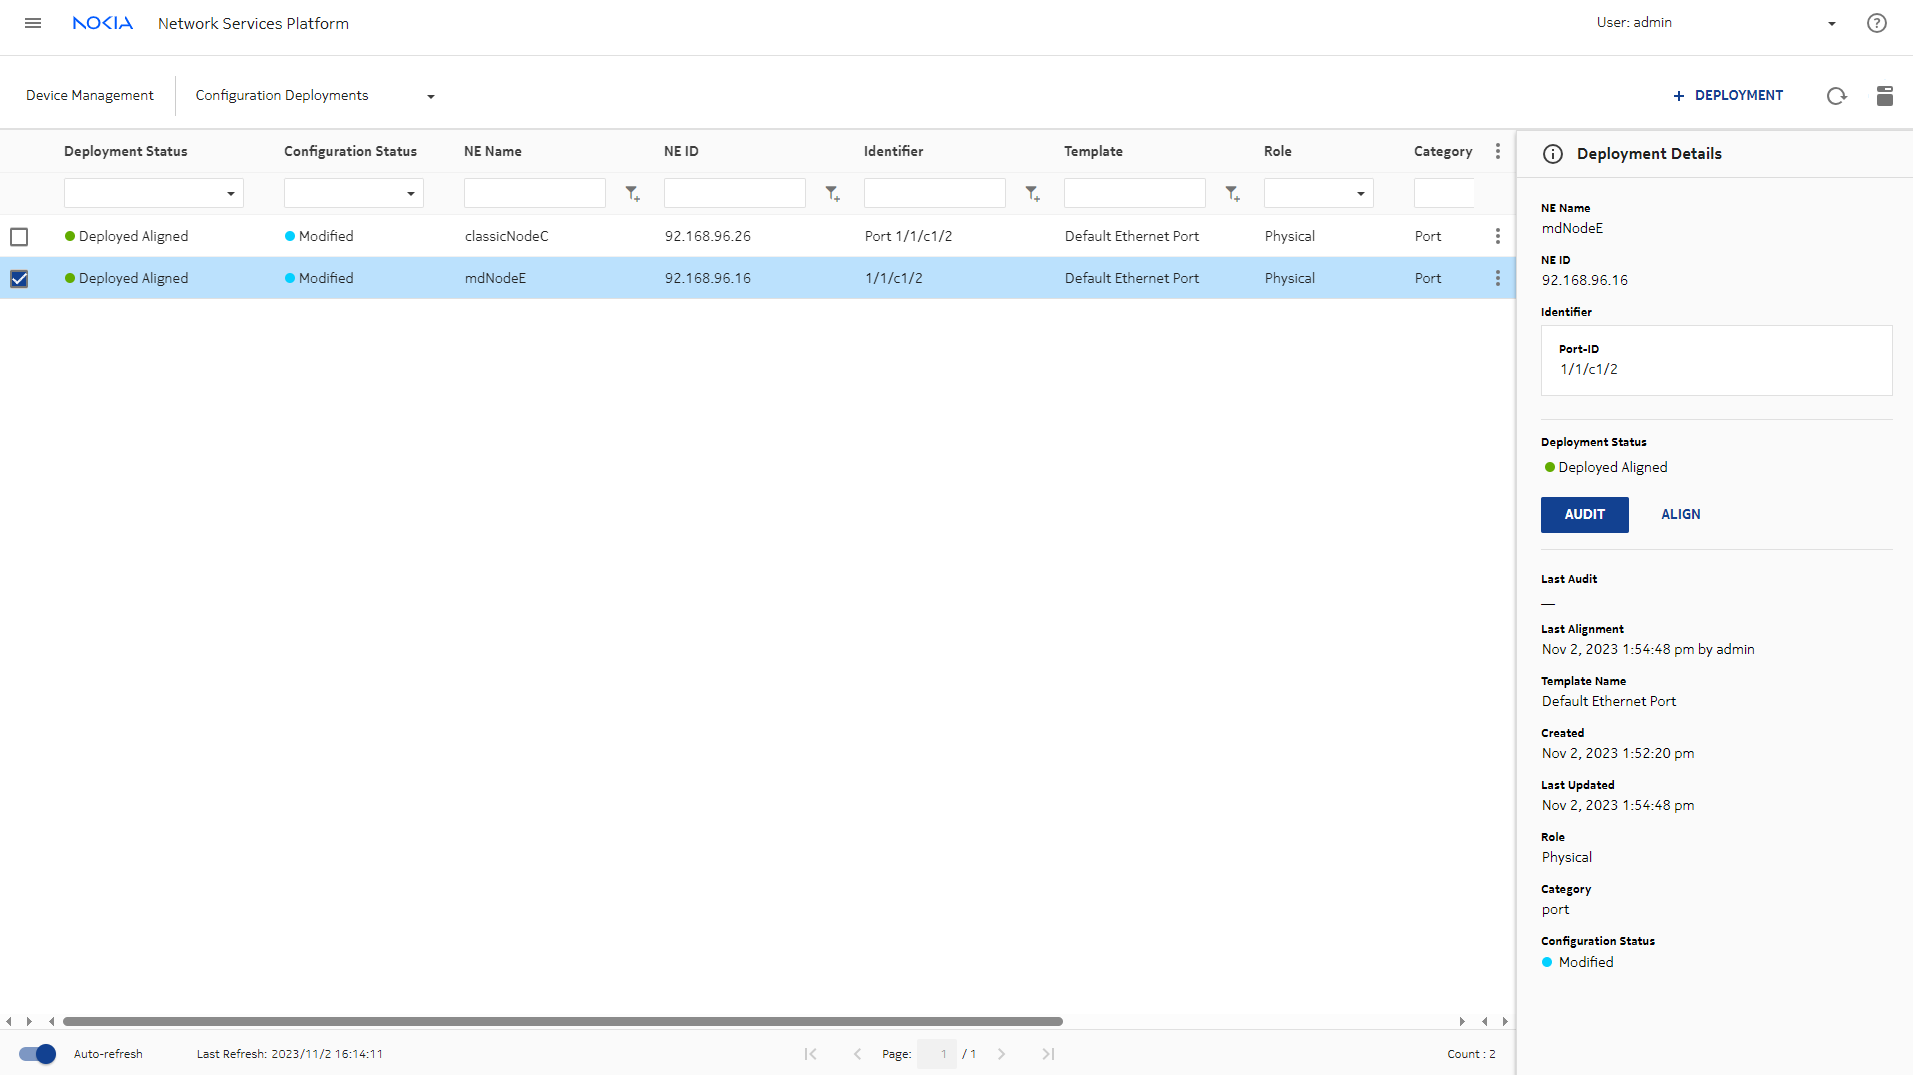
In Device Management, select Configuration Deployments to check the state of the link endpoint port deployments.

If required, filter the Identifier column with the port number to display the deployments that configured the ports in the link. The deployment status column shows the status from the last audit operation performed.


For each port, click AUDIT in the Deployment Details panel to compare the NSP configuration against the NE configuration.


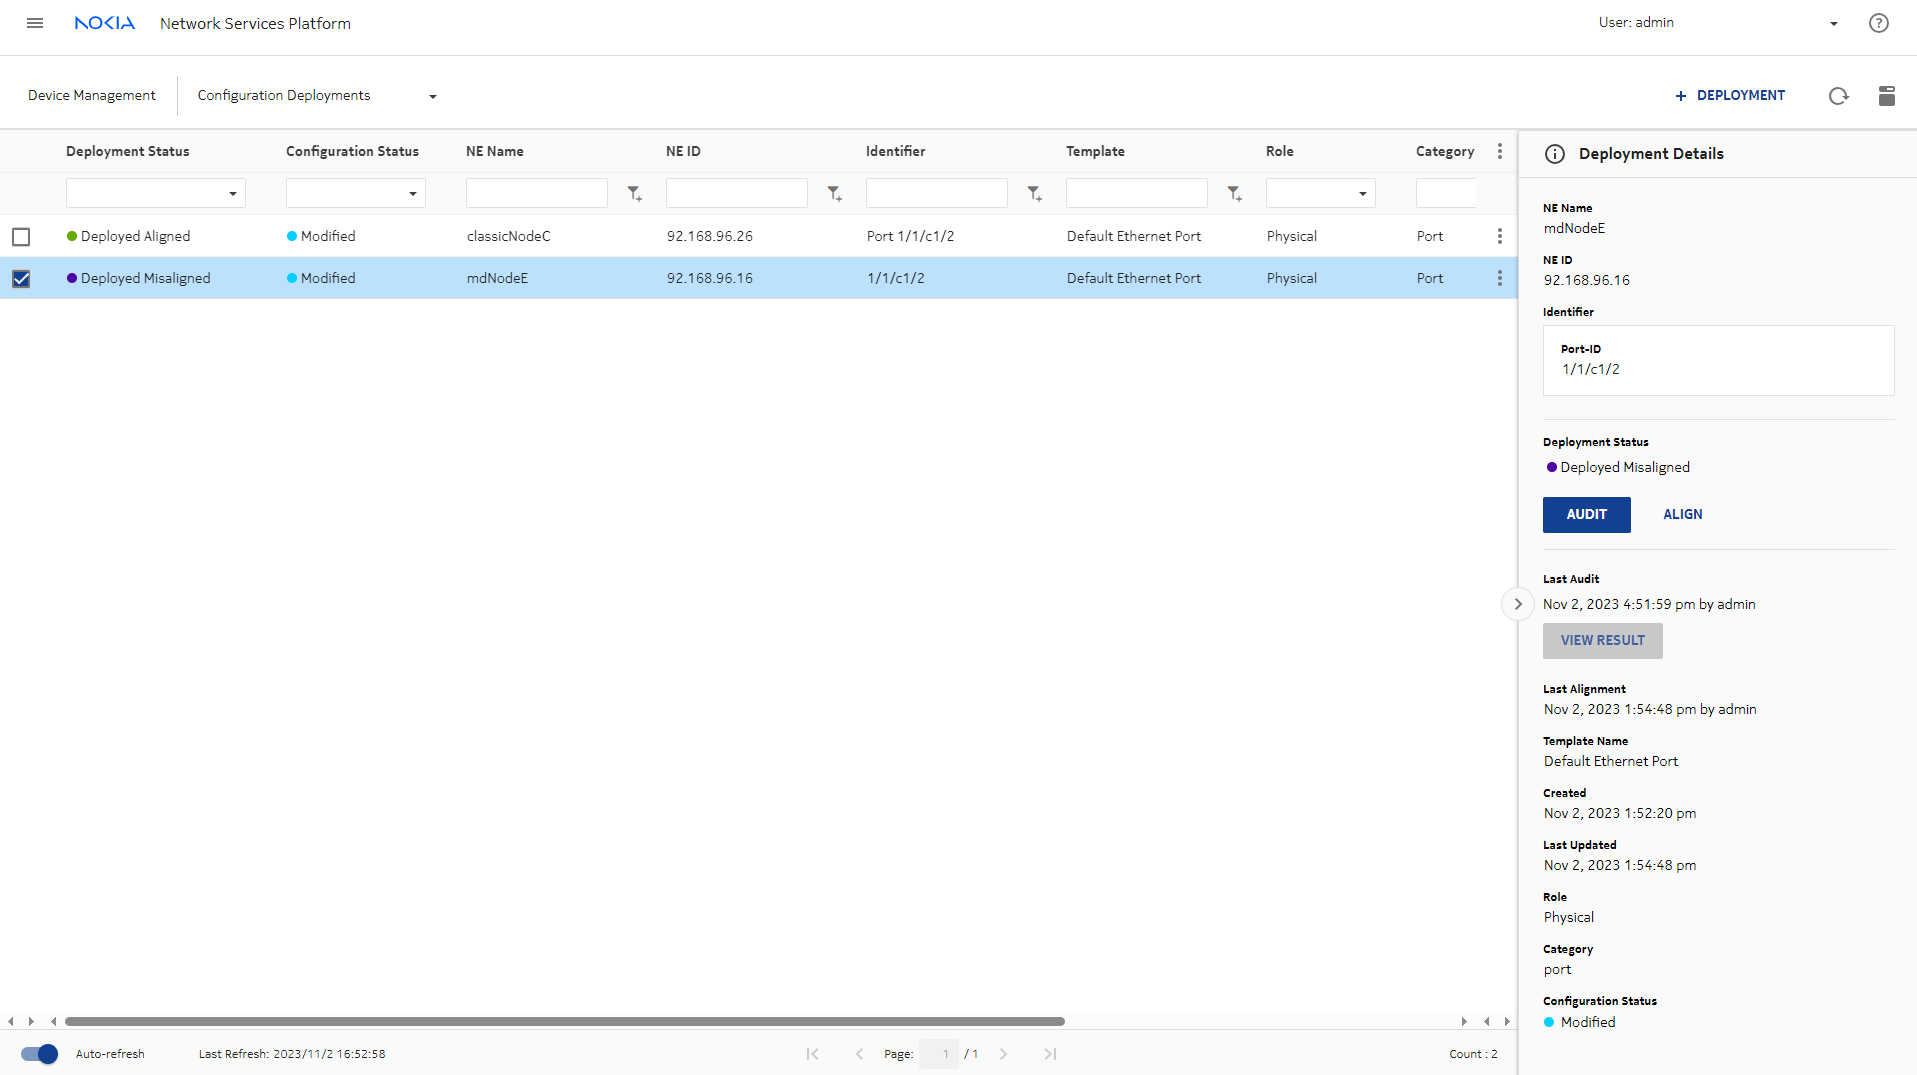
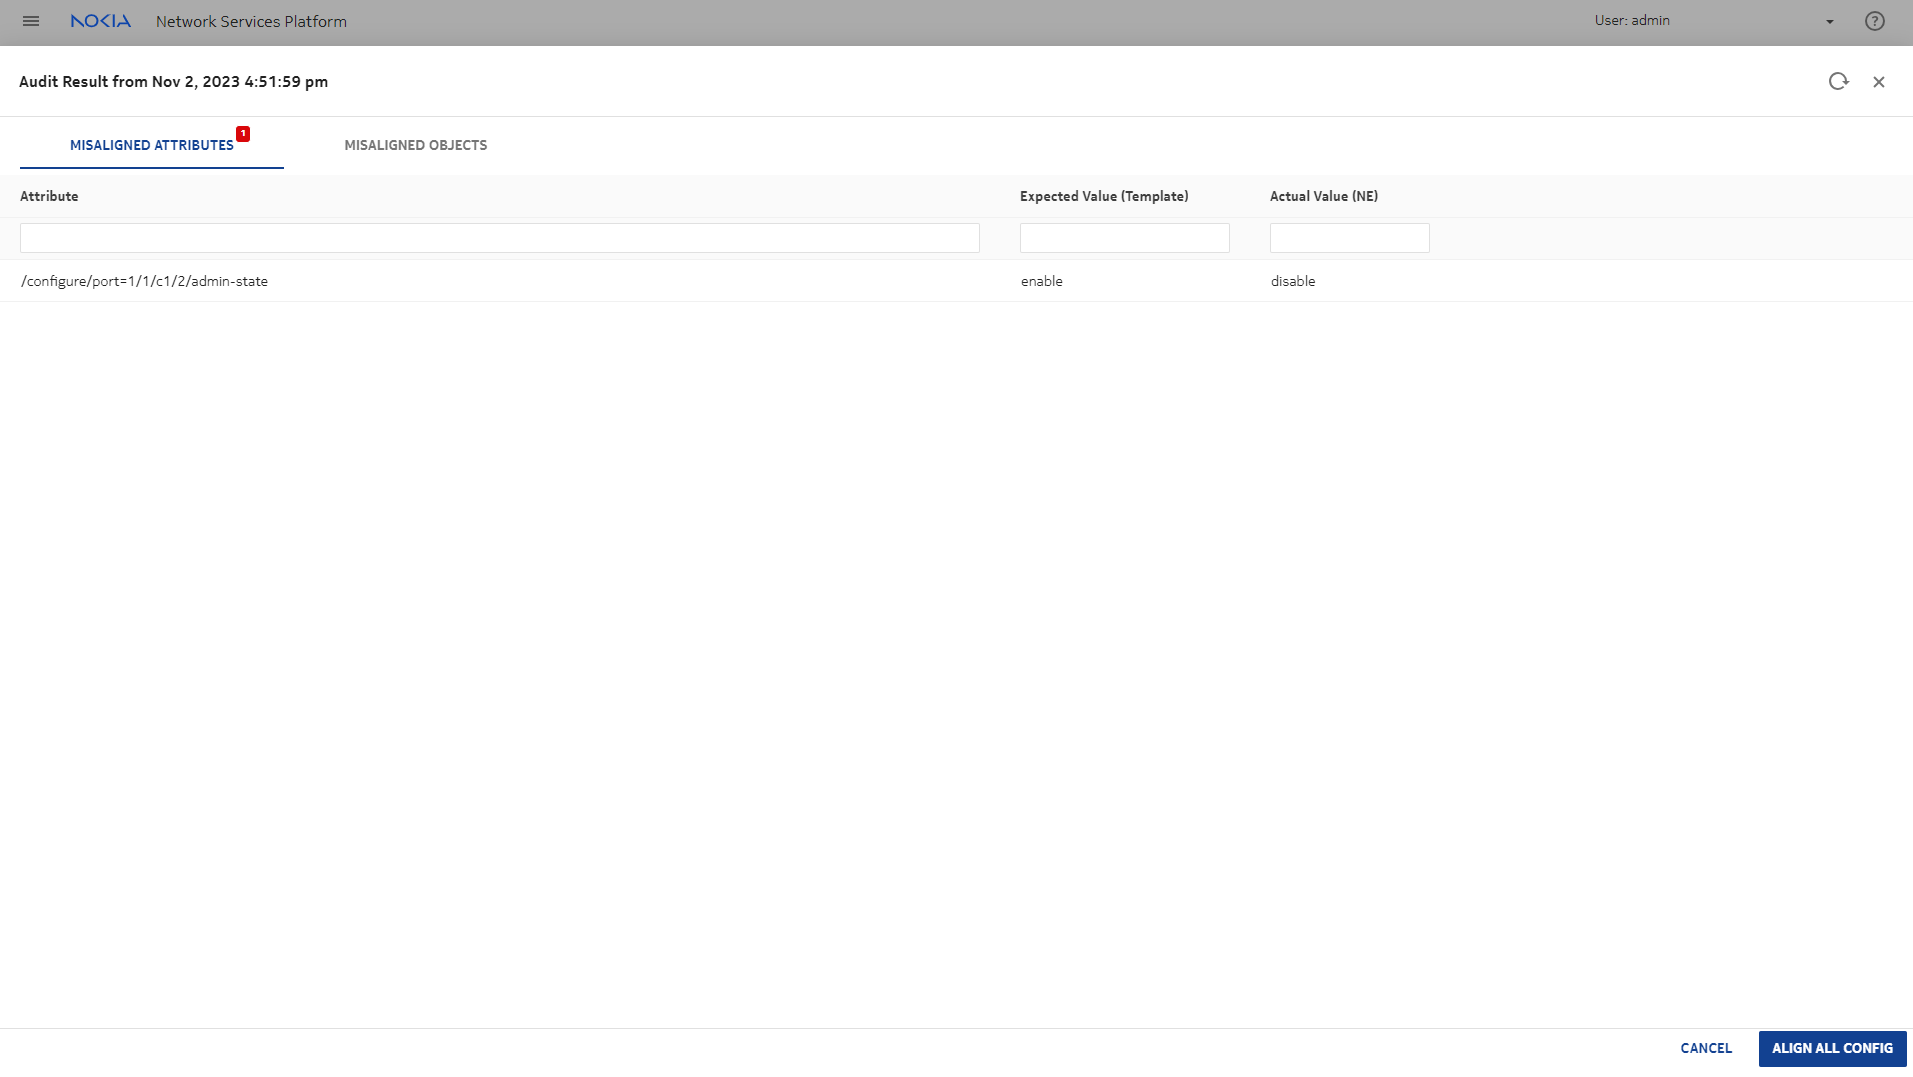
After auditing the port deployment, we can see that it is misaligned. Select the deployment and click VIEW RESULT to see the results of the audit.

The results show a misaligned attribute. The administrative state for one of the ports is incorrect.


Select ALIGN ALL CONFIG to perform an alignment to fix the discrepancy.

Perform another AUDIT to confirm the alignment.


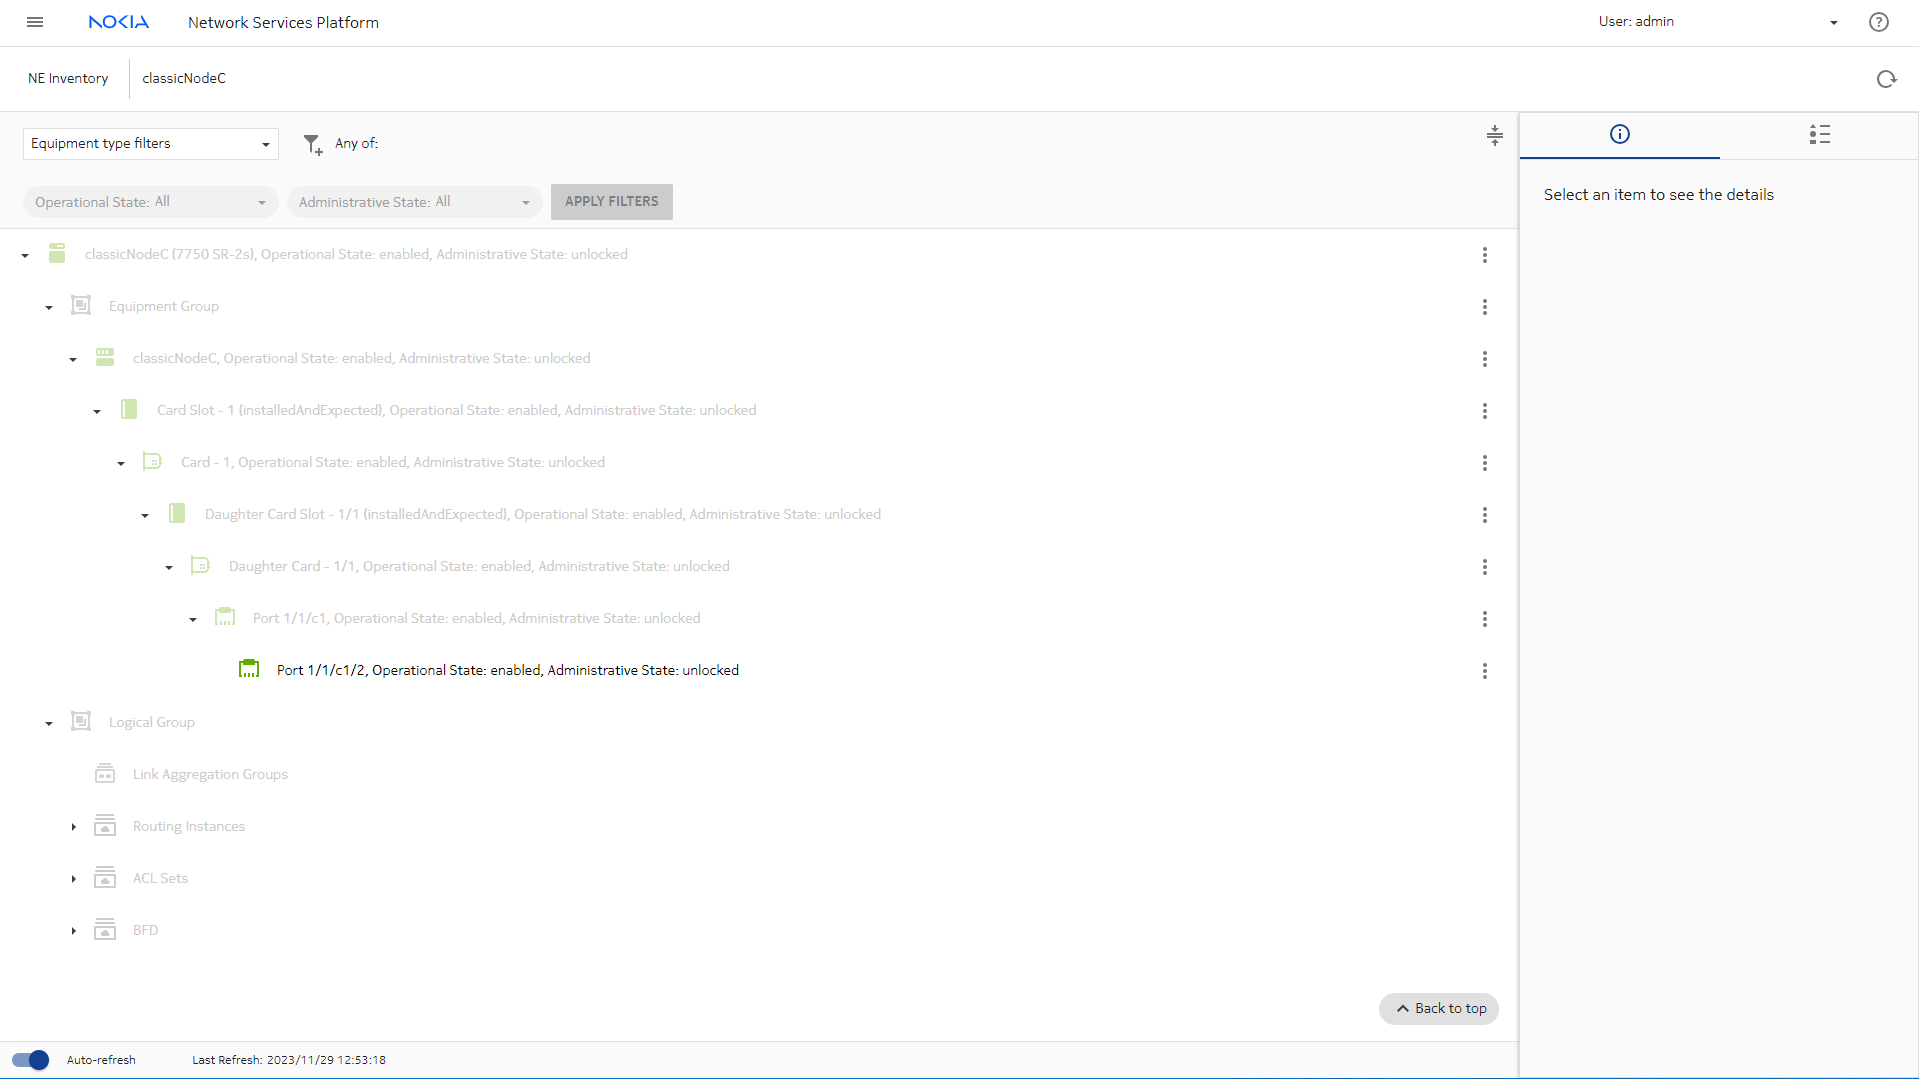
Returning to Network Inventory, we can see that the port now displays green and its administrative state is unlocked.


In the Multi-layer view, the links now also display green.


Returning to Data Collection and Analysis Visualizations, we can also see that traffic utilization has resumed.