End-to-end NE troubleshooting scenario
Purpose
This process shows you how to use NSP in troubleshooting issues on NEs.
In this scenario, an NE is experiencing problems.
View affected equipment related resources
|
|
1 |
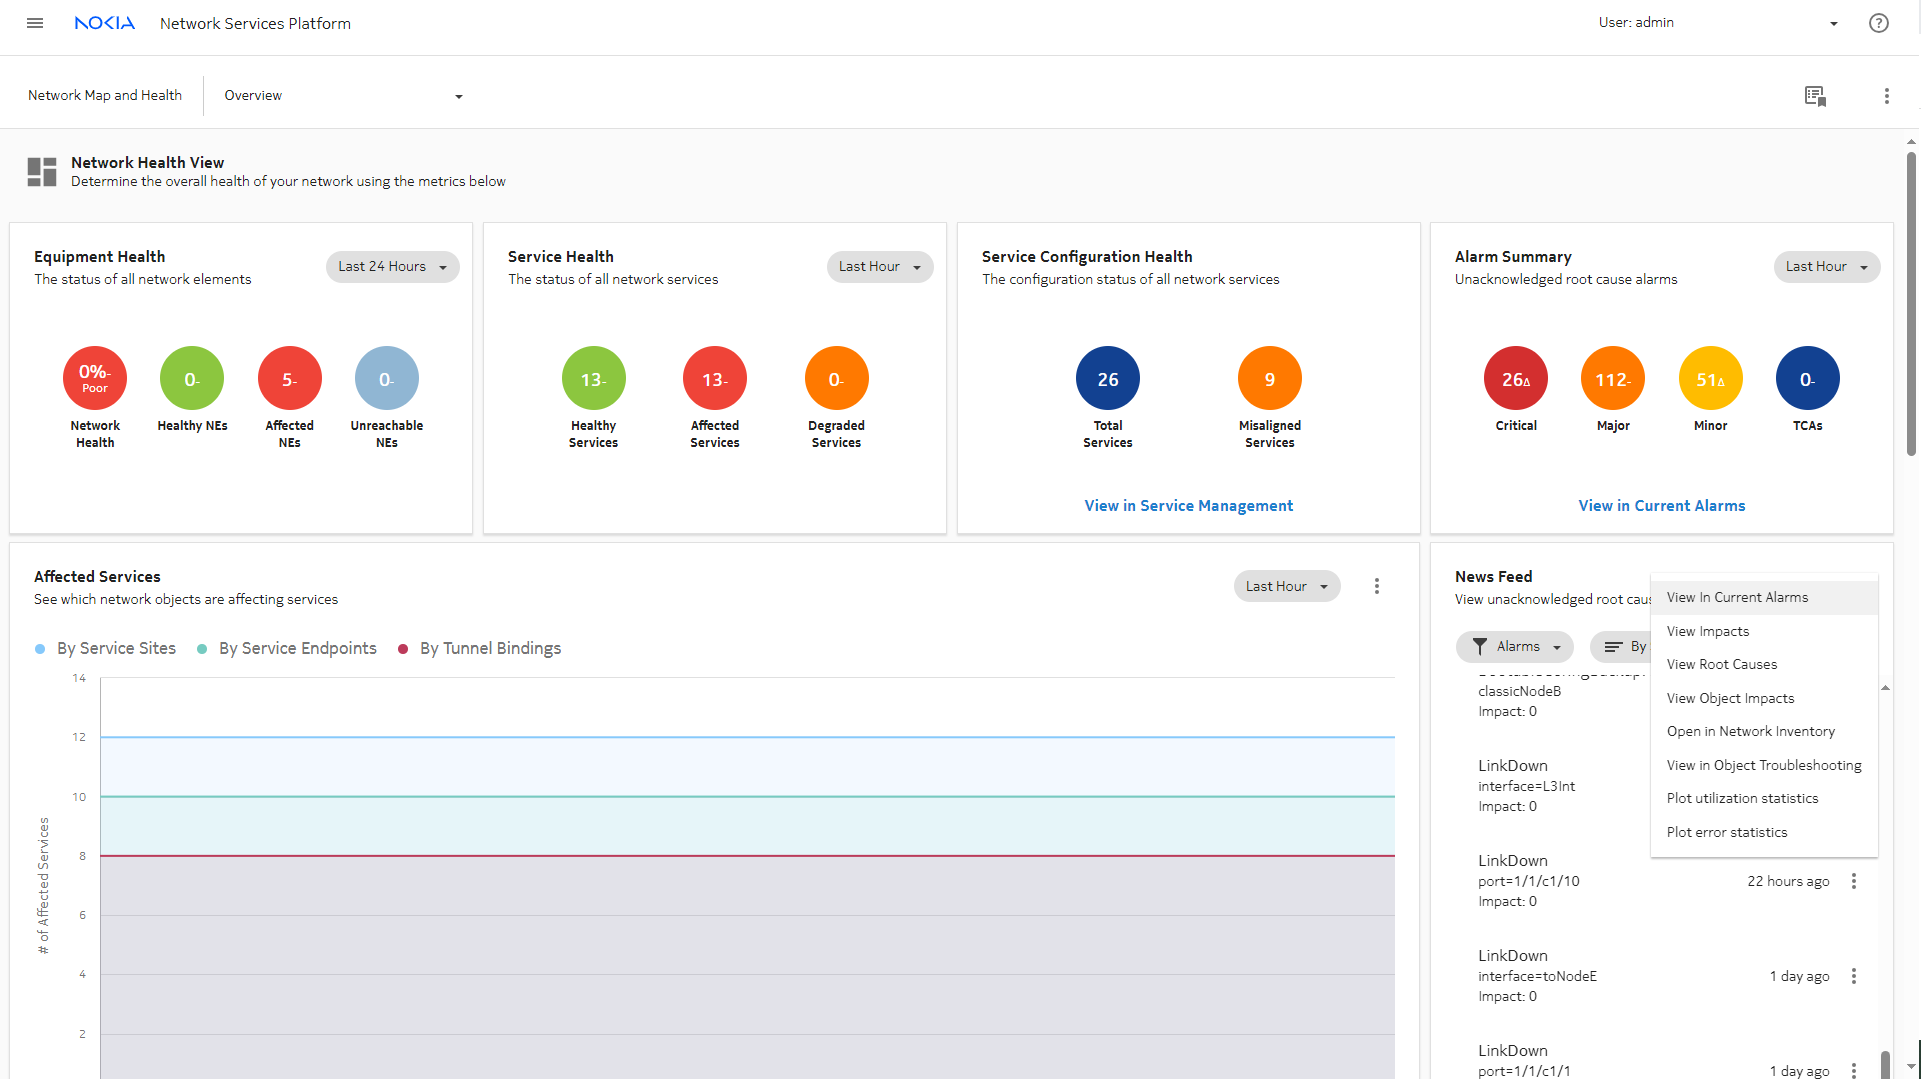
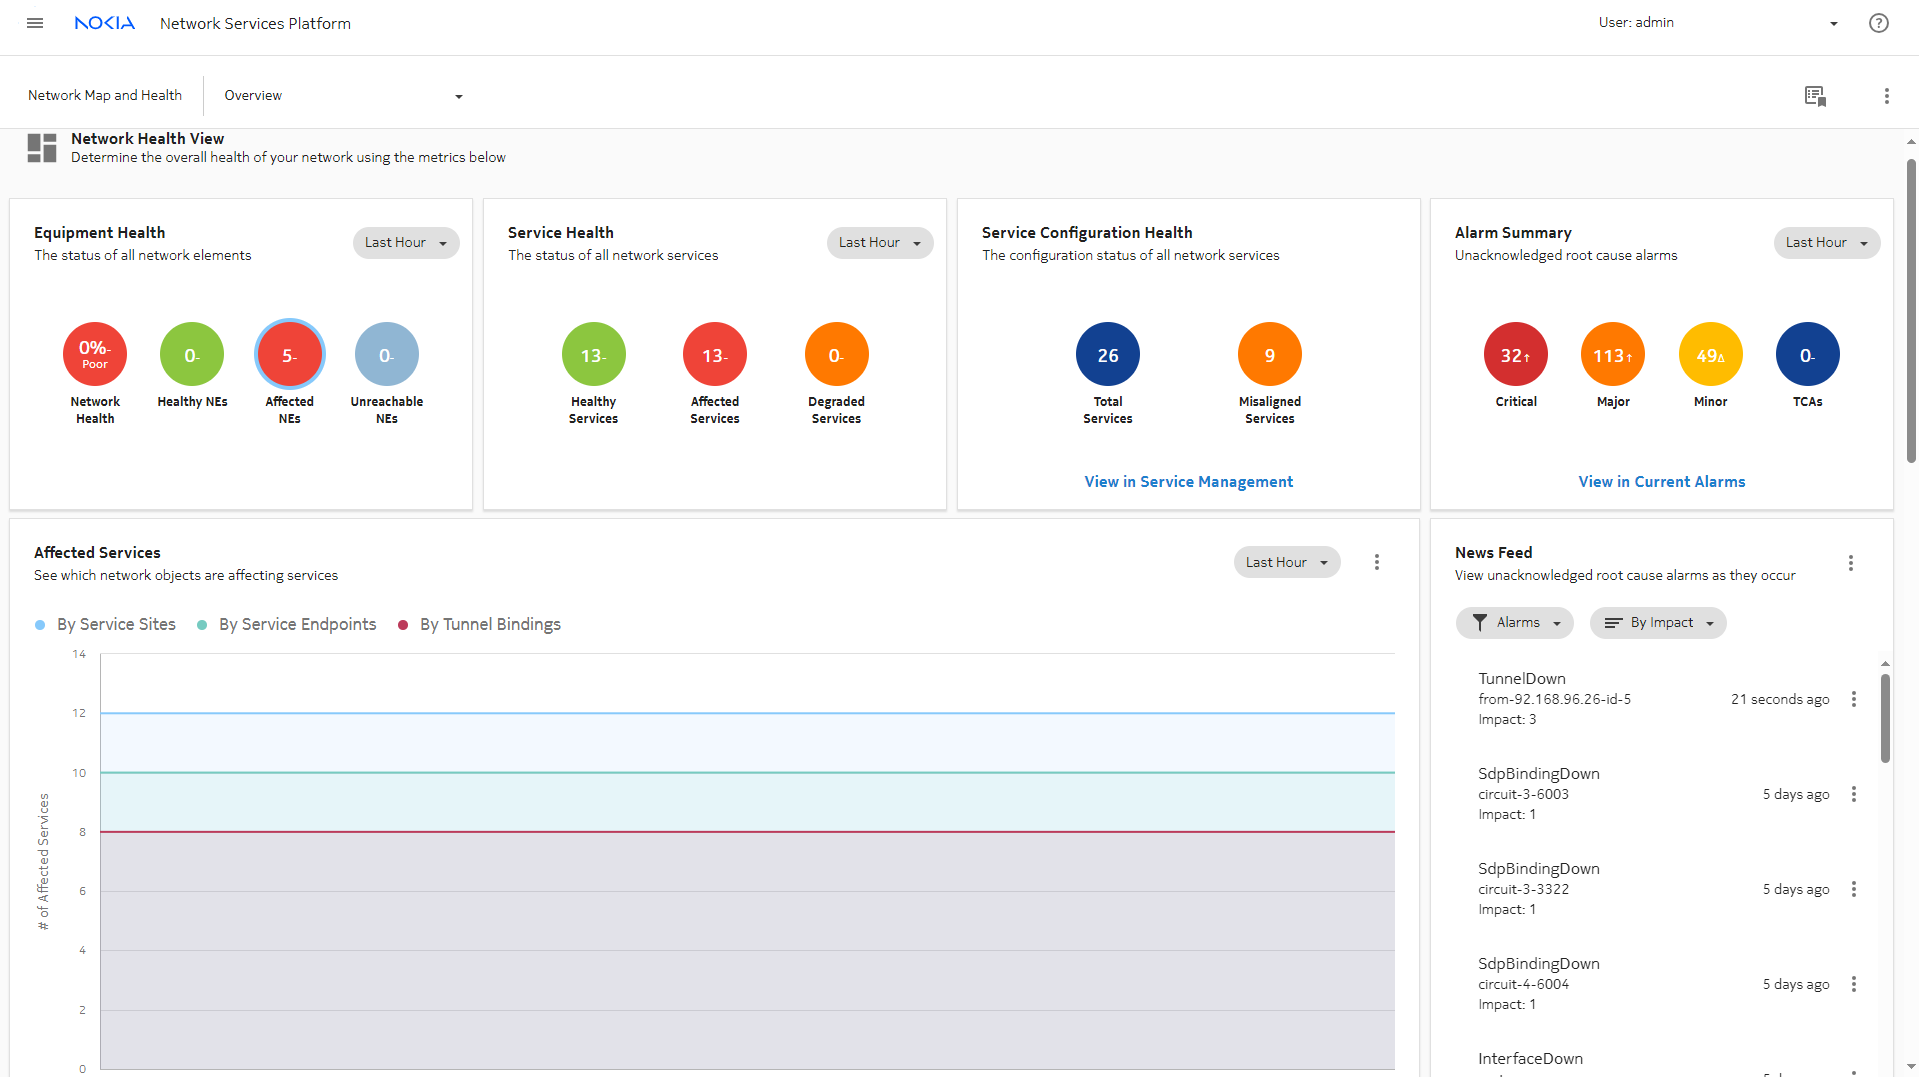
The Equipment Health dashlet in the Network Map and Health dashboard uses KPIs to show NE states.
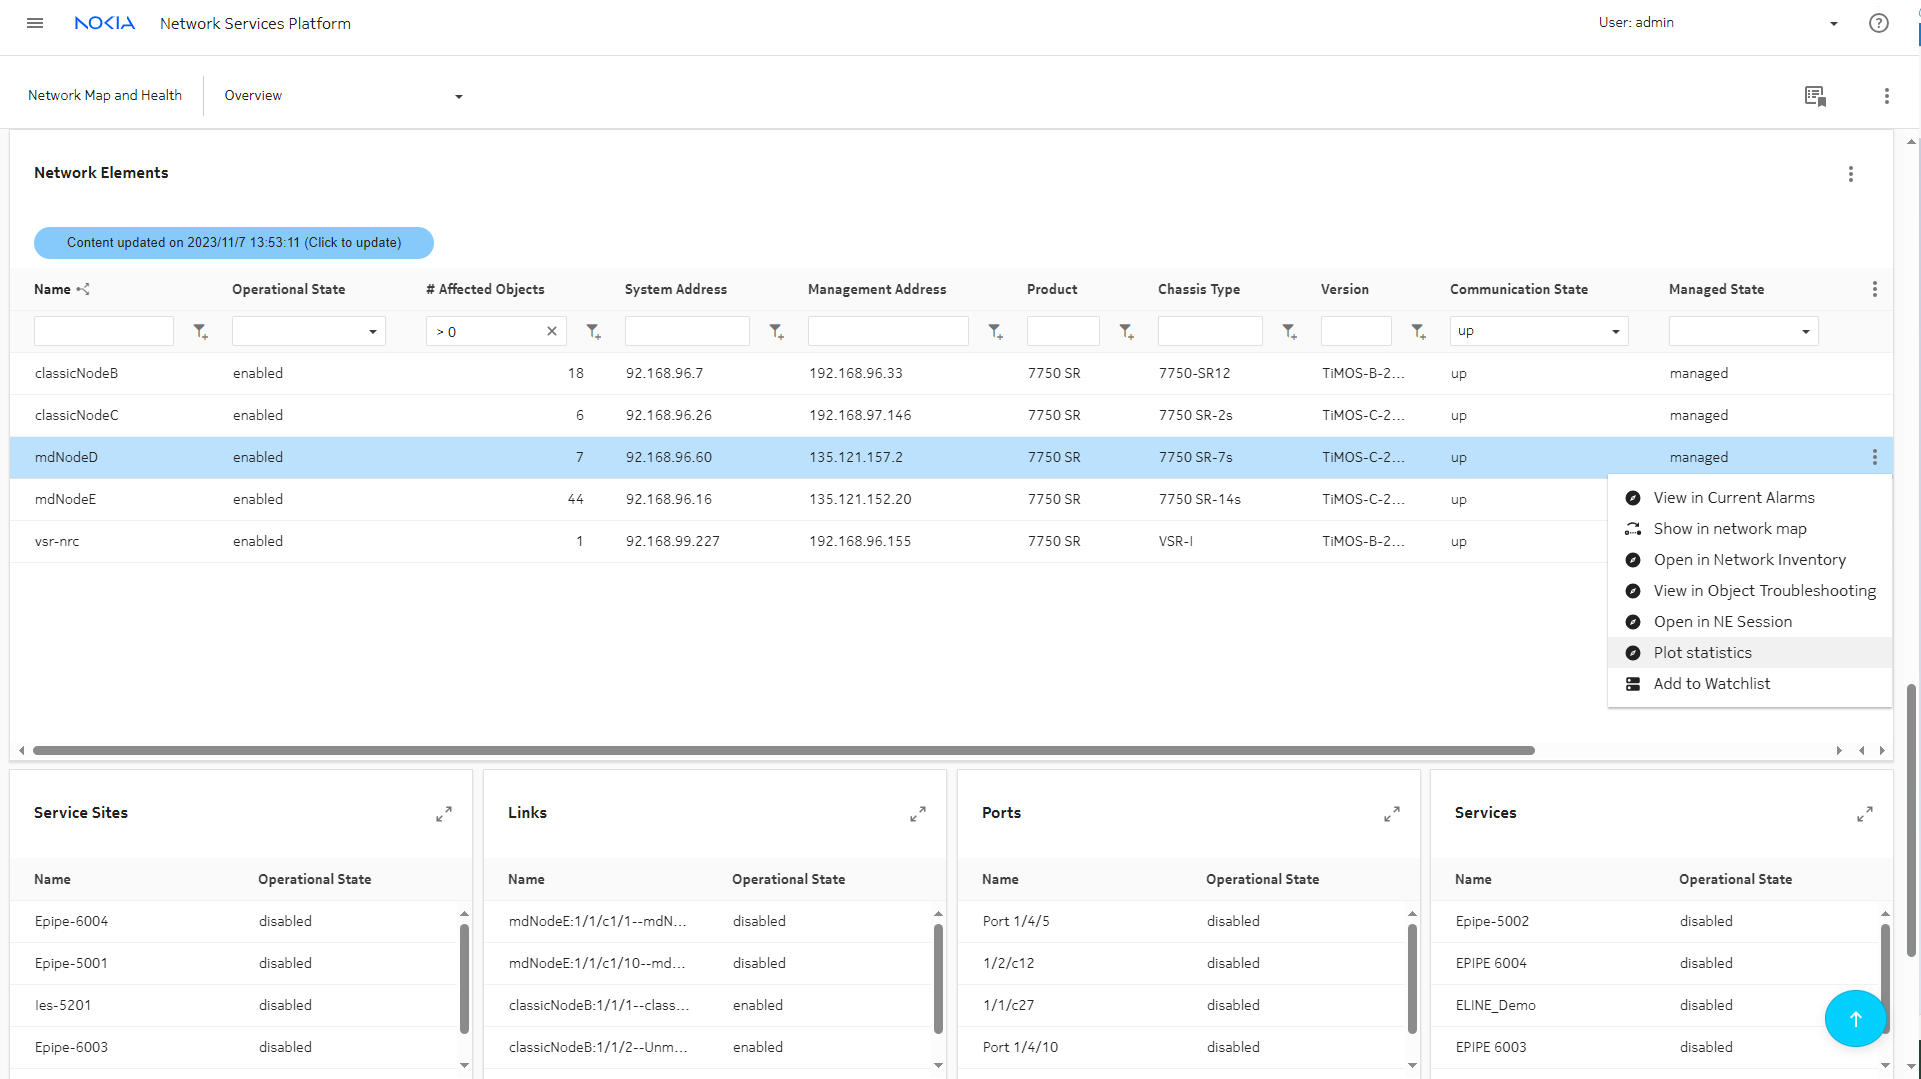
The Affected NEs KPI indicates that there are NEs to look at to start investigating. Click the Affected NEs circle to launch the Network Elements data page.
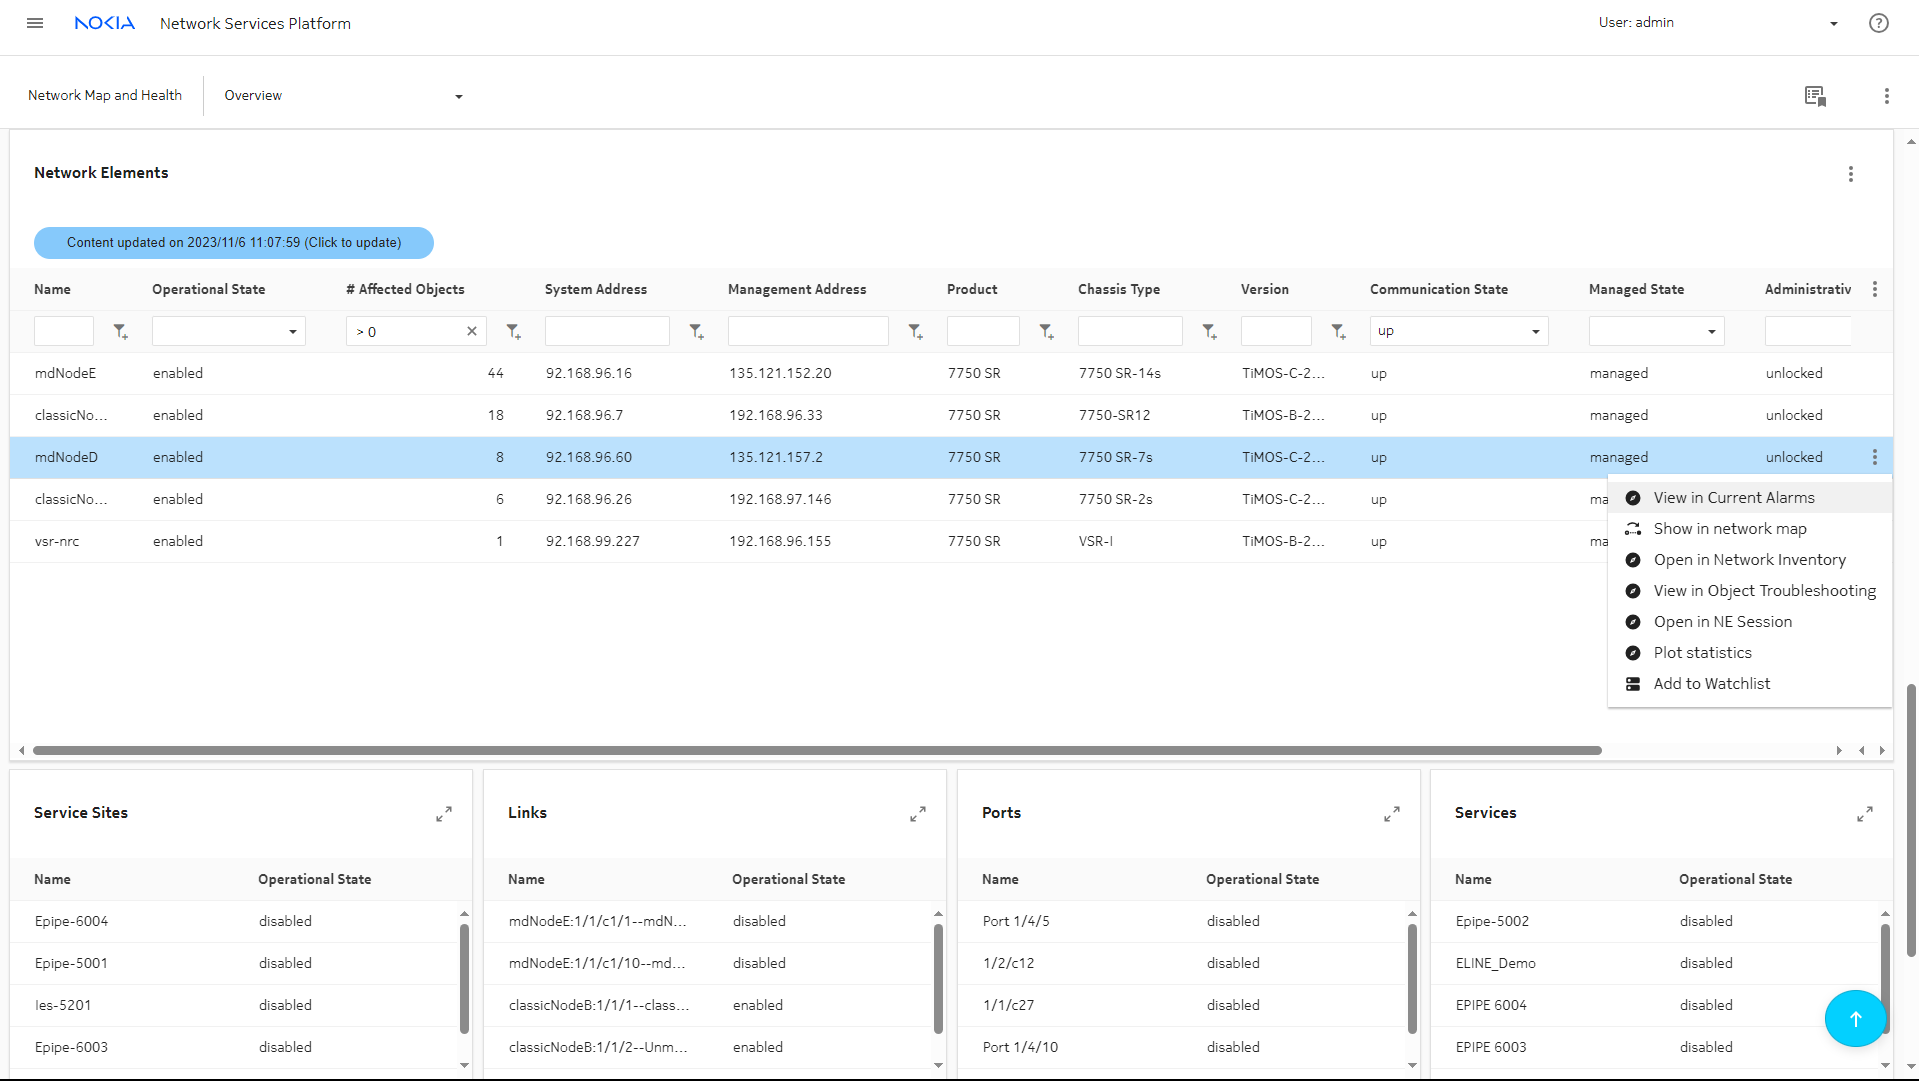
The Network Elements data page appears, filtered to show the list of NEs with at least one affected object. The default filter can be changed if needed, for example, to focus on NEs with more affected objects. We’ll focus on the Affected Objects column for the NE we’re troubleshooting.
Select the NE and click (Table row actions), View in Current Alarms.
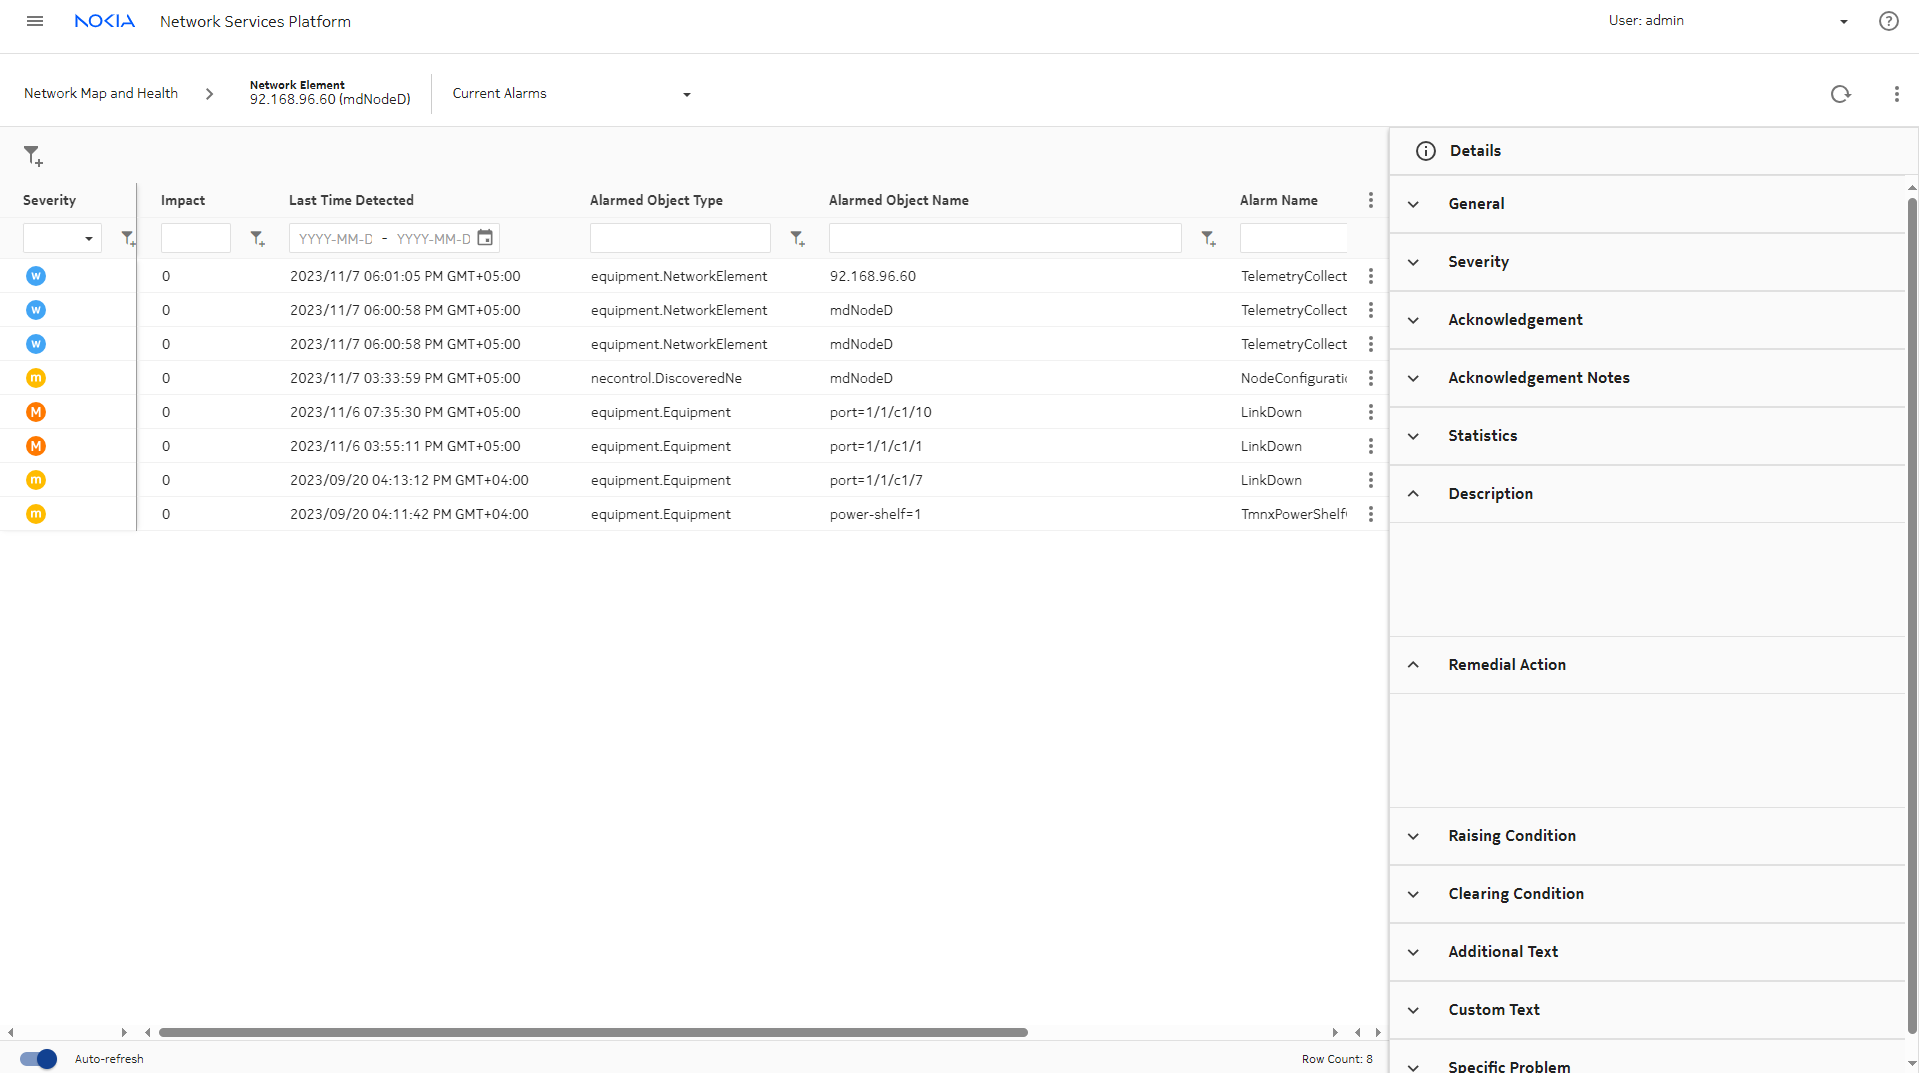
Current Alarms opens, showing a filtered list of alarms. Click on an alarm to see information in the Details panel, or use (Table row actions) menu to show impacts, root cause, or open NE CLI session.
|
View the News Feed
The News Feed provides a live feed of unacknowledged root cause alarms as they occur in real time. Alarm severity and number of impacts are displayed, and cross launch is available depending on the alarm. All alarms can cross launch to Current Alarms.
|
|
1 |
From the News Feed, select an alarm affecting the node. Click View in Current Alarms from the More menu.
|
2 |
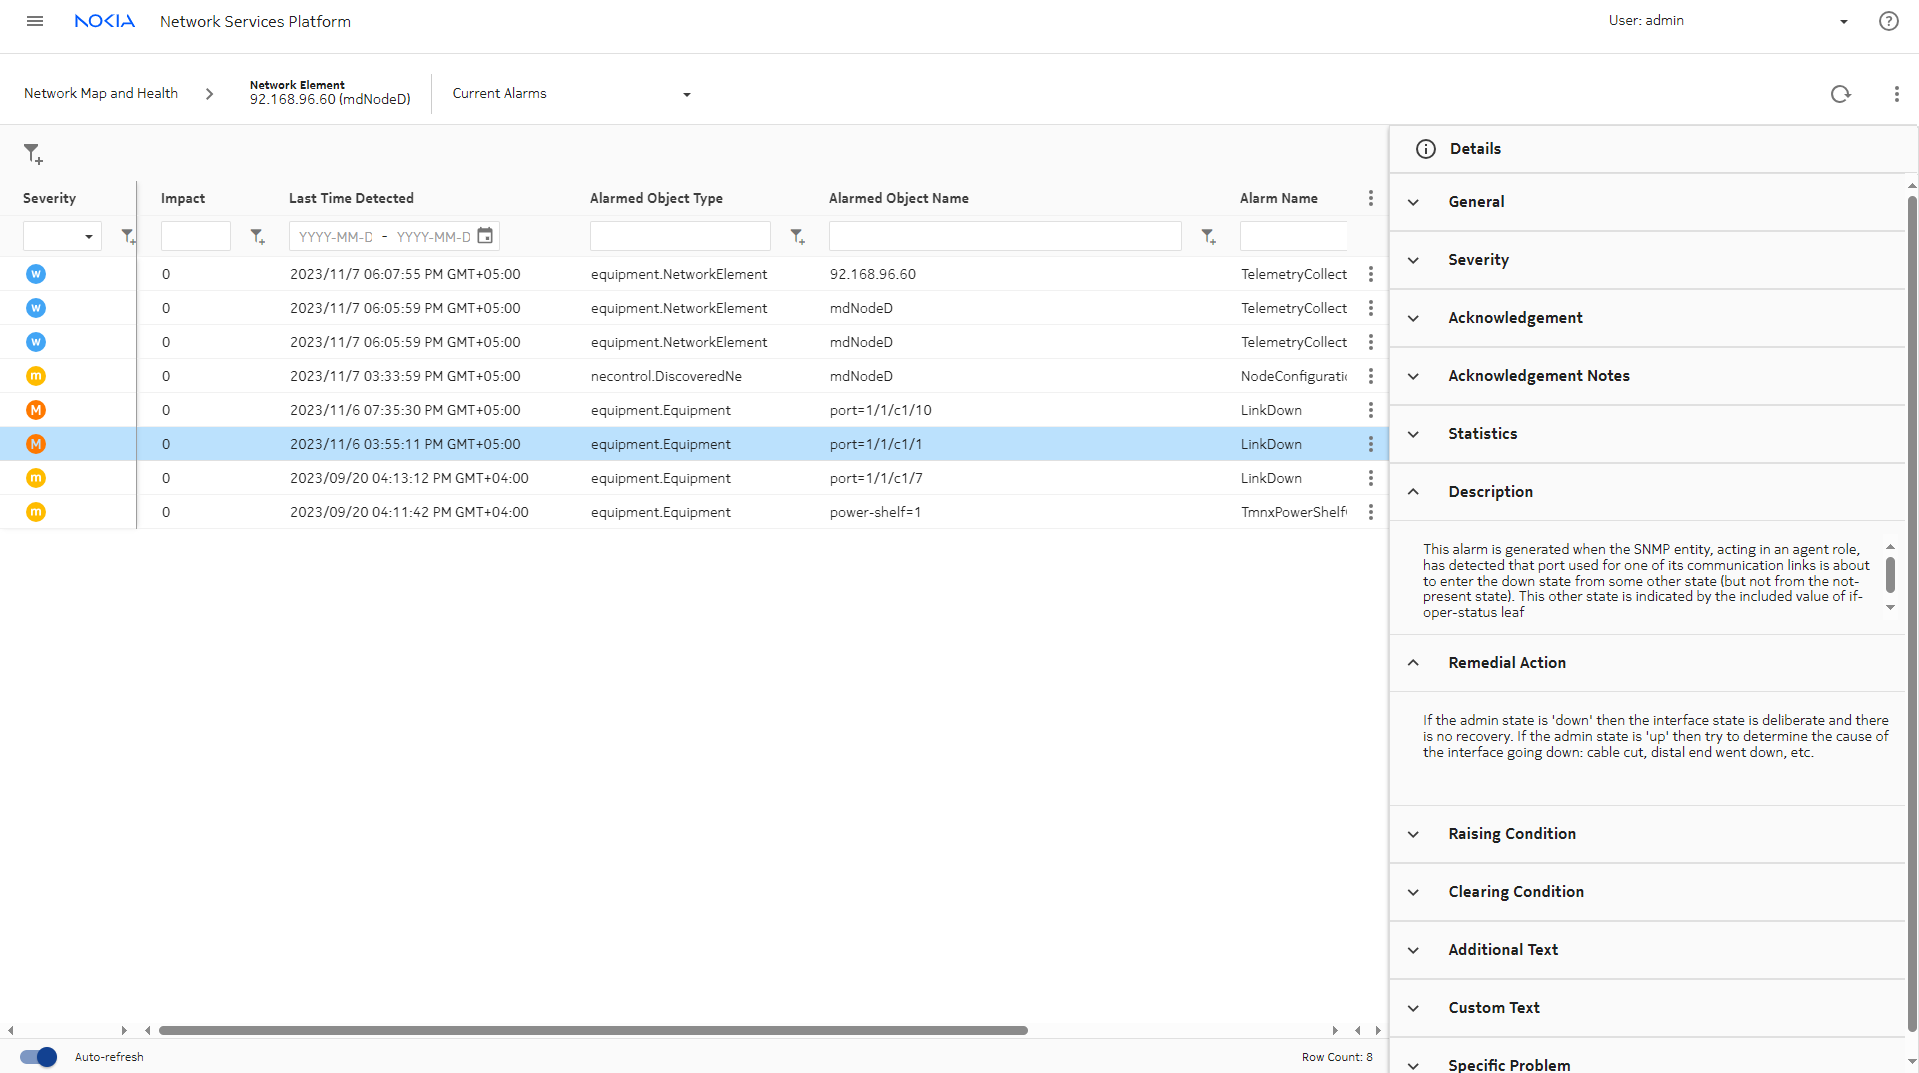
Current Alarms provides details of the alarm, such as the alarm description, raising and clearing conditions, and remedial action.
|
3 |
Another option is to note the NE name and switch to the Unhealthy NEs or Top Problems view, to see what other alarms are present on the NE and what other issues the NE is experiencing. |
View the Network Map and Health dashboard map view
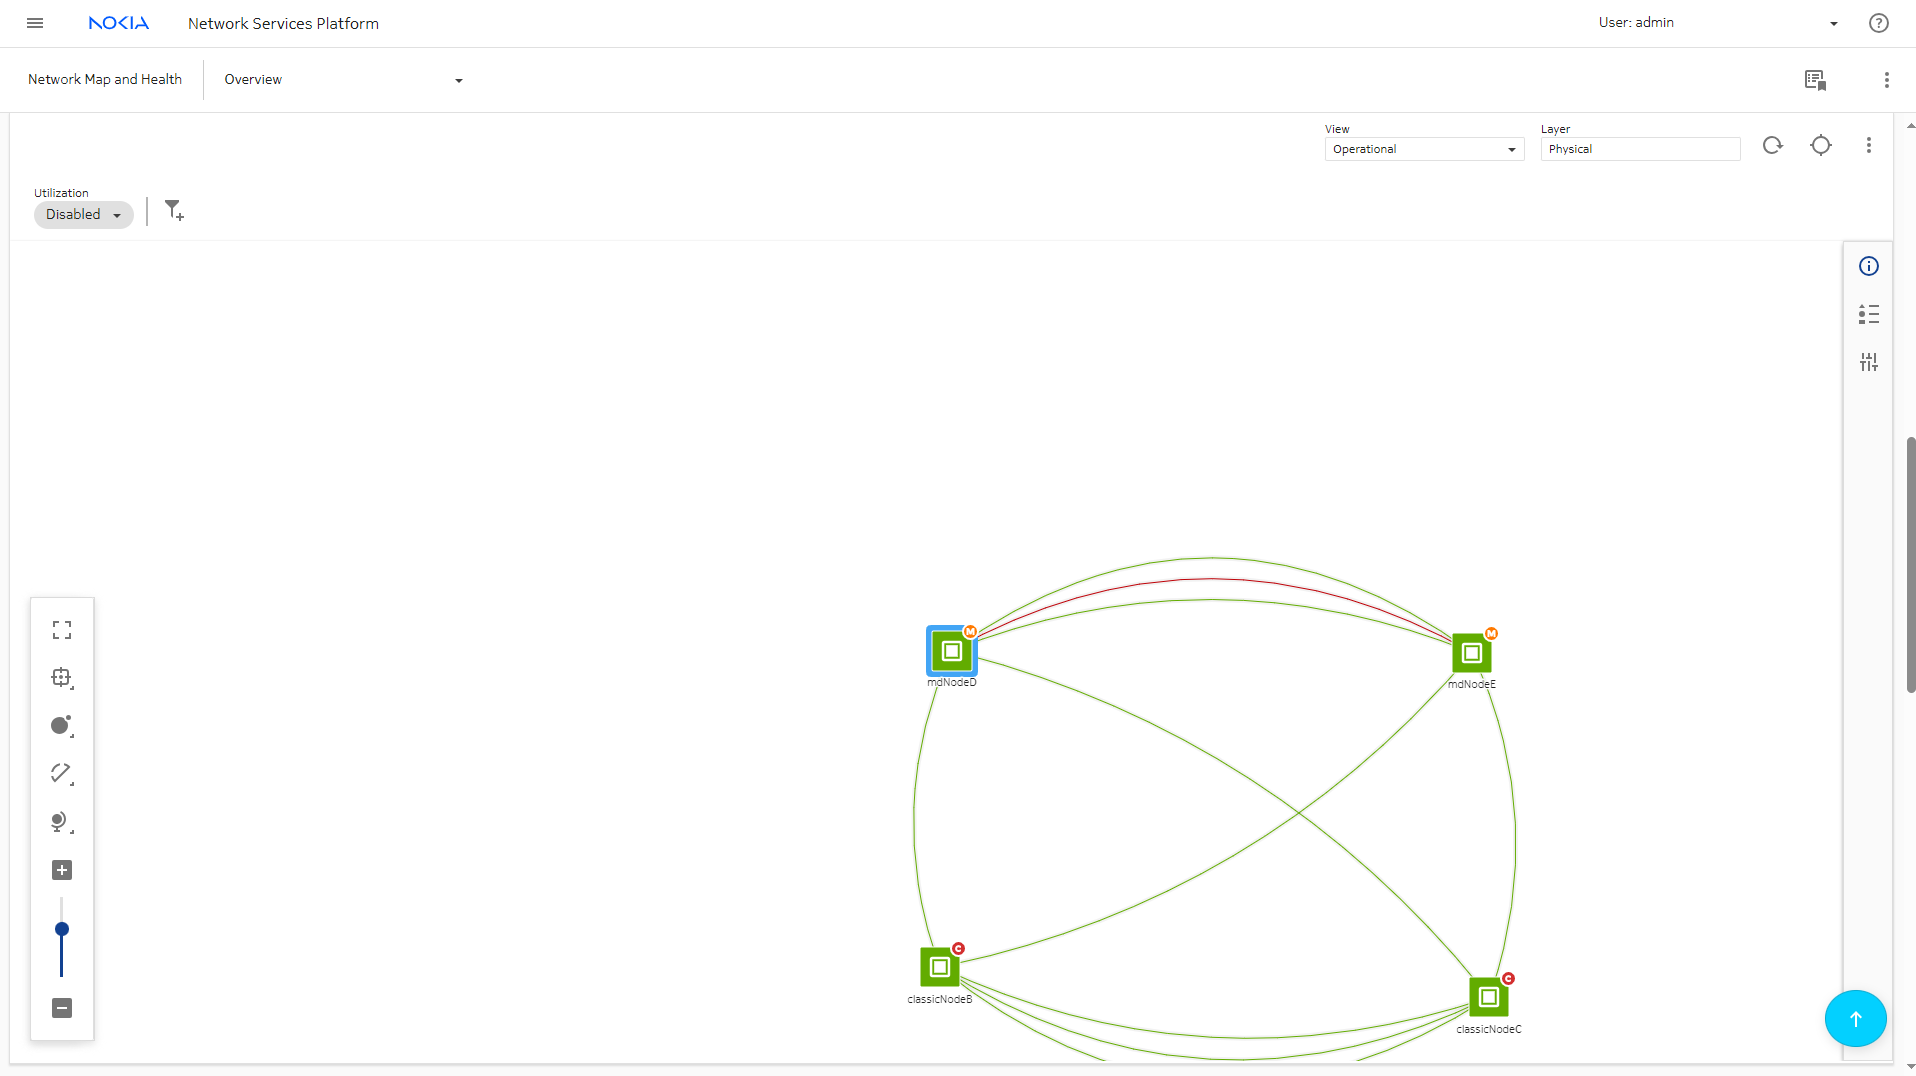
Another option on the Network Map and Health is the Network Map View. Viewing the NE in the map will show us the status of links, in case there are any port issues affecting connectivity.
|
|
1 |
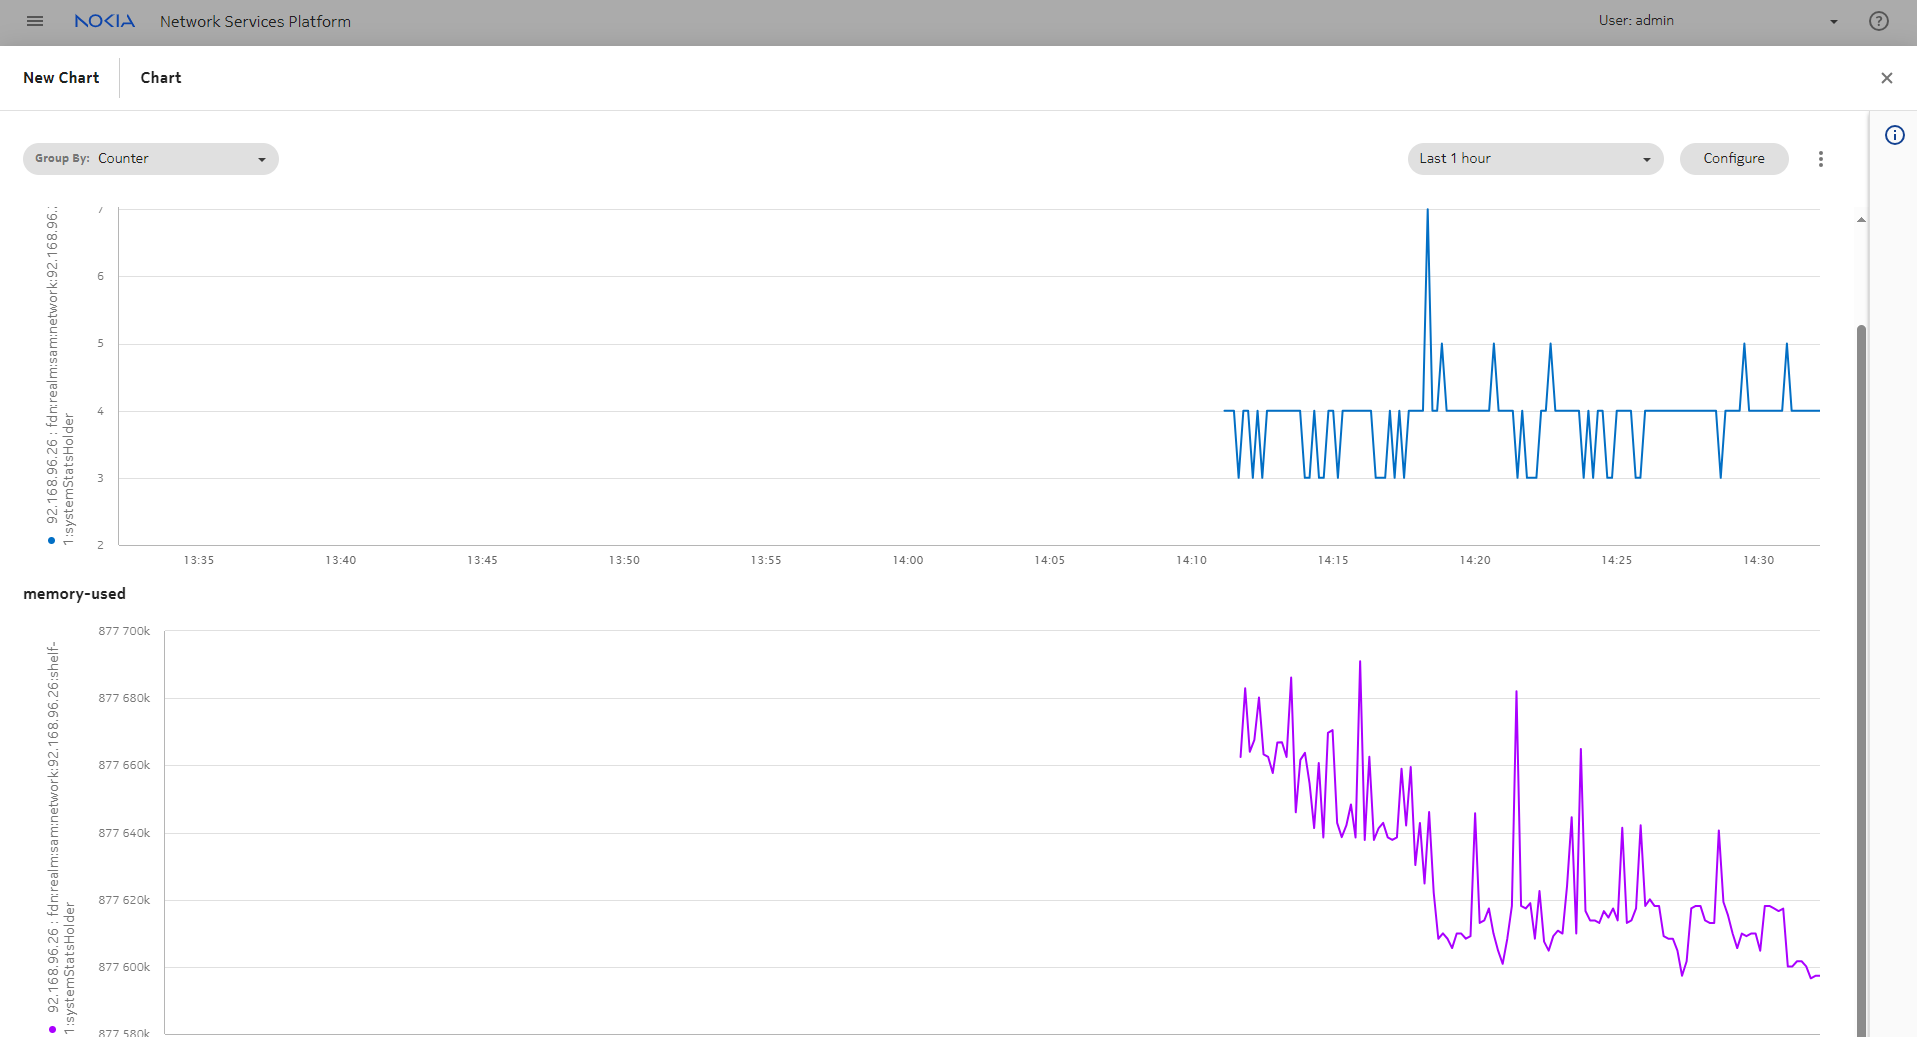
Navigate back to the Network Elements data page. Click on the NE and choose Plot statistics.
Data Collection and Analysis Visualizations launches, showing on-demand charts for memory and CPU usage for the NE.
|
2 |
Back in the Network Elements data page, click on the NE and select Show in network map to open the Network Map View with the NE highlighted.
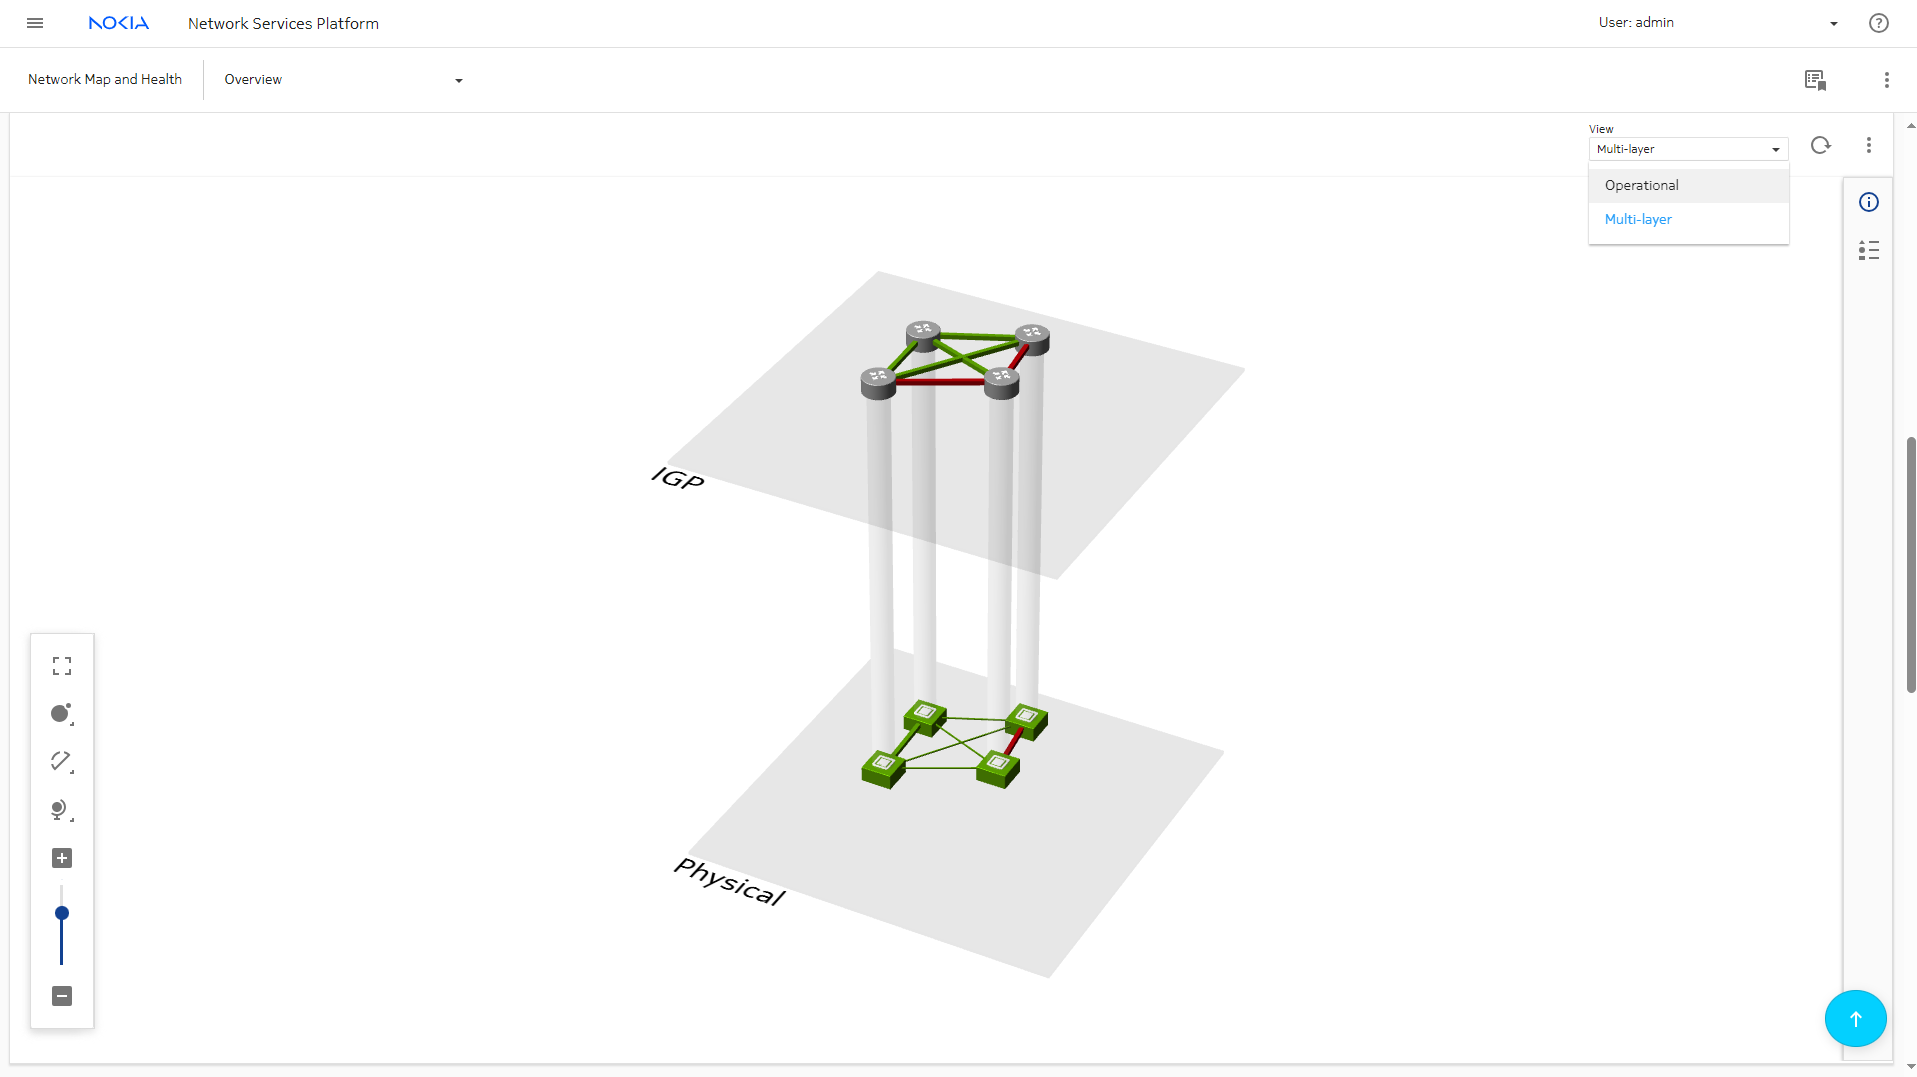
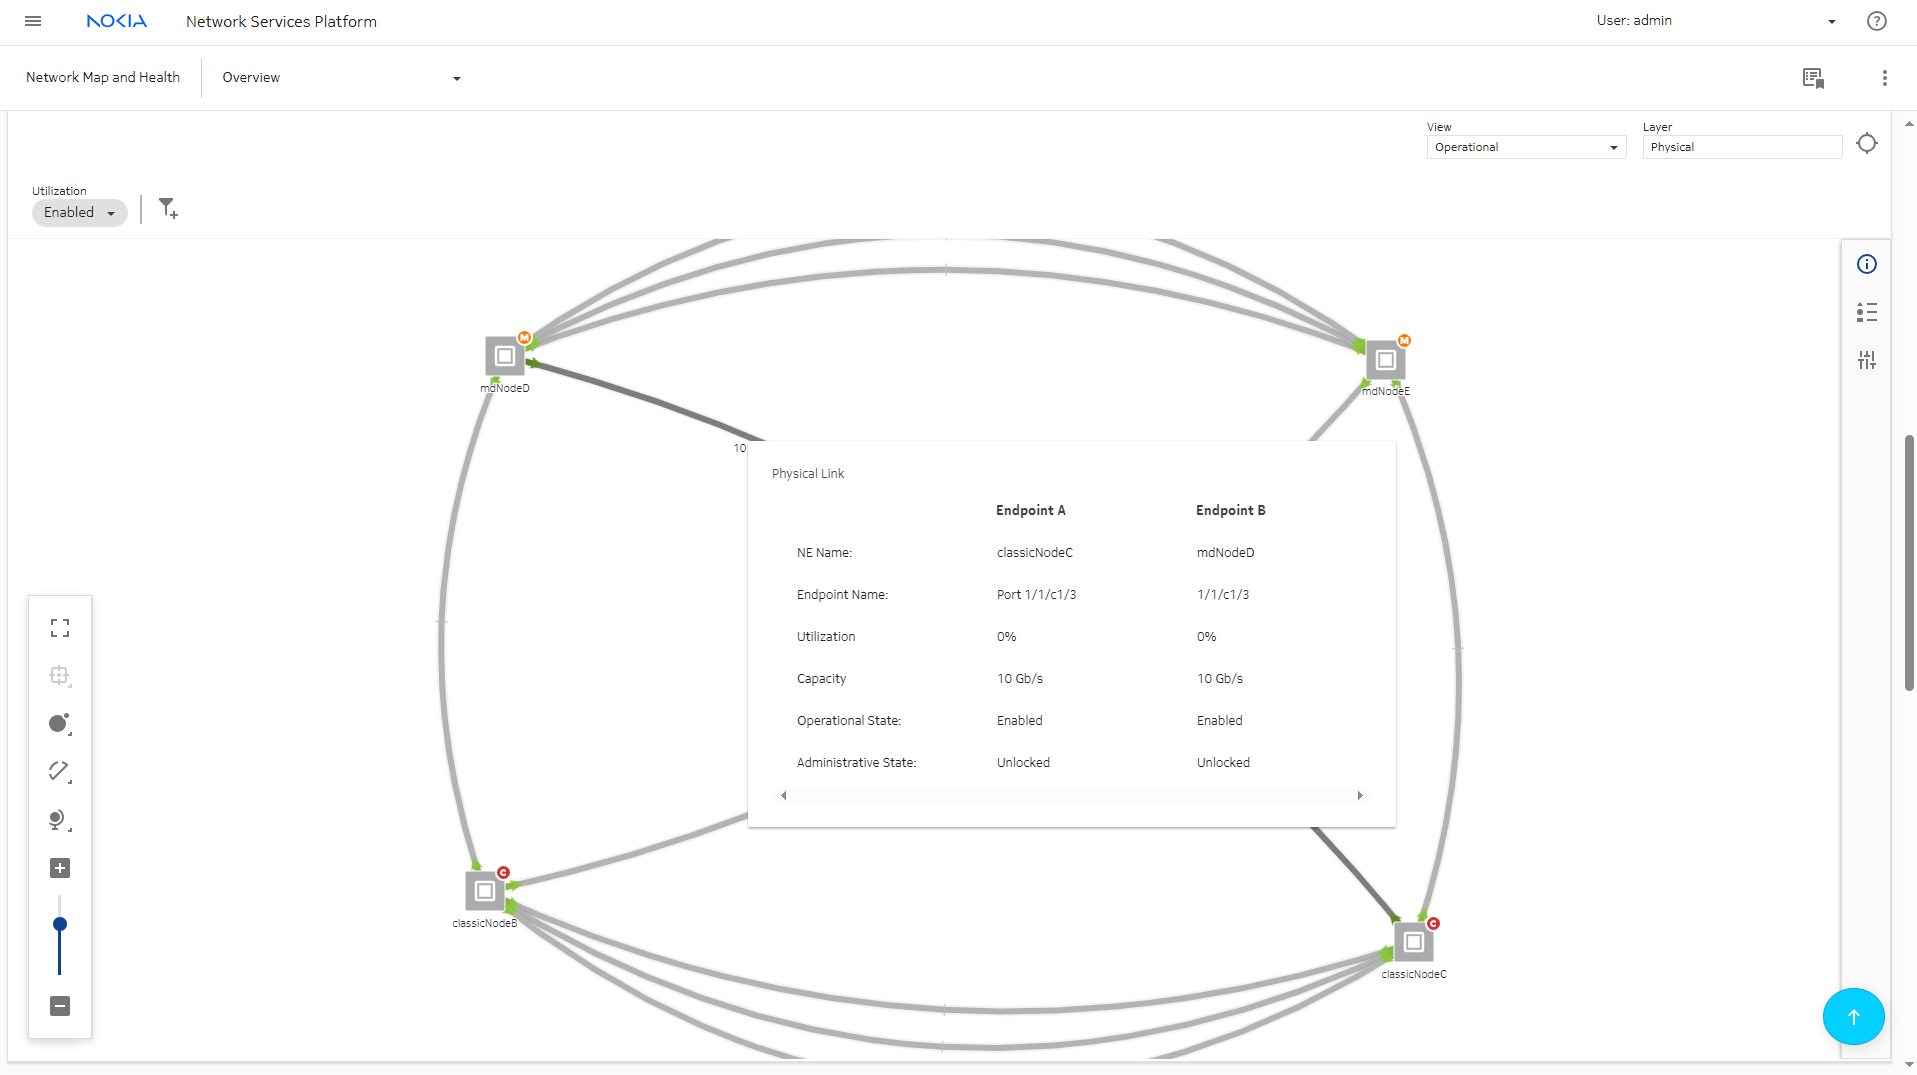
View the Multi-layer map to see the state of the links at the IGP layer.
Return to the Operational map and enable Utilization to show utilization statistics displayed on the map.
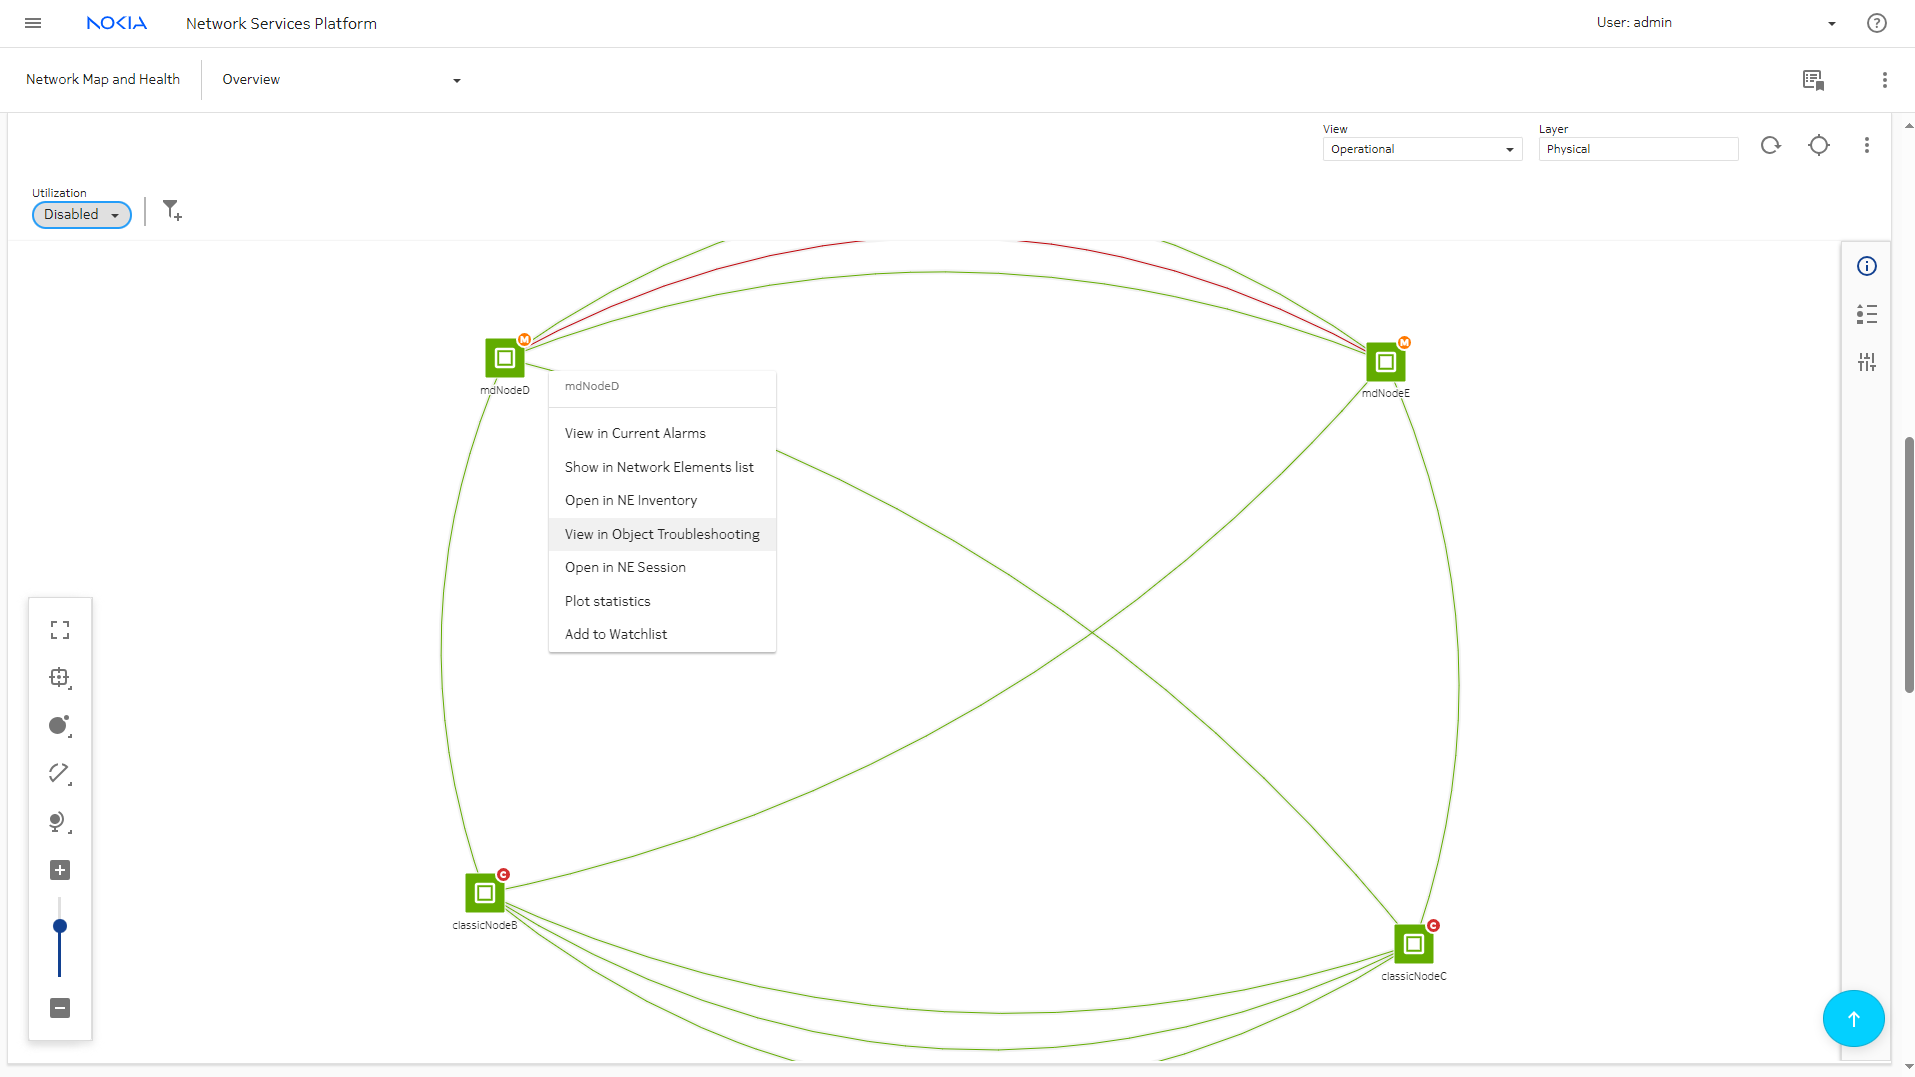
Right click on the node and select View in Object Troubleshooting.
|
Check the Object Troubleshooting dashboard
|
|
1 |
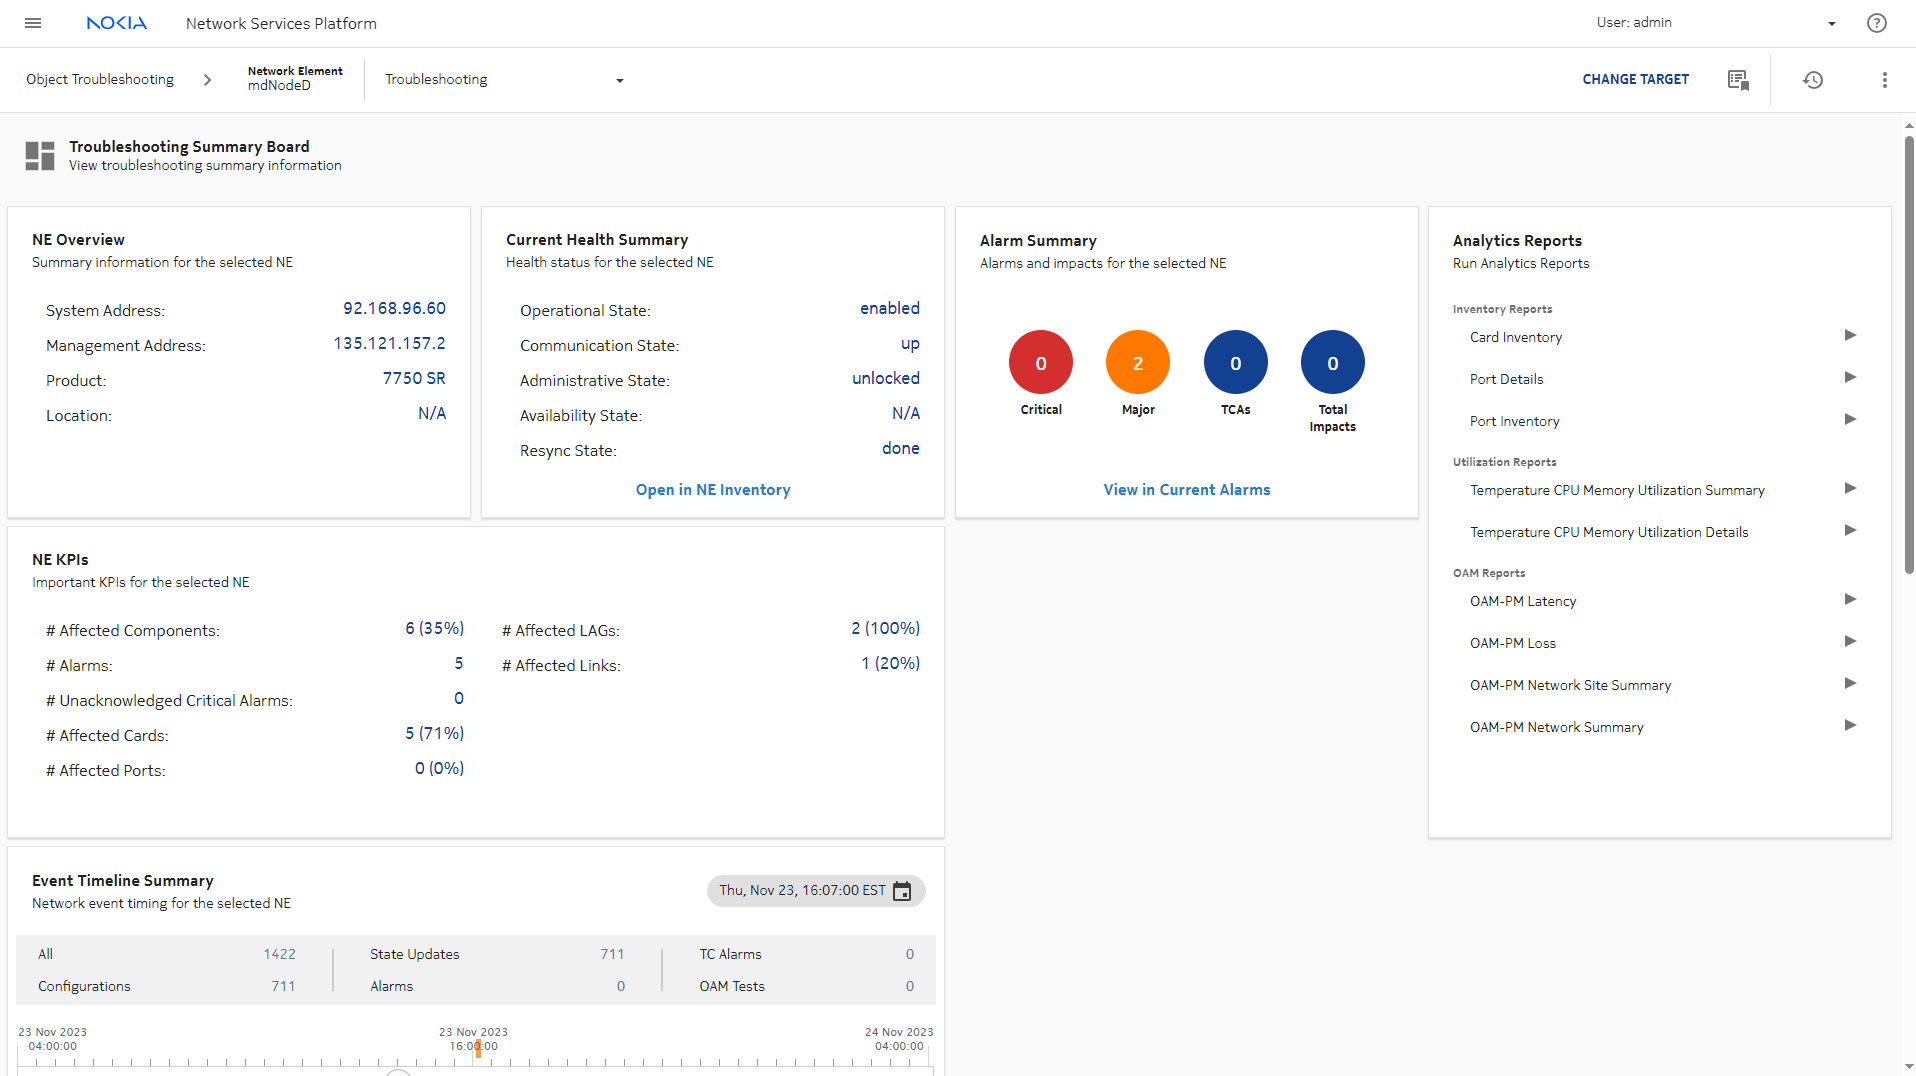
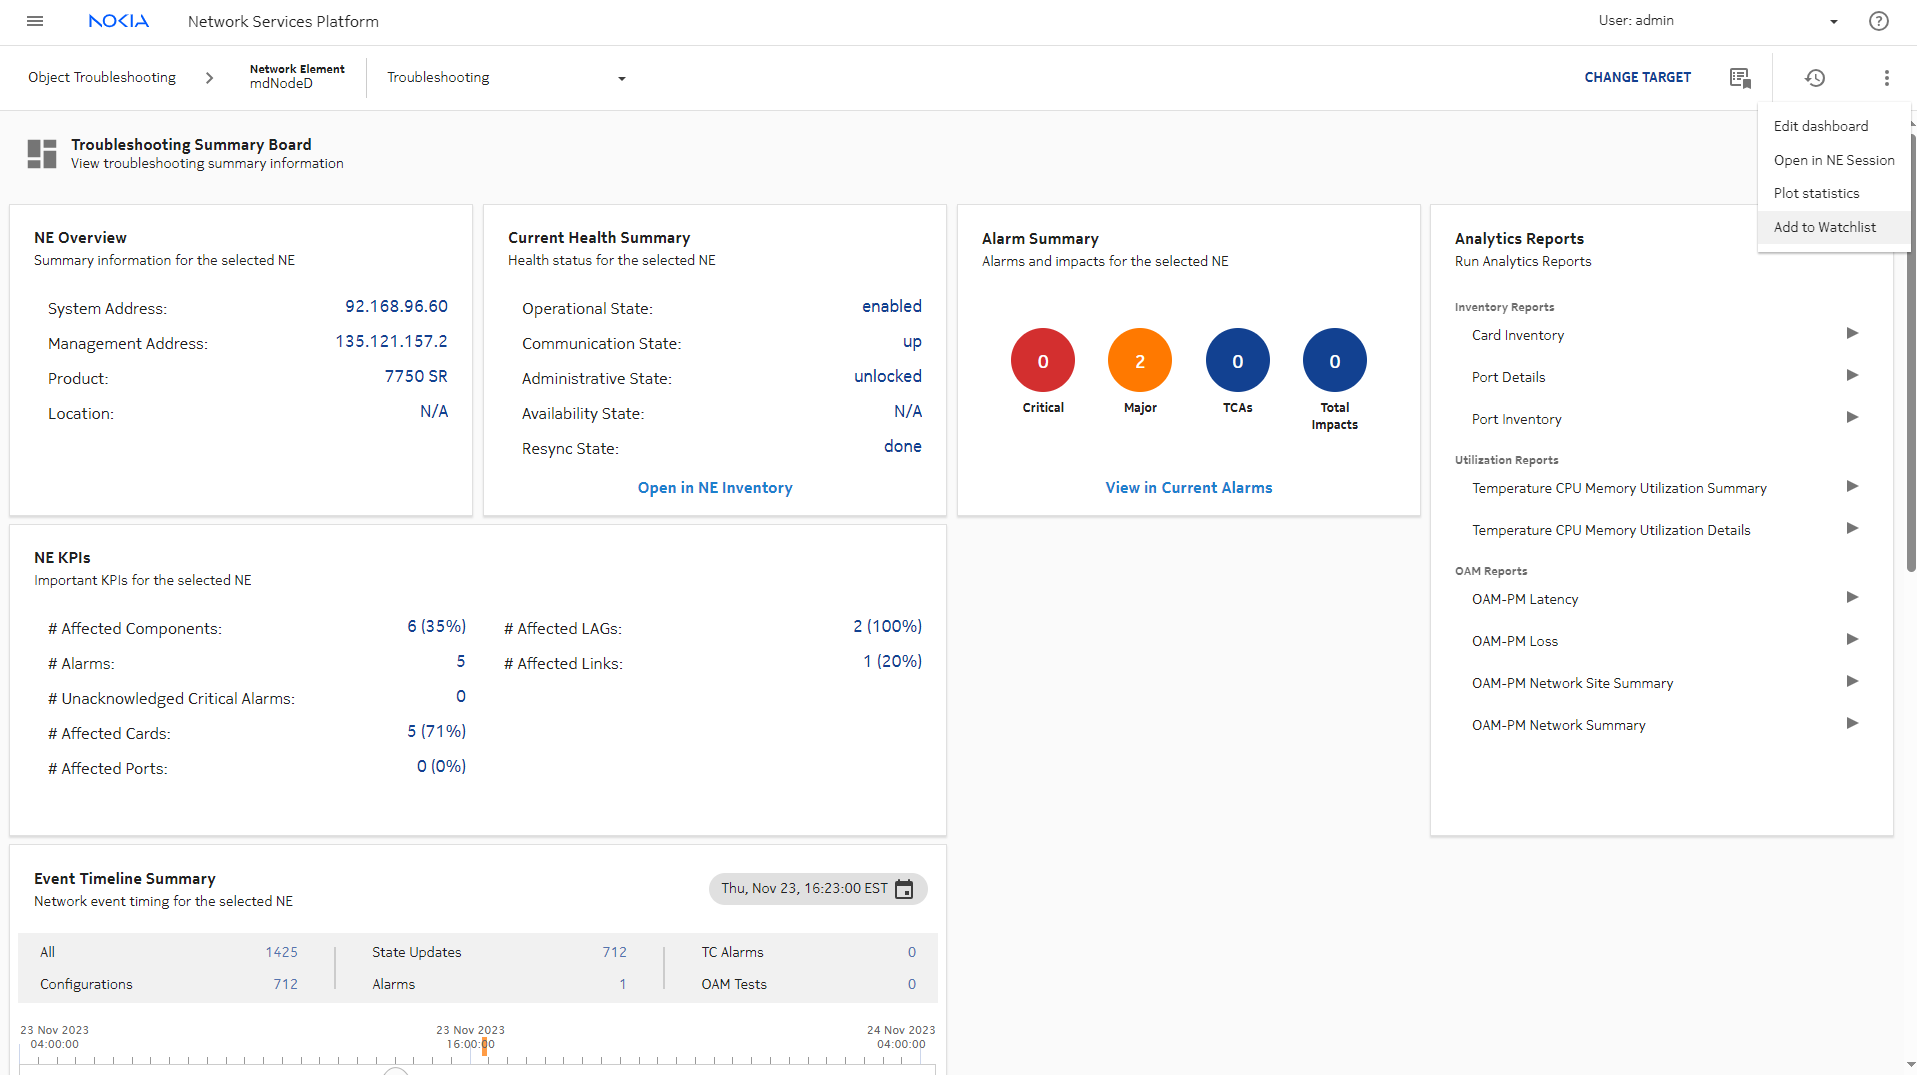
Viewing a target in the Object Troubleshooting dashboard can help you see where to look to investigate a problem. The dashboard shows summary information for the NE, and provides a health and an alarm summary.
From the Object Troubleshooting, we can click View in Current Alarms to view alarms and impacts, or run Analytics Reports.
|
2 |
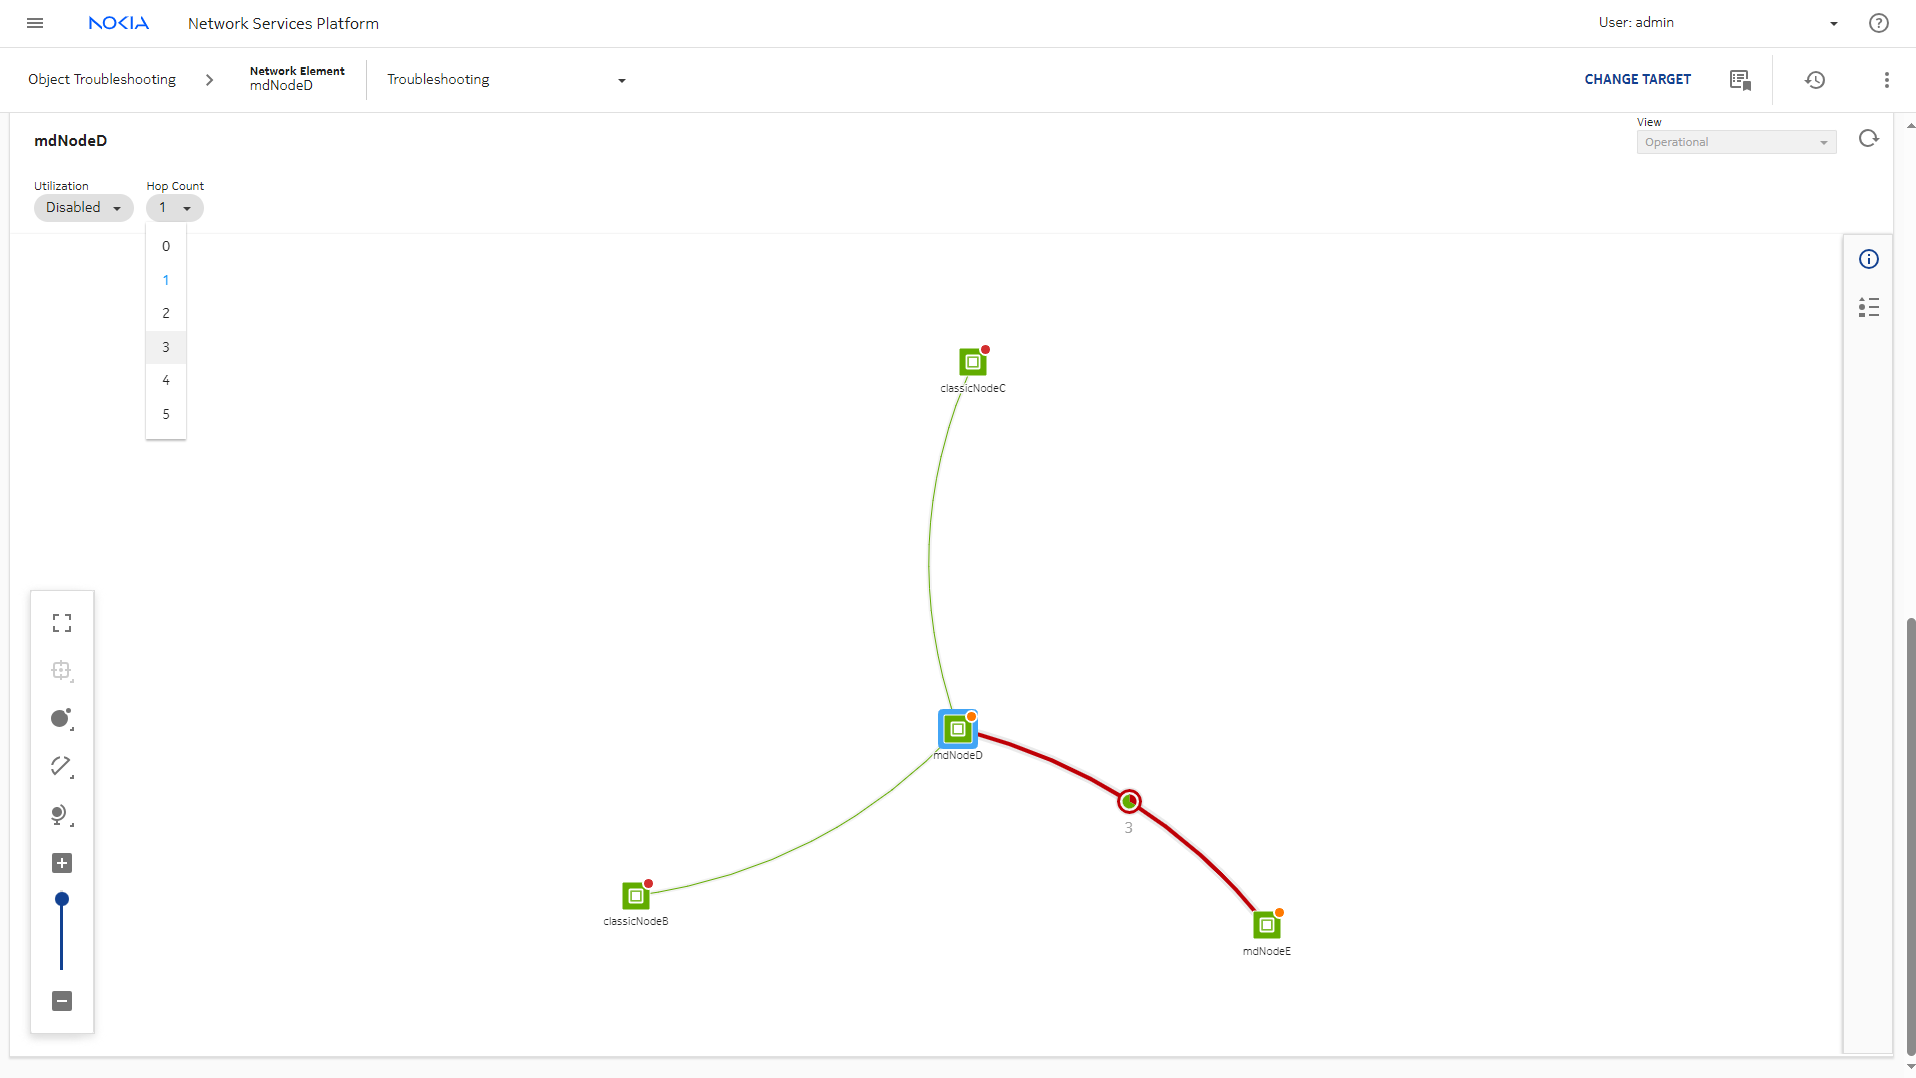
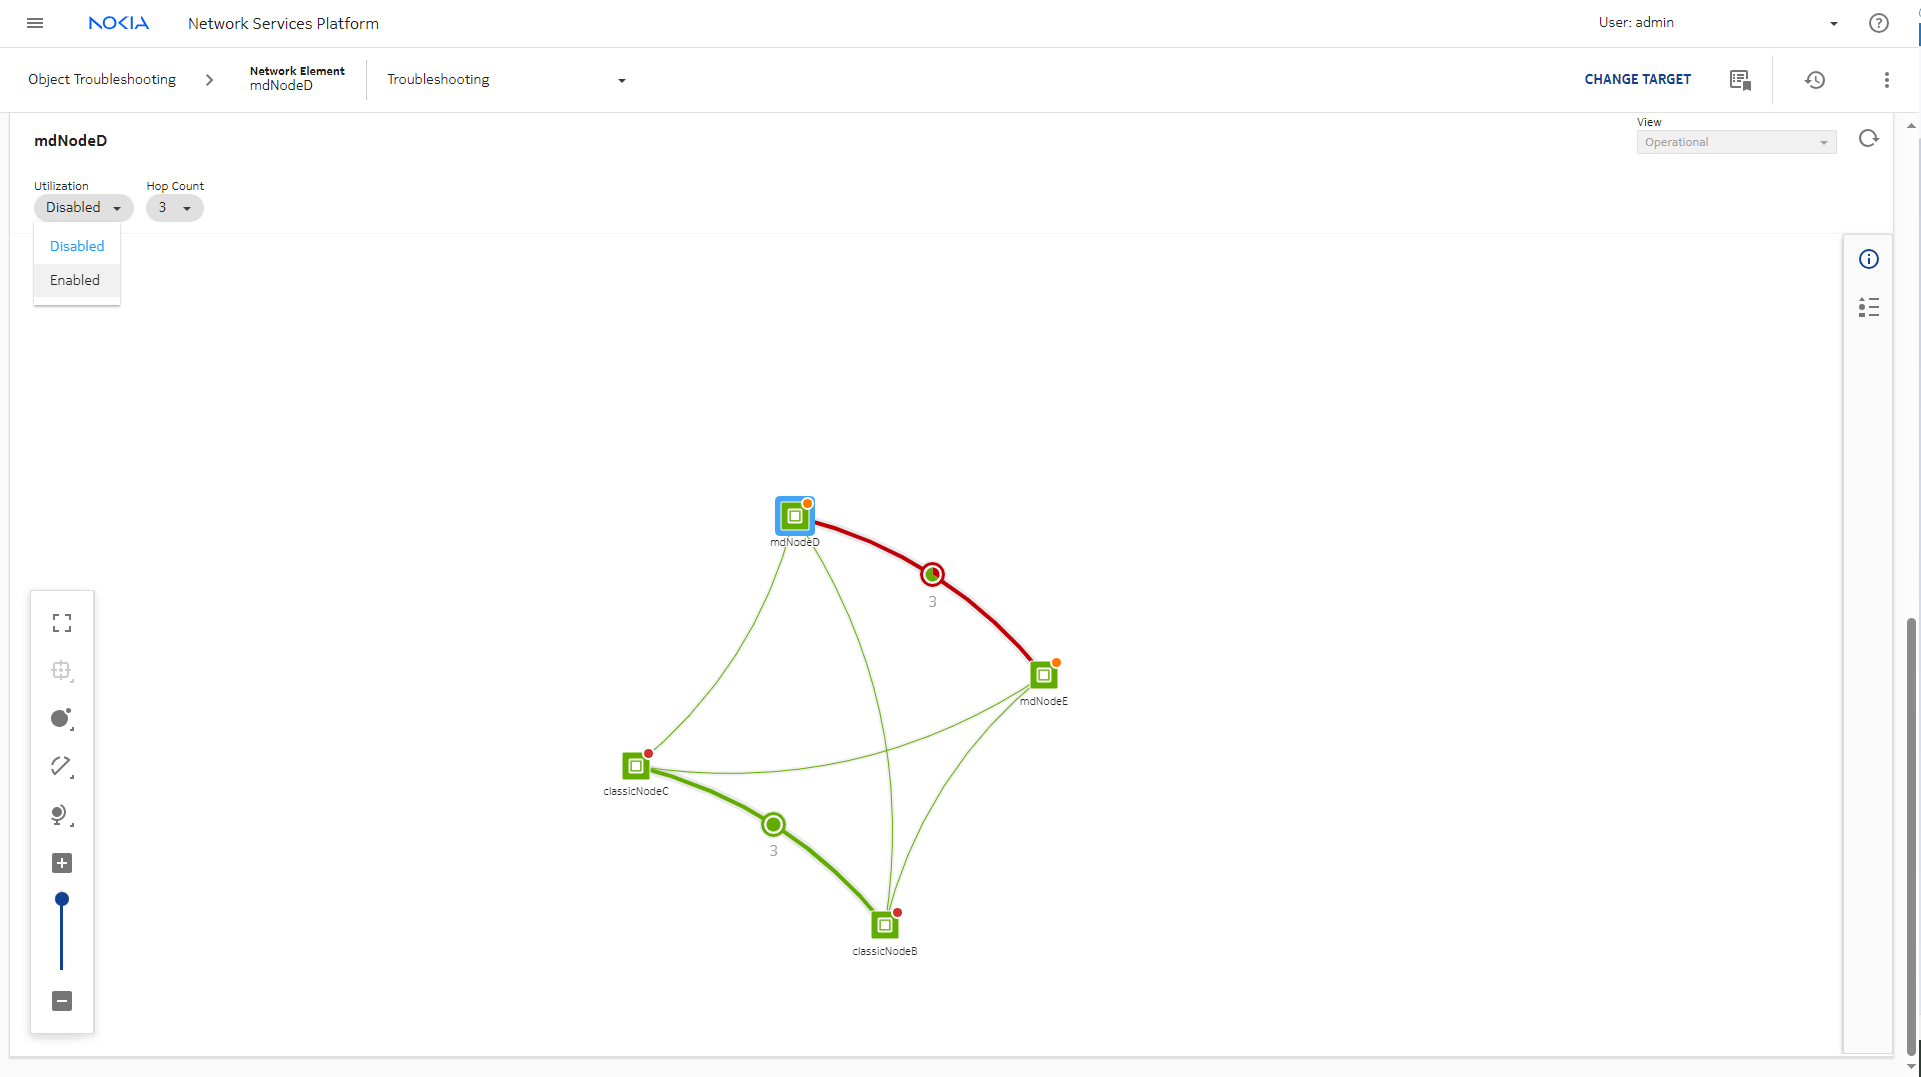
In the Object Troubleshooting map, we can change the Hop Count to see nodes that are further from the target and enable Utilization.
|
3 |
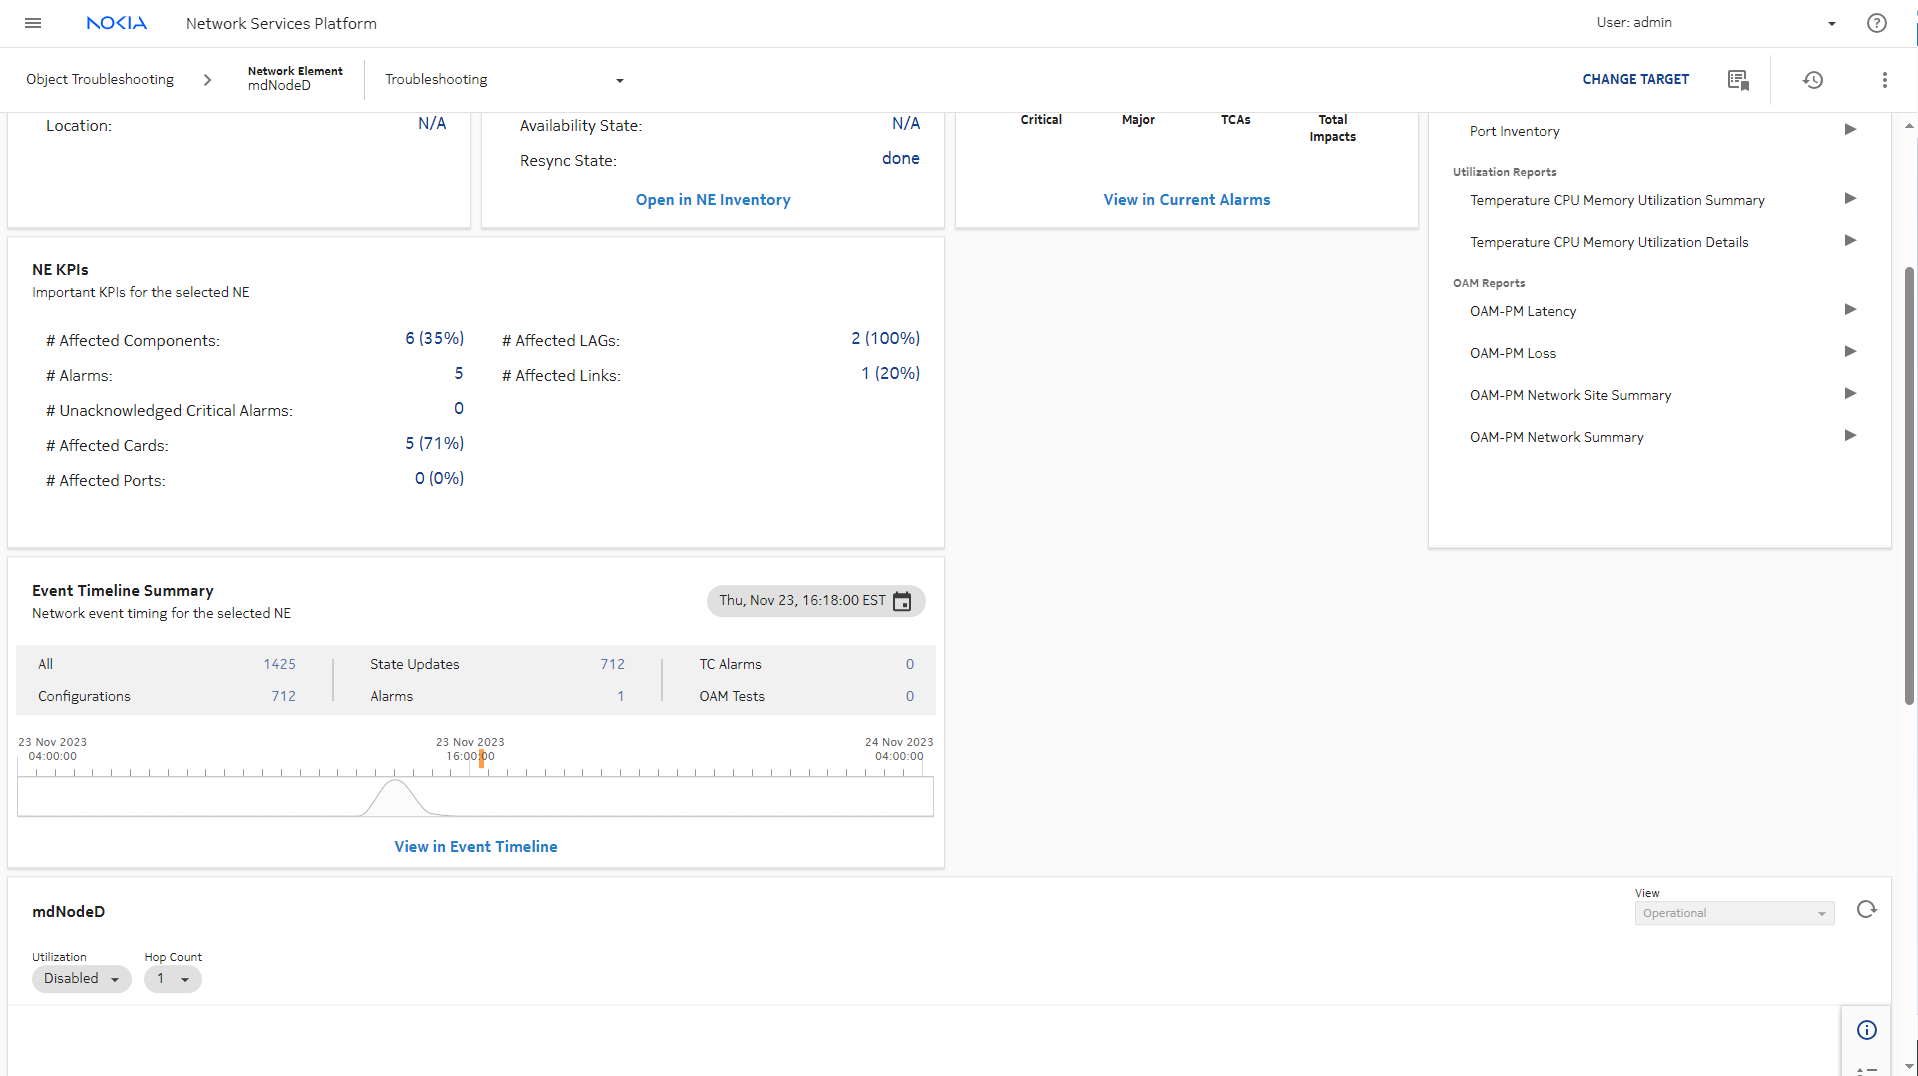
In the Object Troubleshooting dashboard, the Event Timeline dashlet show today’s events summary. Click View in Event Timeline to launch the full view.
|
4 |
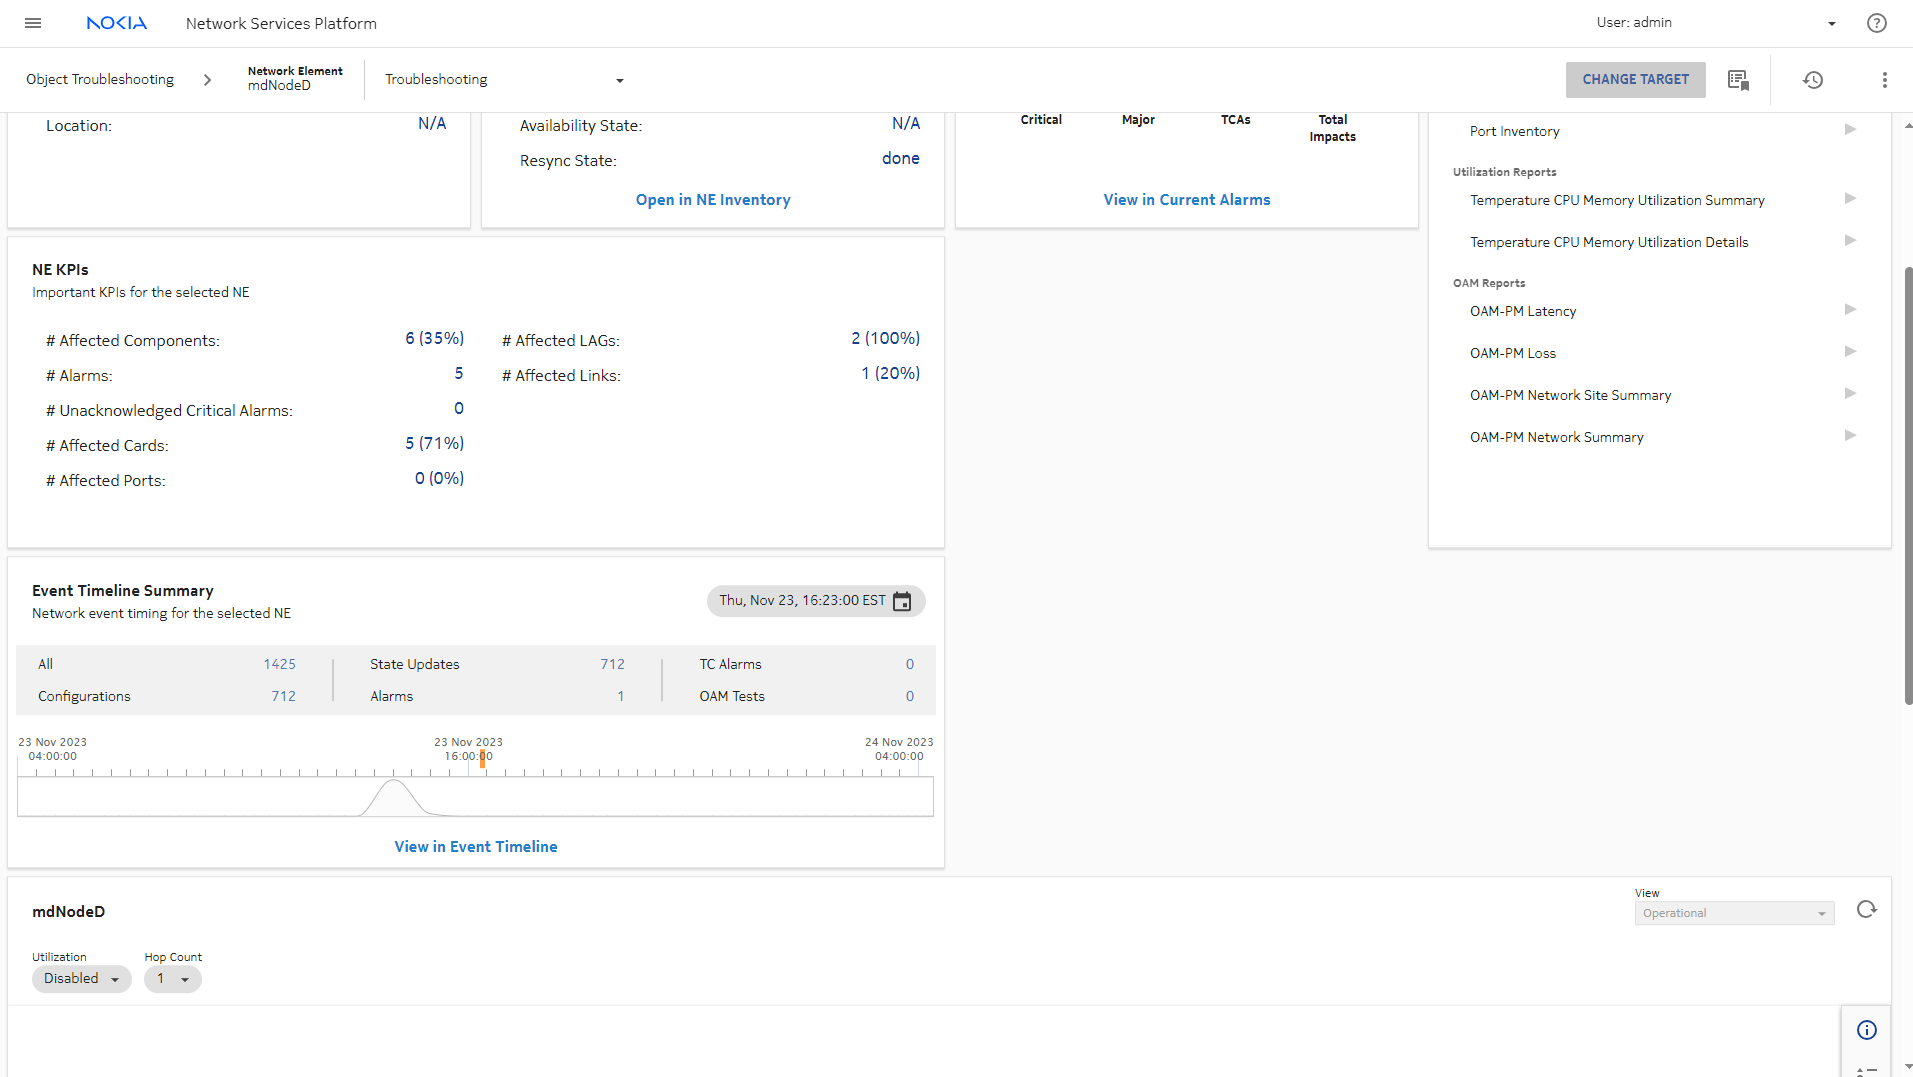
In the Object Troubleshooting dashboard, click CHANGE TARGET to troubleshoot other NEs or other types of objects.
|
5 |
In the Object Troubleshooting dashboard, click Add to Watchlist in the More menu.
Adding the NE to a watchlist will allow you to navigate quickly to the NE in the future. To open the watchlist, click Watchlist ().
|
Check configuration alignment and operation history in the NE Inventory
|
|
1 |
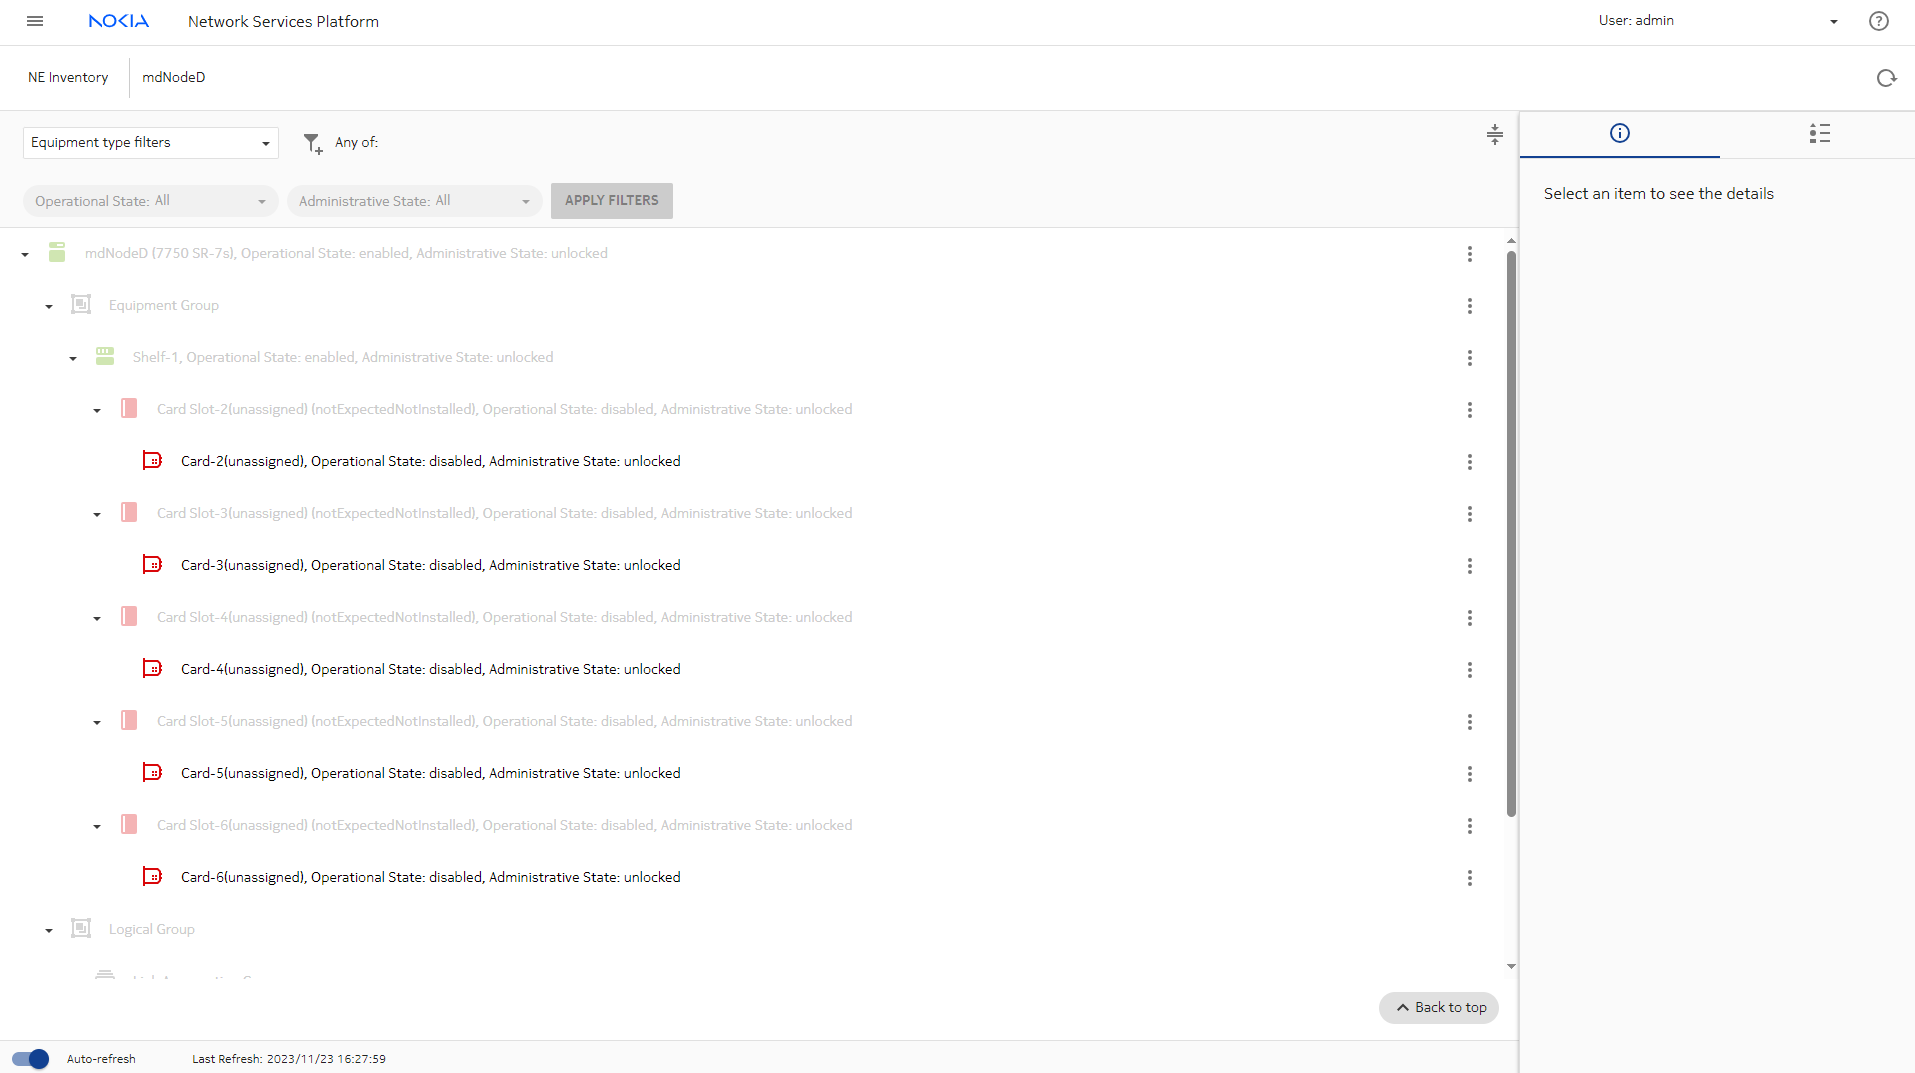
From the Current Health Summary dashlet, click Open in Network Inventory to launch equipment inventory.
|
2 |
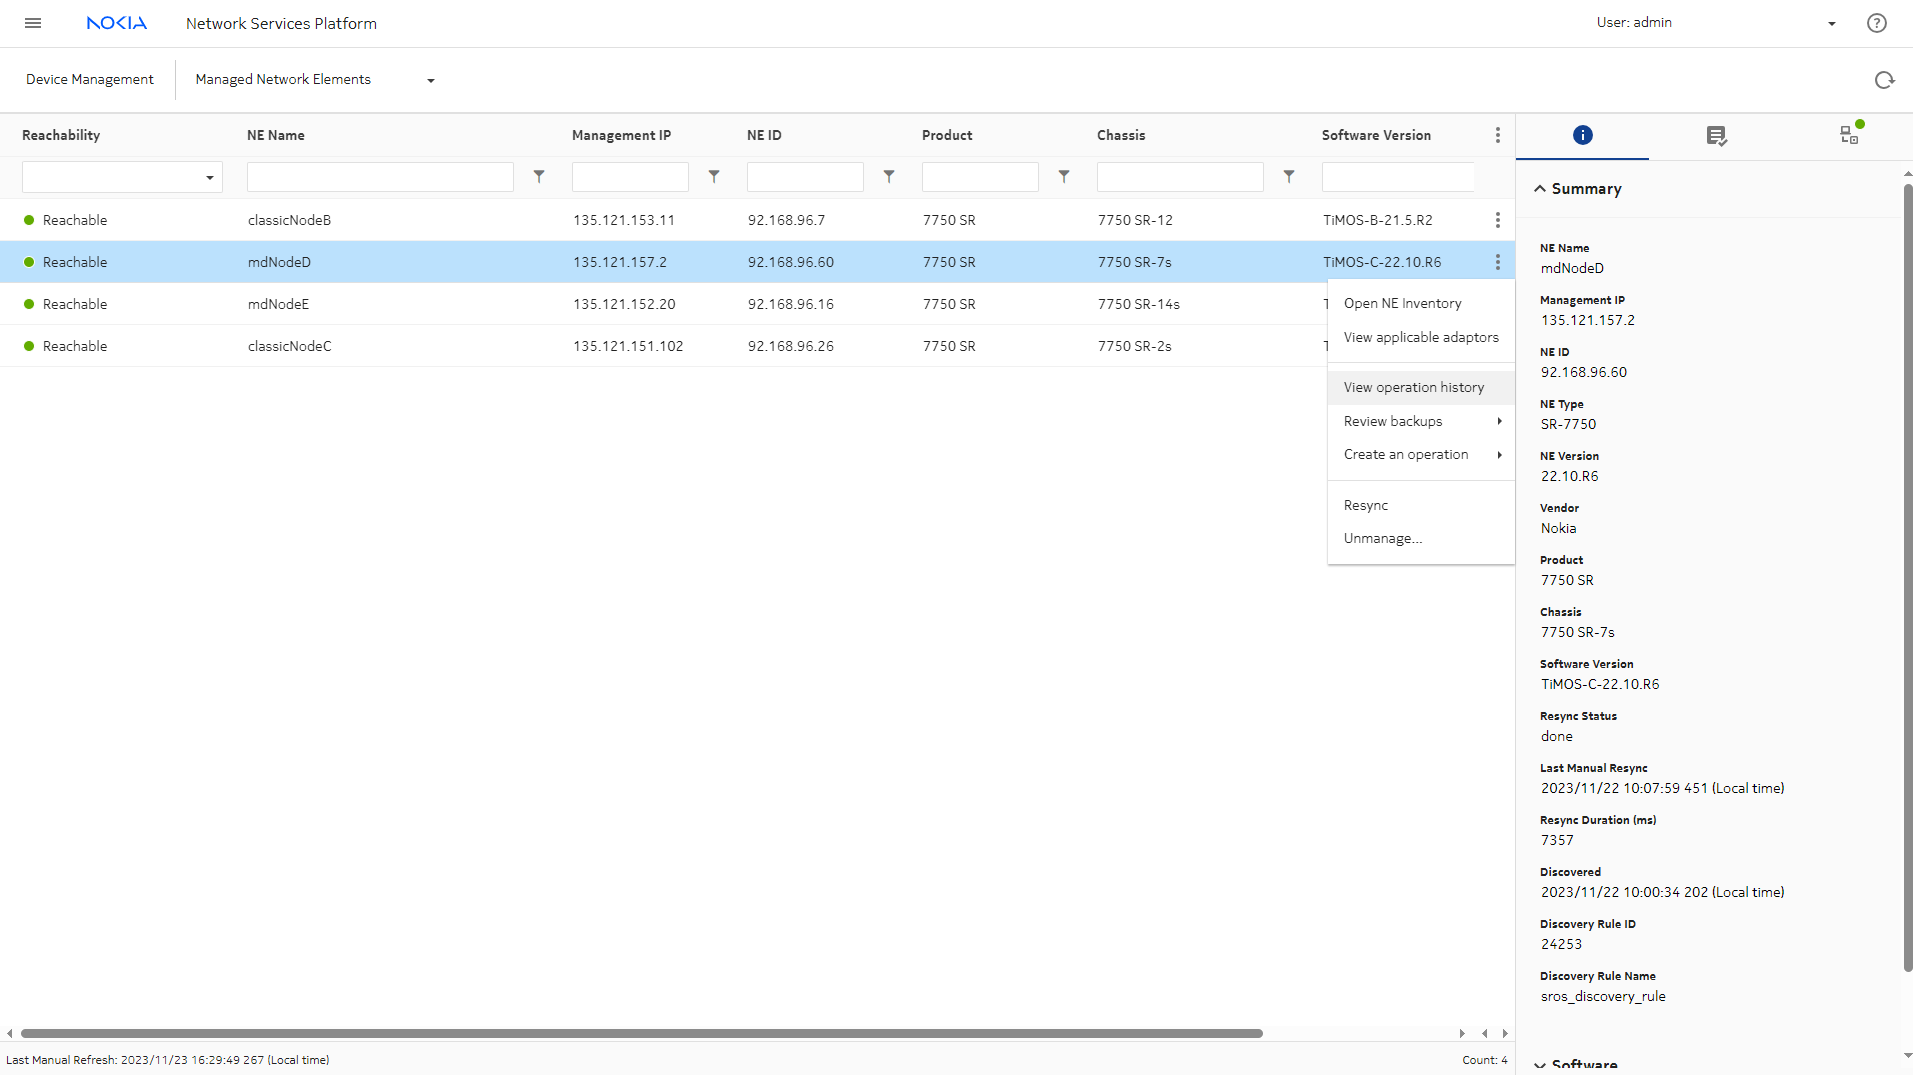
In the Device Management, Managed Network Elements view, select the NE and click (Table row actions), View operation history.
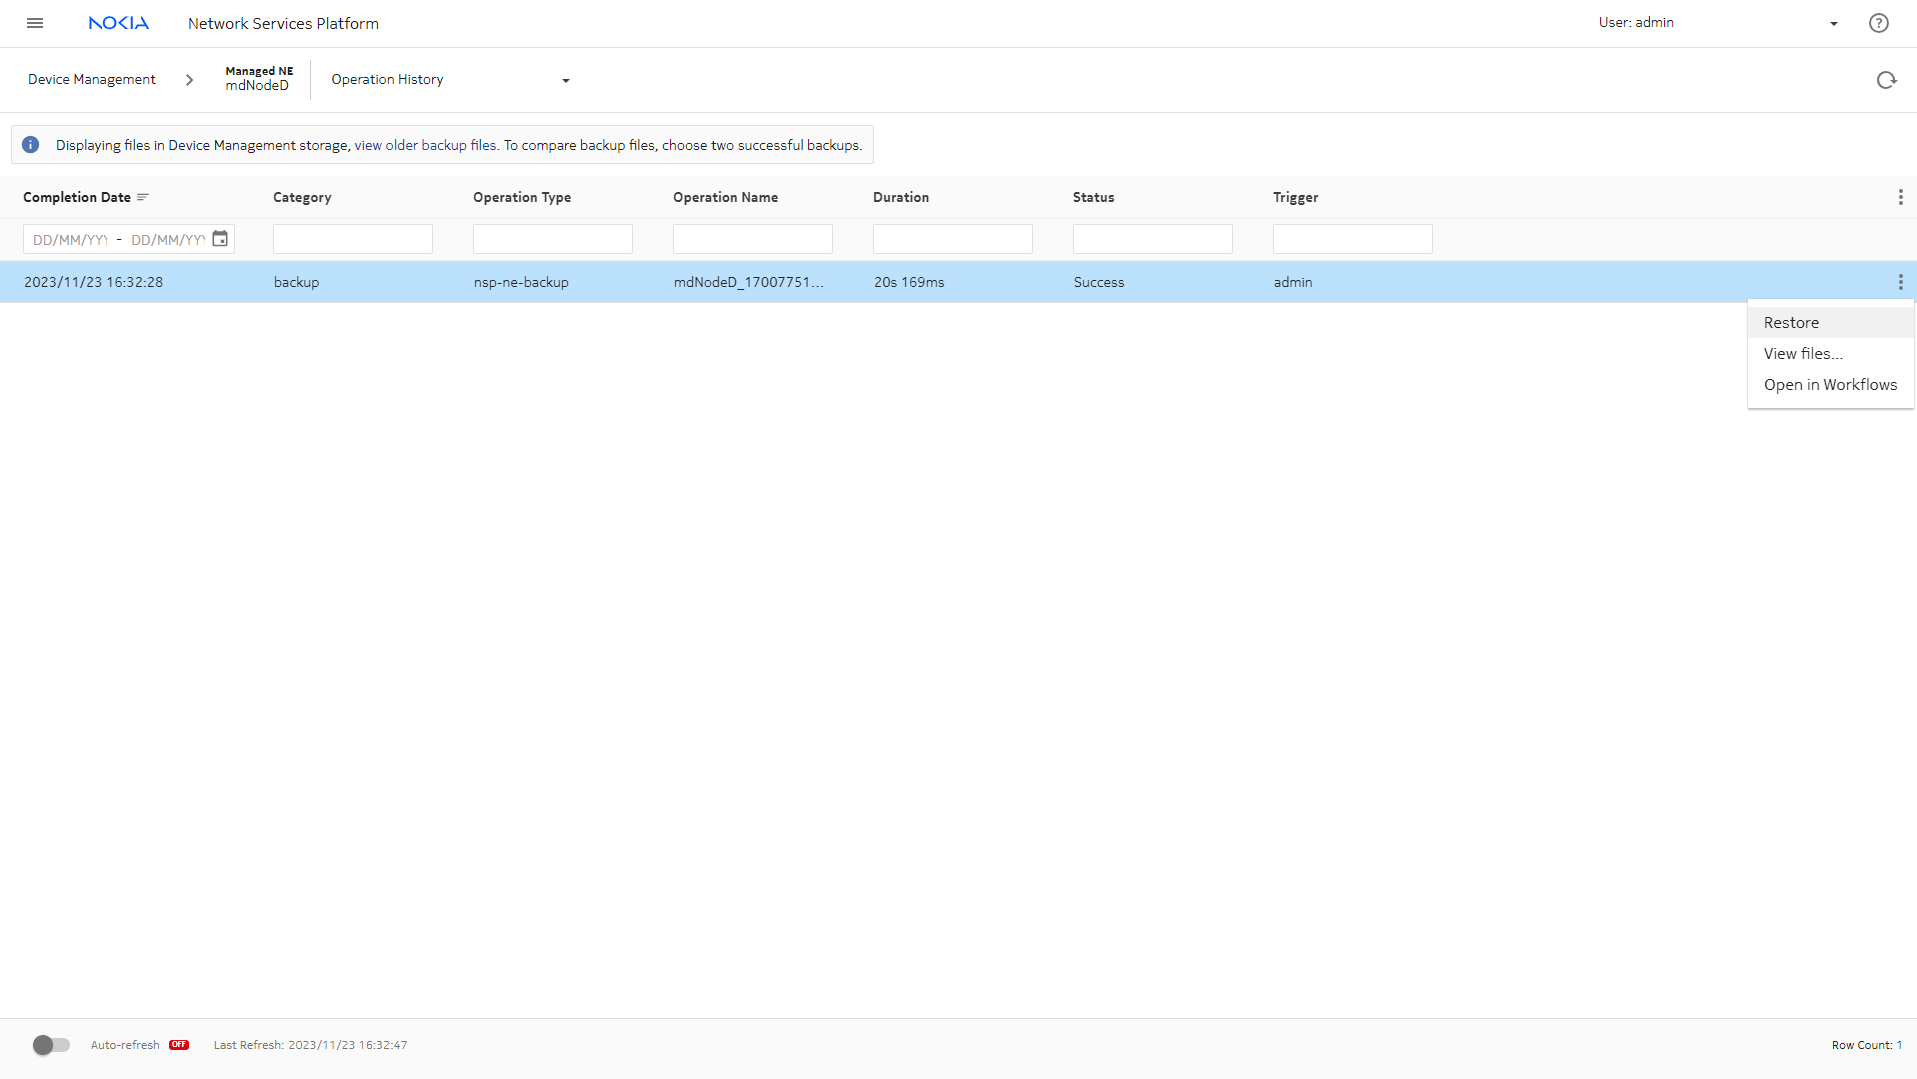
From the history list, we can see when the most recent successful backup was performed, and see if any recent operations have failed.
|
3 |
To restore from a backup, select a successful backup and choose (Table row actions), Restore. The restore operation is launched.
|
4 |
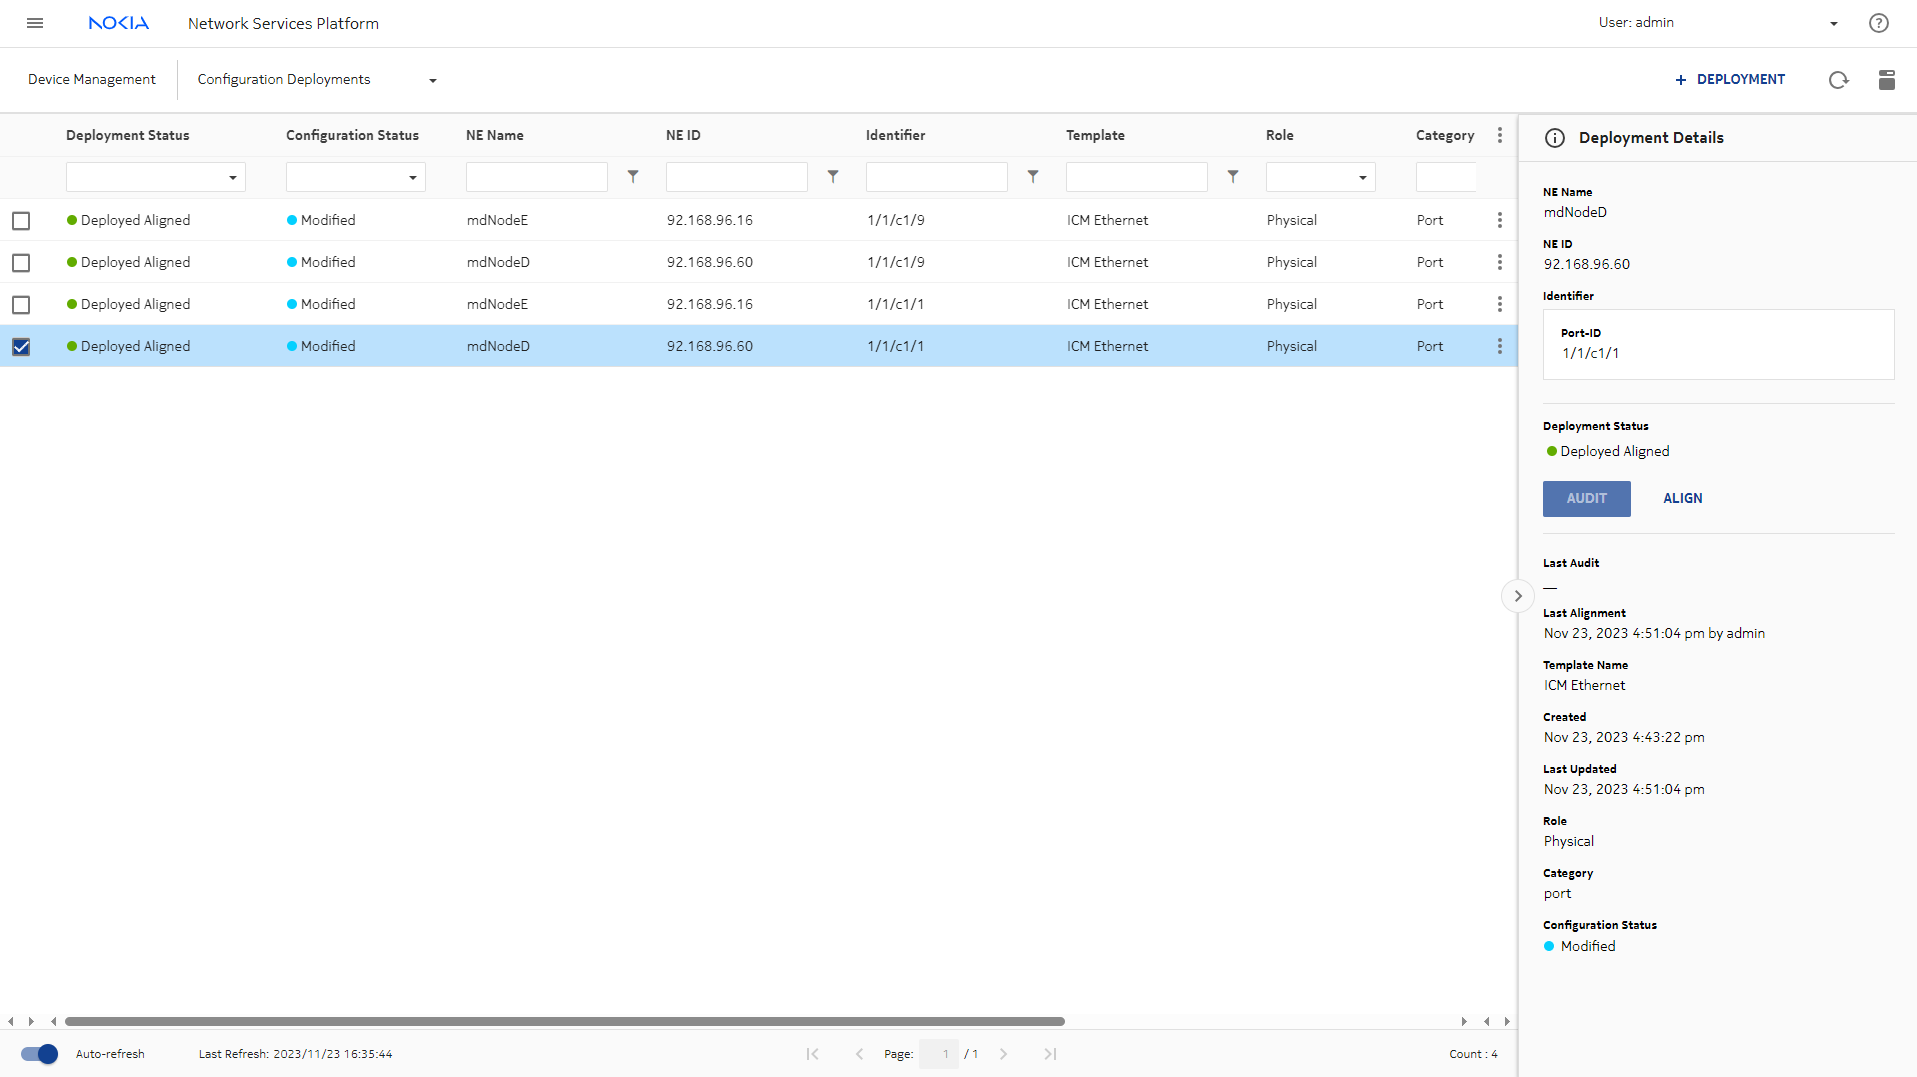
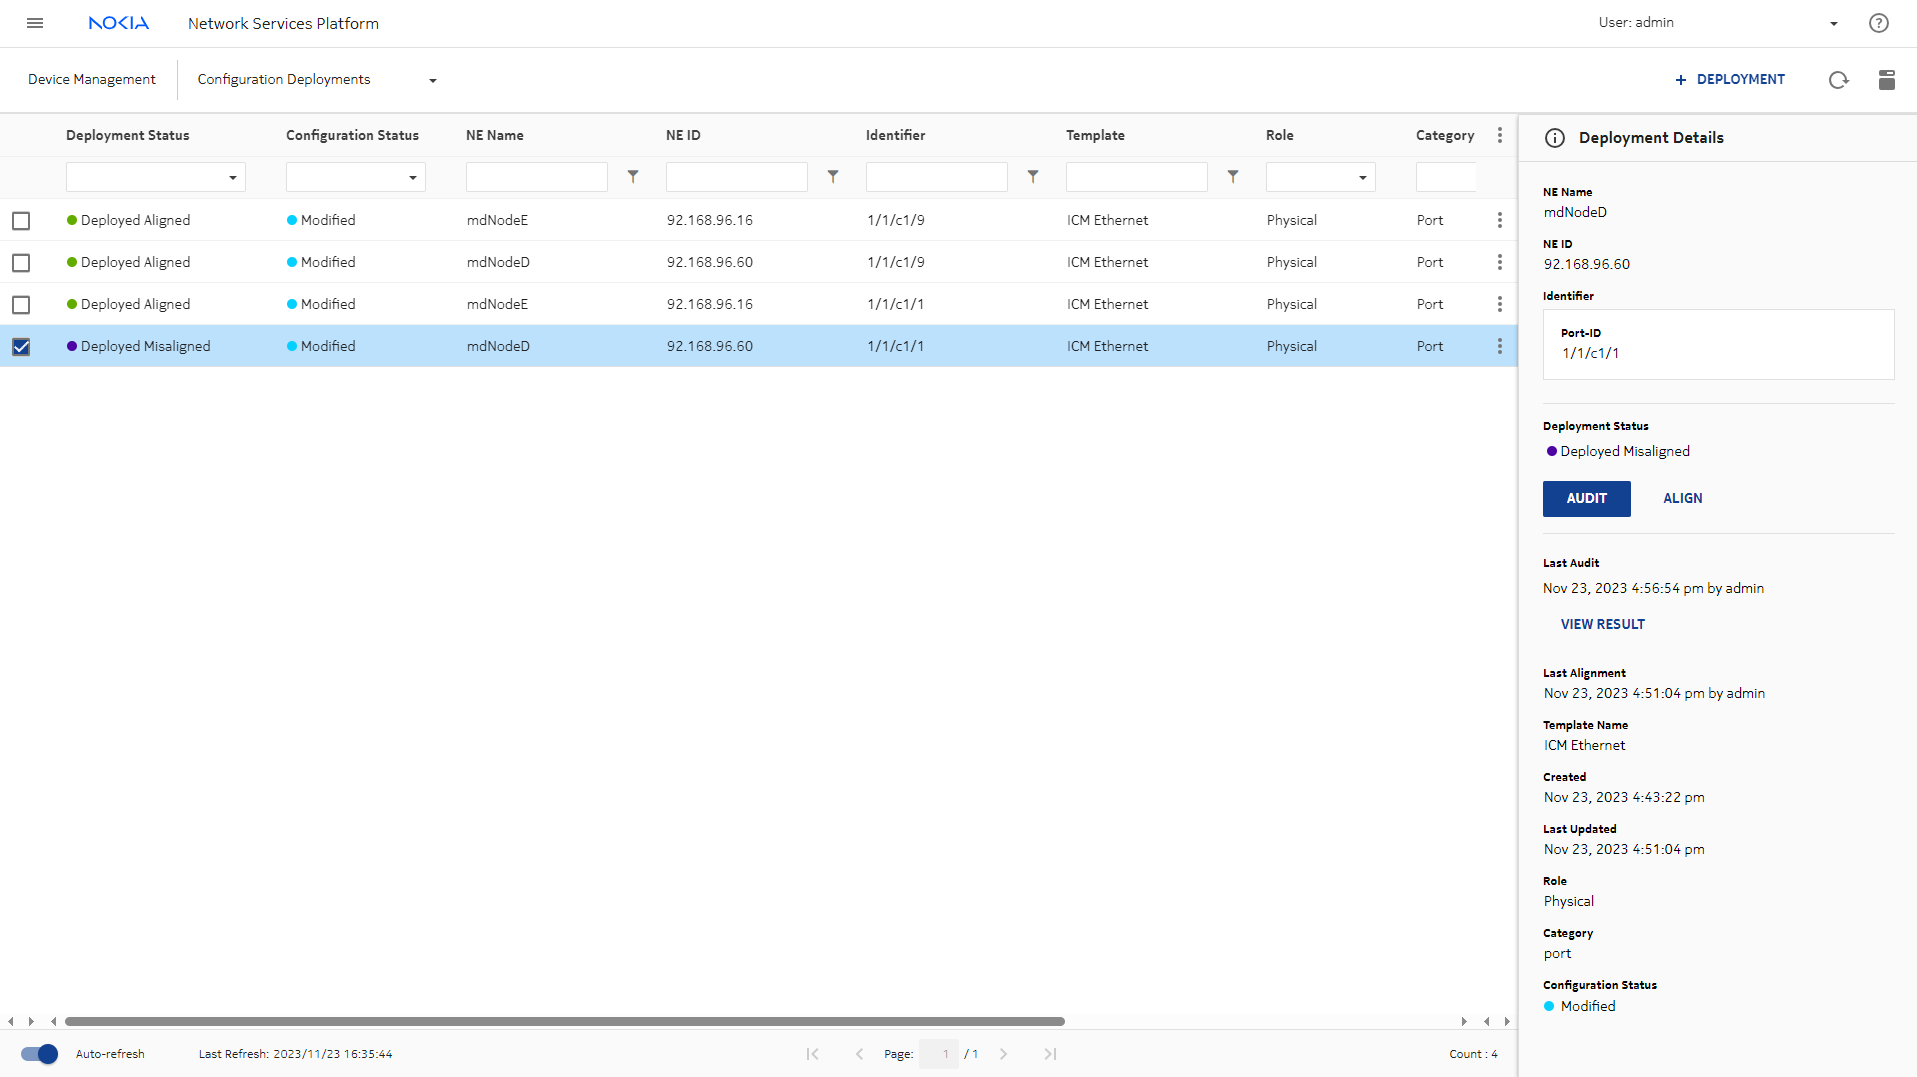
Go to Configuration Deployments view in Device Management and check for misaligned objects on the affected NE by running an AUDIT on deployments related to that NE.
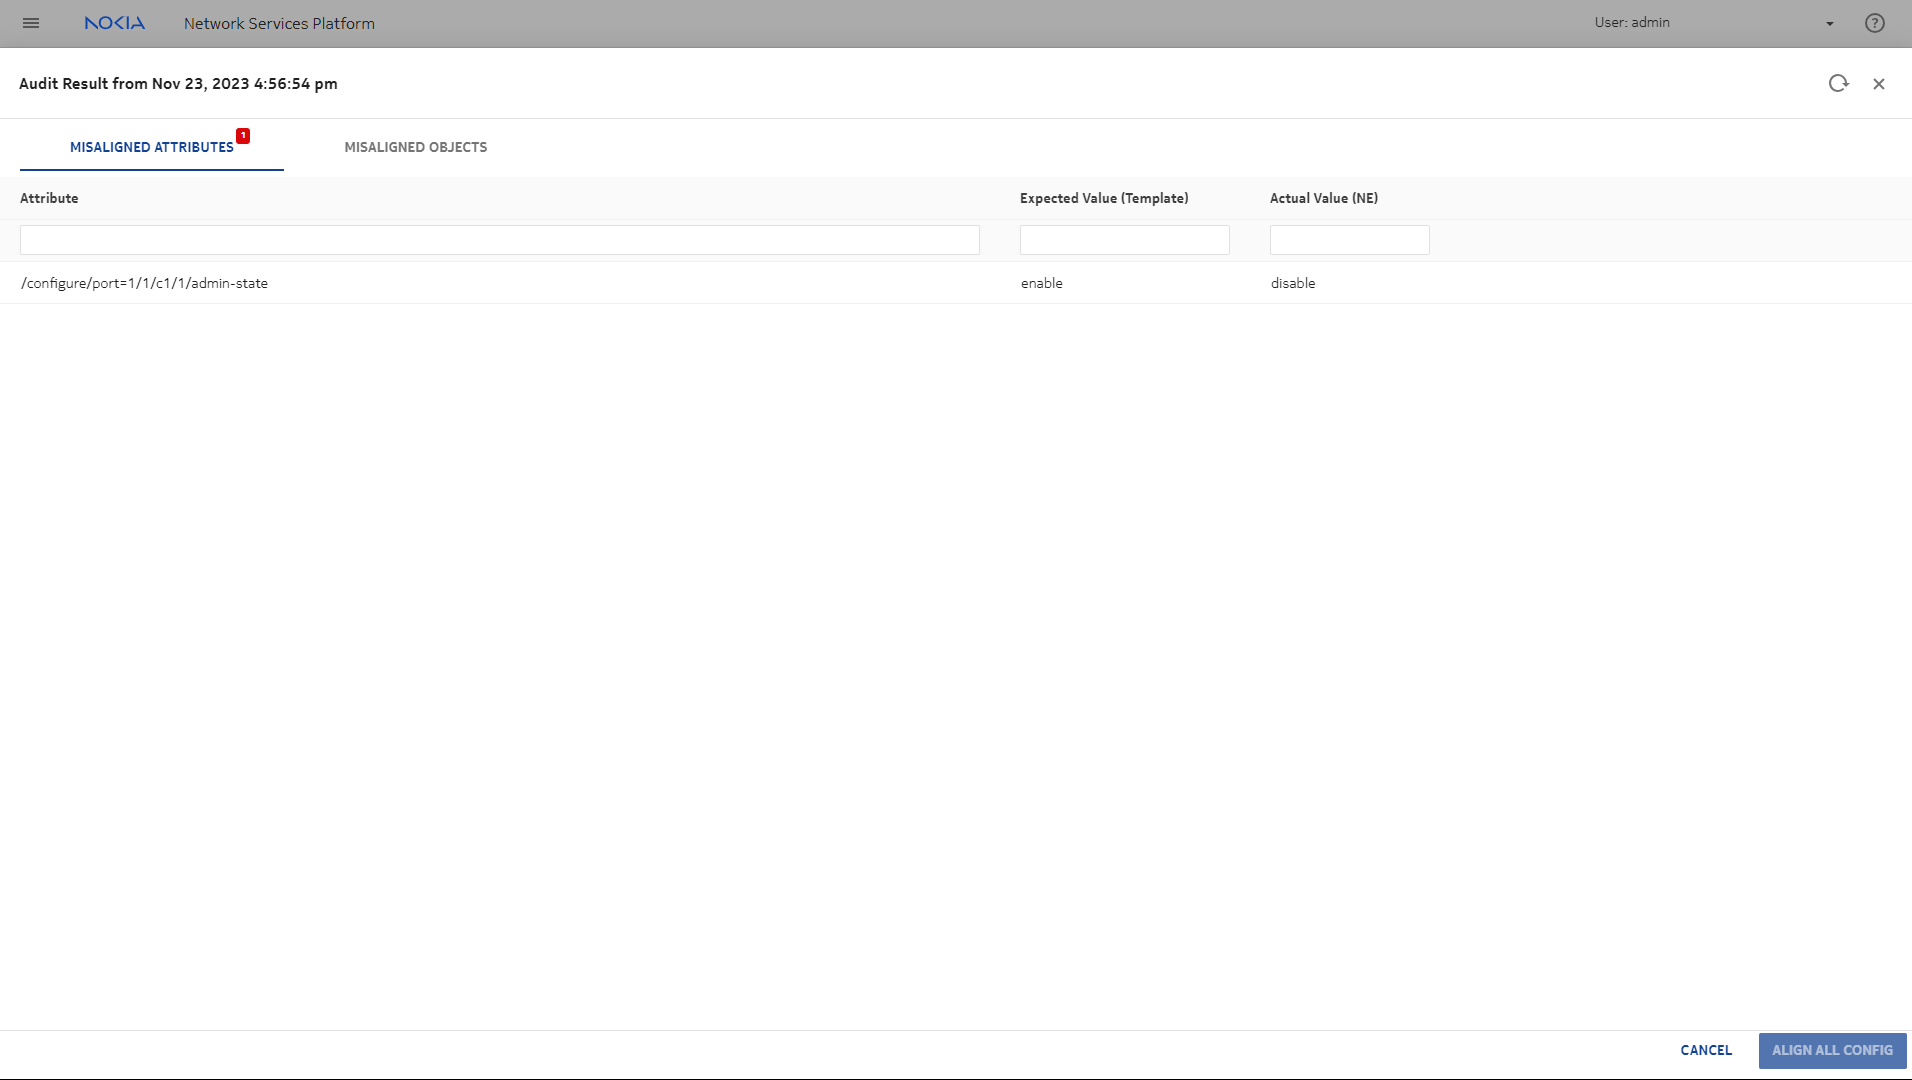
The audit results show the misaligned attributes.
|
5 |
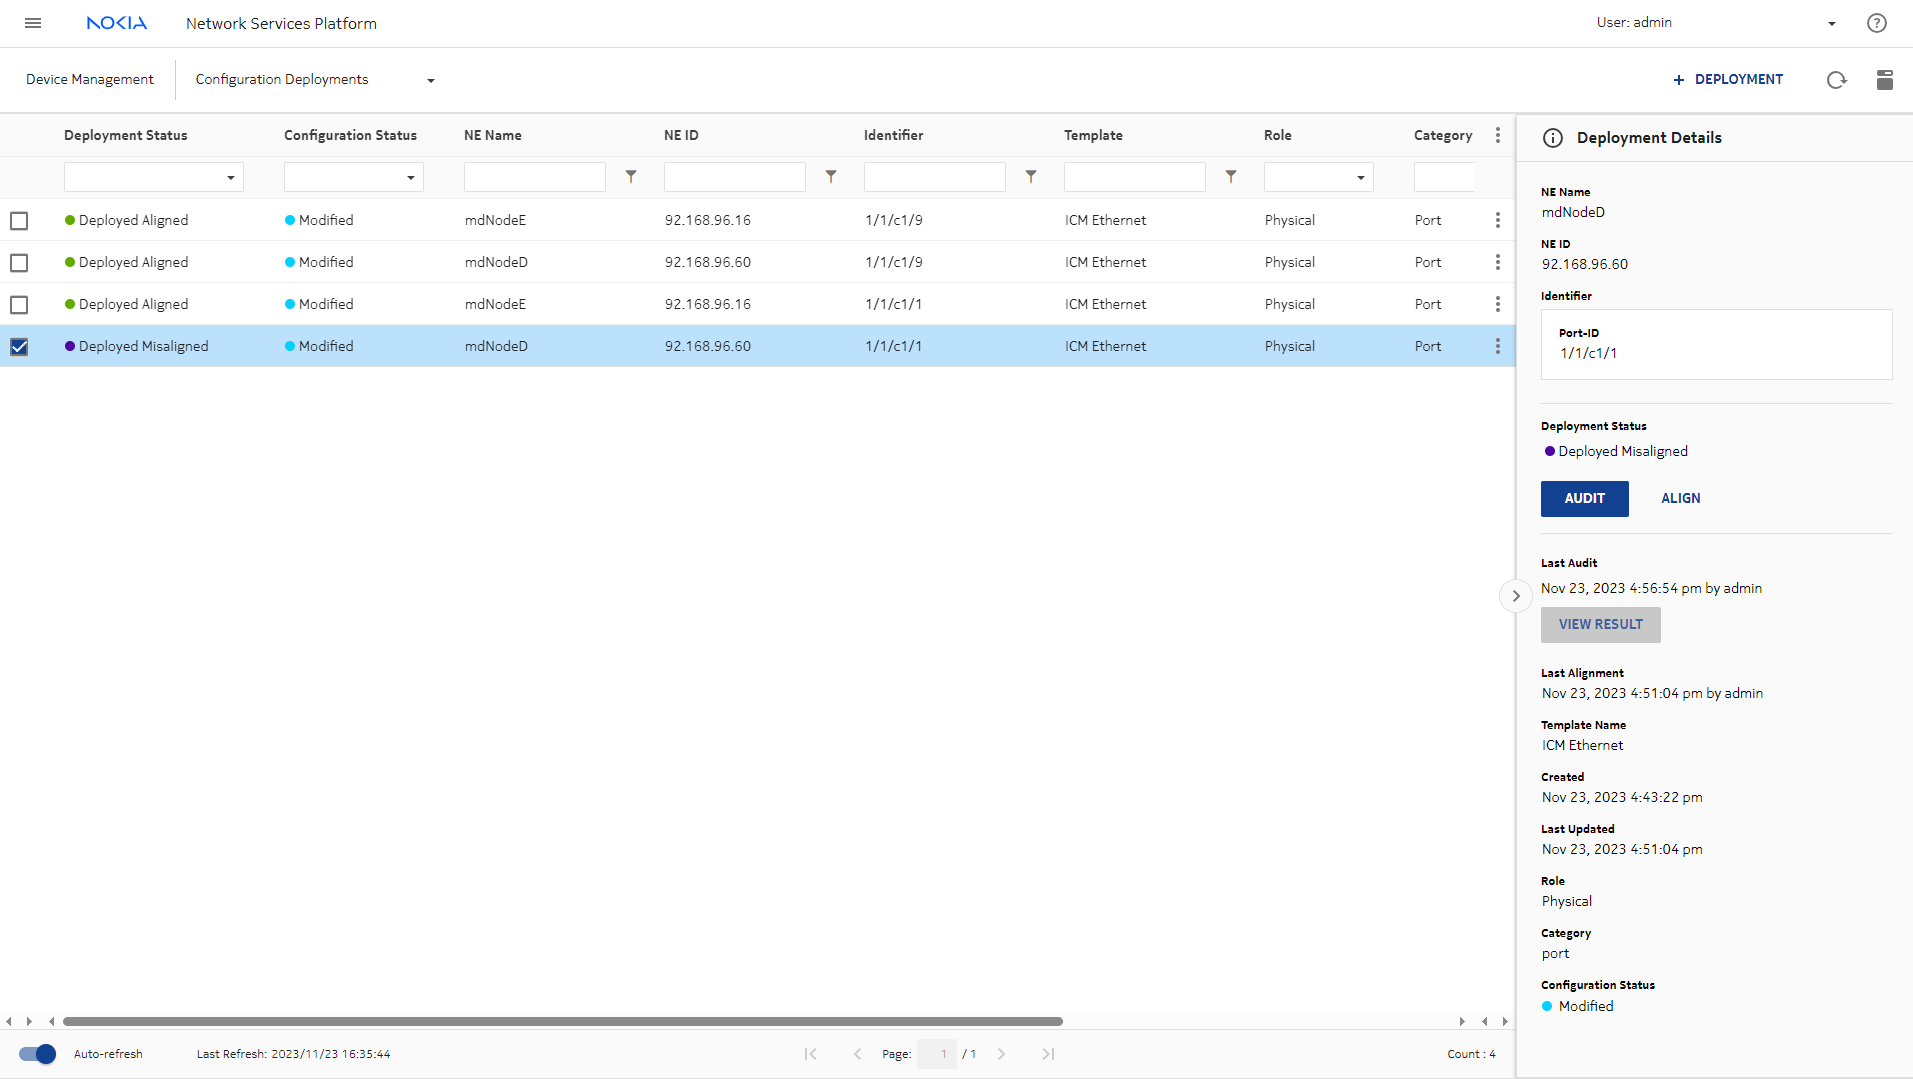
Click VIEW RESULT in the Deployment Details panel.
|
6 |
The results open. Click ALIGN ALL CONFIG to fix the misalignment.
|