What is an indicator?
Definition and purpose
An indicator is a subscription to a customized metric. Indicators allow you to define and track KPIs using a combination of telemetry data, arithmetic operators, and aggregation functions. Indicator functionality is enabled with the Performance Indicators and Alerts installation option.
When you create an indicator, NSP creates an indicator subscription to collect the required data.
Note: Indicator subscriptions and telemetry subscriptions are separate. An indicator cannot be generated from data collected by a telemetry subscription.
On-demand NFM-P statistics cannot be used to create indicators.
Sample indicator
A sample indicator will be referenced throughout this chapter to demonstrate how users can configure and utilize an indicator.
This sample indicator will be configured to track the average utilization of a three-node ring, sampling from four ports and a LAG in the ring. Alarms will be set to generate if the average utilization is increasing above 50% or decreasing below 5%.
Figure 5-1, Sample indicator in the Indicators view shows the sample indicator in the Data Collection and Analysis Management, Indicators view.
Figure 5-1: Sample indicator in the Indicators view
Indicator components
An indicator consists of the following components:
The components appear in the Create and Edit forms.
General parameters
An indicator is defined, in part, through the configuration of the following general parameters:
-
For NEs managed by MDM, this represents the interval for collecting the statistics (for example, every 30 s), while for NEs managed by the NFM-P, this value is ignored and statistics are collected according to the settings configured in the NFM-P.
-
Window duration is the size of the data bucket for telemetry calculation.
Note: For simple indicators, that is, indicators with only one counter and no formula, there is no data bucket. The window duration is ignored; KPI values are calculated at the collection interval.
Counters & Formula parameters
As you proceed through indicator creation, more parameters become available on the UI. The Counters & Formula parameters of an indicator declare the telemetry values to be collected and the operations and aggregation functions to apply. An object filter ensures that the data is collected on the resources of interest.
Counters
After you select a telemetry type, the ![]() ADD COUNTERS button becomes available, allowing you to select the specific counters to include.
ADD COUNTERS button becomes available, allowing you to select the specific counters to include.
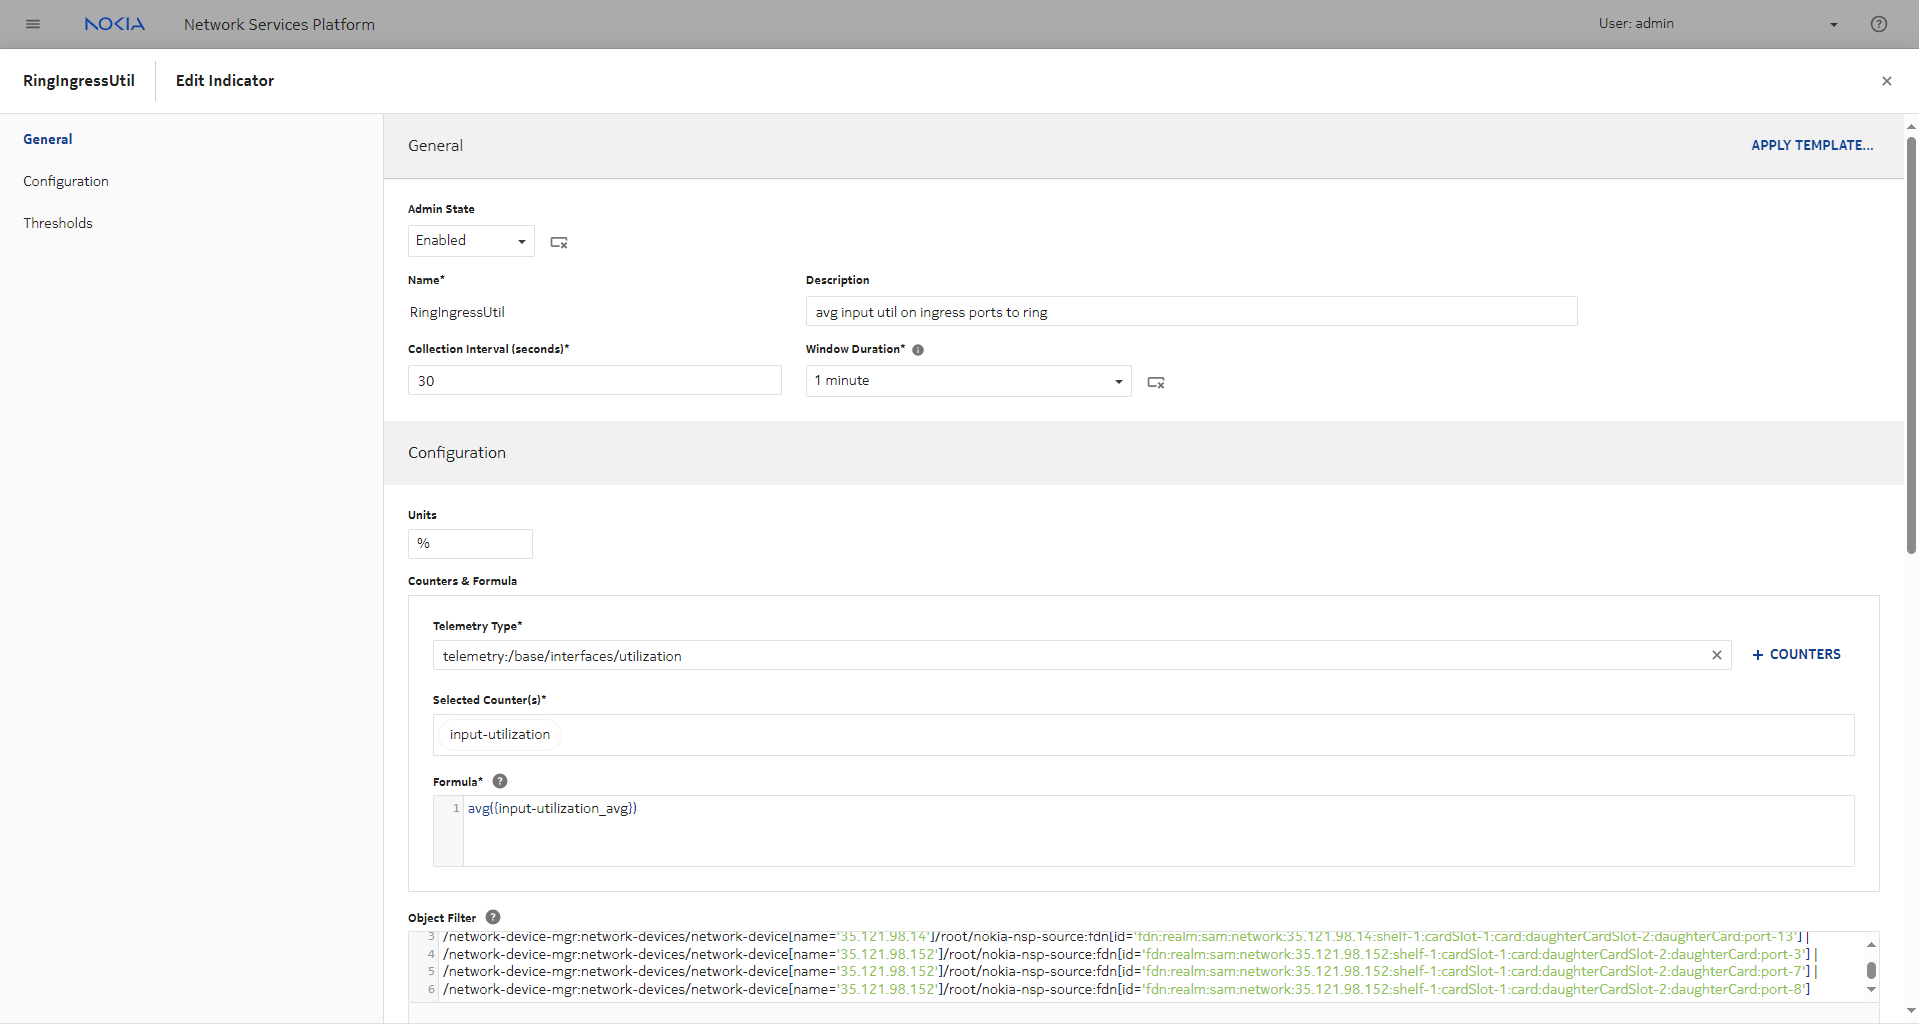
For the sample indicator, selecting the /telemetry:base/interfaces/utilization telemetry type allows for the collection of the input-utilization counter; see Figure 5-2, Sample Indicator General parameters.
Figure 5-2: Sample Indicator General parameters
Formula
An indicator formula defines the calculation of a KPI value. A formula is optional if only one counter is configured.
You can select a formula to apply operations and functions to the counters. Formulas are composed of the following components:
For the sample indicator, the formula is configured to provide an average of the counter value data, see Figure 5-2, Sample Indicator General parameters.
Formulas can also combine these components as needed.
For example, a formula can combine the components: max(({transmitted-octets-periodic_sum}+{received-octets-periodic_sum})*8/60)/sum({speed_avg})*100. This formula creates a single mixed-expression-operator that has two aggregation operations: the first outputs the port with the maximum value of ((tx+rx)*8/60), the second sums the speed of all ports. These two outputs are then divided and the result is multiplied by 100.
Object filter
You can configure an object filter as needed to define a subset of available resources to which the indicator shall apply; see How do object filters work?.
When at least one counter has been selected, the VERIFY RESOURCES button becomes available. Check the contents of the resource list to ensure that your object filter is retrieving the correct objects.
For the sample indicator, the object filter determines the ports and LAGs to collect information from, see Figure 5-2, Sample Indicator General parameters.
Thresholds
Thresholds define the preferred range of data values for the indicator. Thresholds are optional; you can create zero, one, or multiple thresholds, for increasing or decreasing values.
When you configure thresholds for an indicator, you can also define the actions to be triggered by threshold violations.
When the indicator is plotted in Visualizations, thresholds appear on the plot and threshold crossing events are indicated.
A threshold crossing event (TCE) occurs when the data range for a defined threshold is violated; that is, a value is outside the preferred range for the indicator.
Each threshold can be configured to trigger one or more actions if a TCE is detected:
-
raise a threshold crossing alarm (TCA)
The TCA is raised in Current Alarms.
Note: Alarms related to indicators might still be raised shortly after a resource (for example, an NE) is unmanaged in NSP if statistics messages are already in the system waiting to be processed.
-
An email can be generated for each threshold crossing event or aggregated by time period or number of events.
Email server settings must be configured in NSP Settings by an administrator.
-
output a message to a Kafka topic
The Kafka topic must already be created. The default topic is nsp-act-action-event.
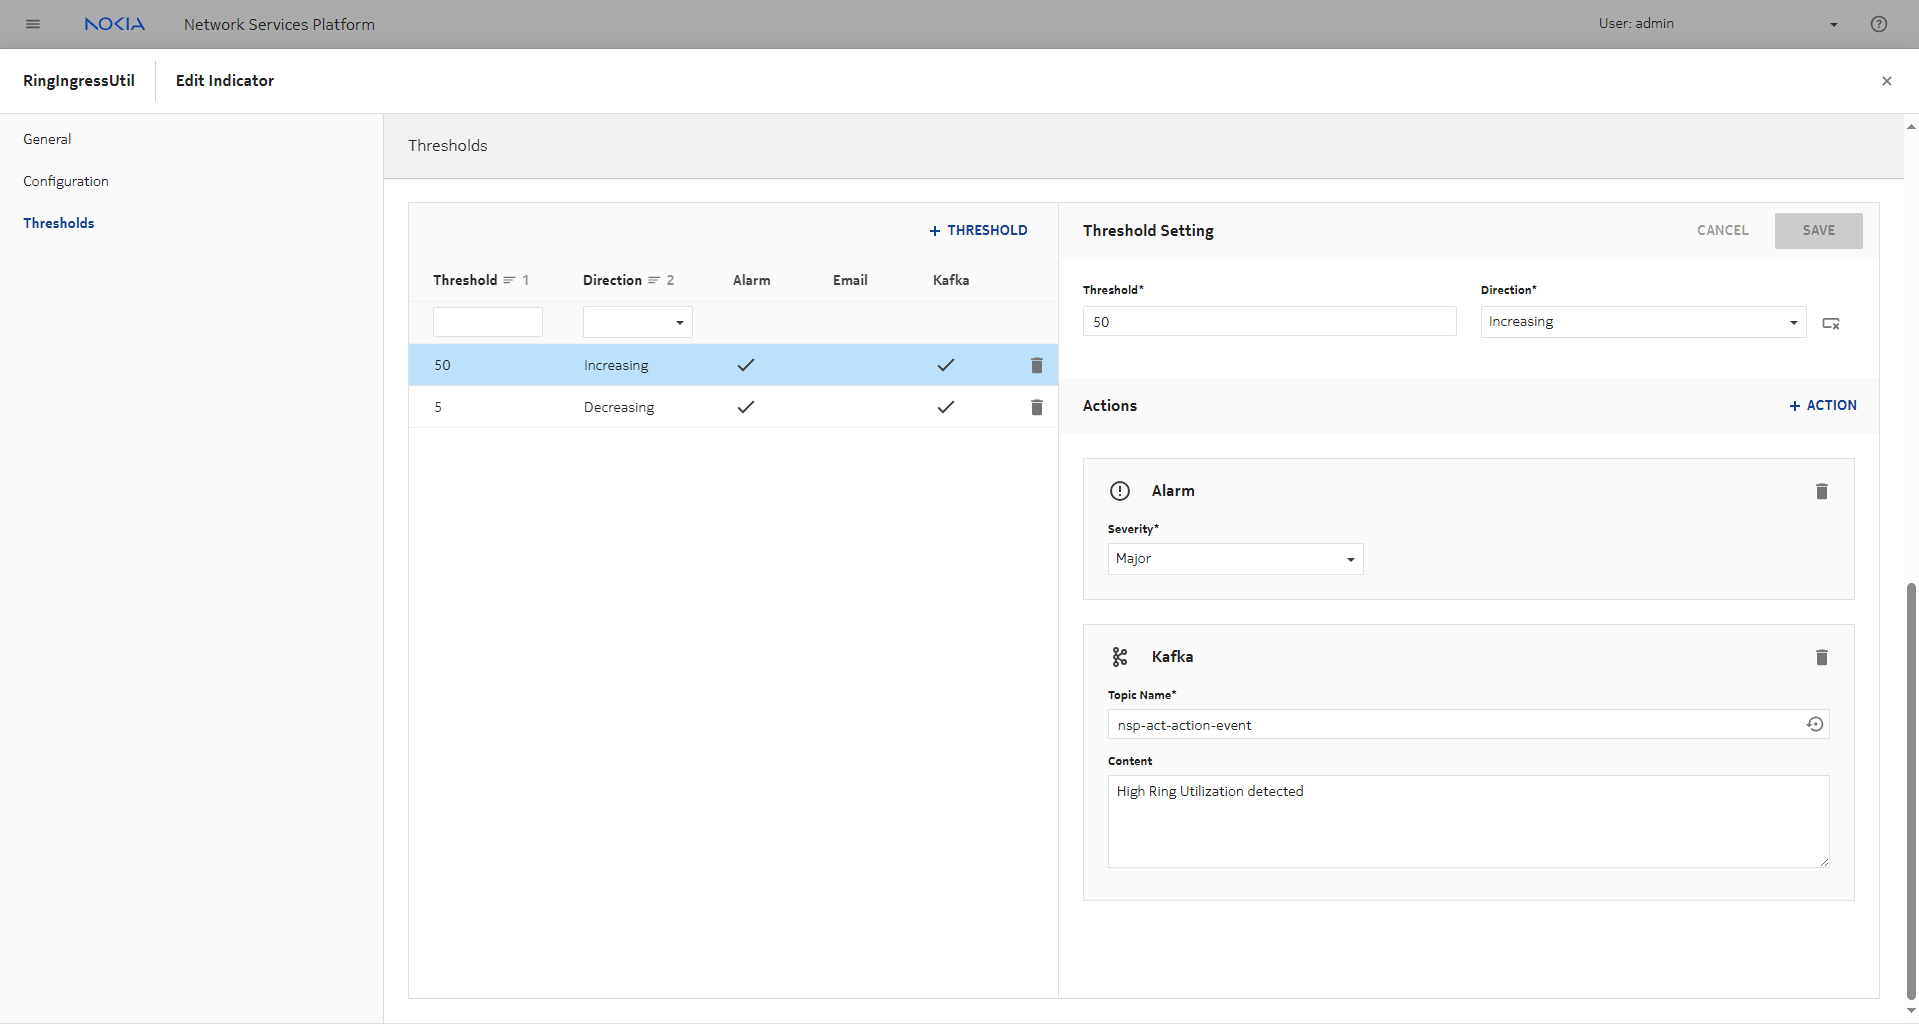
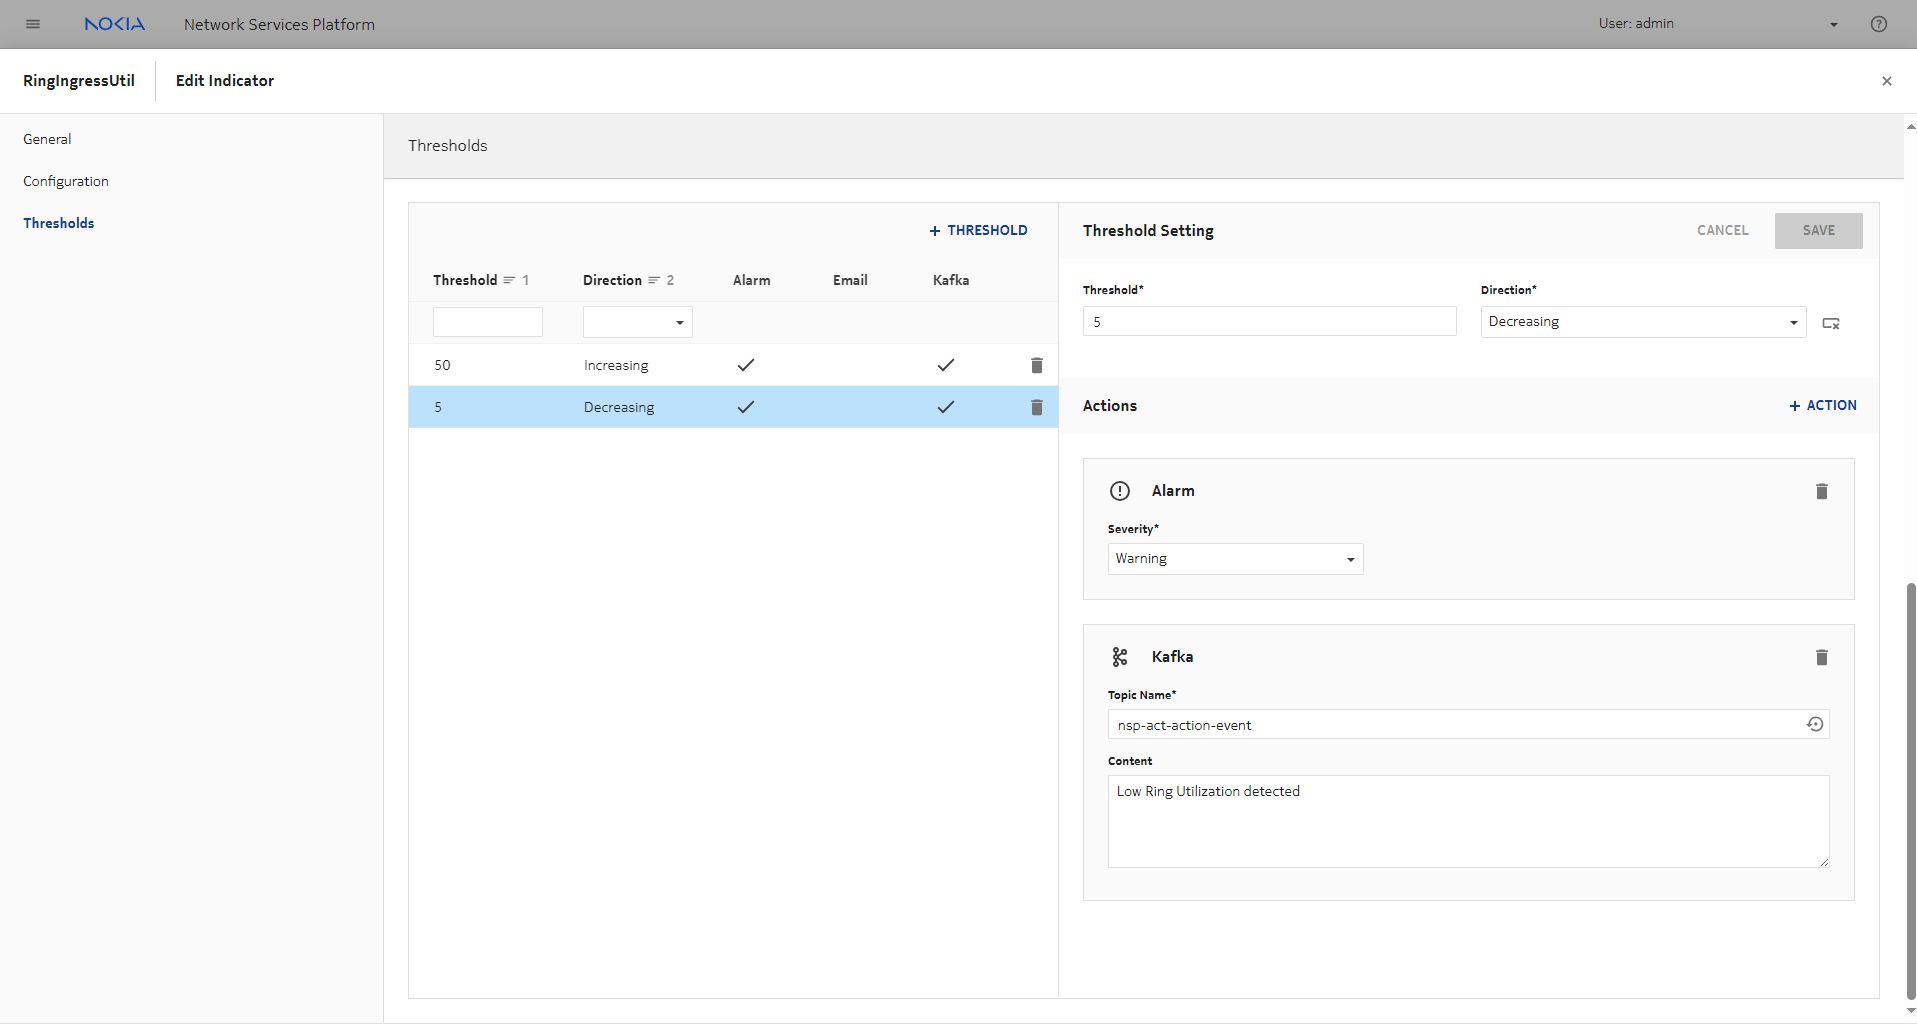
For the sample indicator, thresholds are configured with the following, as shown in Figure 5-3, Sample Indicator, increasing threshold parameters and Figure 5-4, Sample Indicator, decreasing threshold parameters:
This configuration allows for high and low utilization to be handled differently according to different levels of urgency. If needed, another increasing threshold could be set at 40, for example, with warning severity, to tell operators that the ring may need attention.
Figure 5-3: Sample Indicator, increasing threshold parameters
Figure 5-4: Sample Indicator, decreasing threshold parameters
Threshold crossing alarms (TCAs)
Indicator TCAs appear in Current Alarms as alarms with Source System “fdn:app:nsp-indicator” and Alarmed Object Type “nsp-indicator:rta-indicator-rules/rule”. The Alarmed Object ID contains the indicator rule name and the Additional Text contains the threshold violation details.
The Object Full Name field contains the indicator name and the specific object instance. For aggregate TCAs, where the aggregation functions such as avg() or sum() are used, the threshold violation may be based on statistics from multiple objects, and therefore cannot be attributed to a single object instance. In this case, the Object Full Name field contains the name of the indicator rule.
The visibility of TCAs depends on user access control settings.
-
Aggregate TCAs do not contain a Site ID or Site name, and are considered system level alarms. To view these alarms, the user must either have the Administrator role, or have both Access to all Equipment and Access to all Services enabled.
-
If the user has access to certain NEs only, the user sees indicator TCAs for those NEs, but no aggregate TCAs.
Simple and complex indicators
Simple indicators use a single counter and no formula. A simple indicator is evaluated every collection interval, for every resource returned by the object filter. If a window duration parameter is configured but no formula is used, the window duration is ignored.
Complex indicators use one or more counters and a formula. A complex indicator uses counter statistics received during each window duration to aggregate each incoming counter from each resource into a counter function. This output is then, depending on the formula, used in arithmetic or aggregation operations, or both, to calculate the KPI.
Indicator charts
An indicator chart plots calculated KPI data for a specified period along with configured thresholds. If at least one threshold has been defined, meaning the Thresholds Configured parameter is True, the threshold values are displayed when hovering on the far right-hand edge of the indicator chart.
Rising and falling thresholds appear on the chart as dotted lines. Threshold crossing events are indicated where they are detected.
Indicator charts and a list of threshold crossing events are available in Data Collection and Analysis Visualizations.
To open Data Collection and Analysis Visualizations for a selected indicator, choose the indicator and click ![]() (Table row actions), Open in Data Collection and Analysis Visualizations. If the indicator has multiple outputs, choose the resources in the form that opens, click
(Table row actions), Open in Data Collection and Analysis Visualizations. If the indicator has multiple outputs, choose the resources in the form that opens, click ![]() (Add) and click
(Add) and click ![]() OPEN IN DATA COLLECTION AND ANALYSIS VISUALIZATIONS. The view opens to a New Chart form with the indicator resources selected.
OPEN IN DATA COLLECTION AND ANALYSIS VISUALIZATIONS. The view opens to a New Chart form with the indicator resources selected.
RESTCONF APIs are available for NSP Indicators; see the Network Infrastructure Management API documentation on the Network Developer Portal.
To plot an indicator chart, see How do I plot an indicator chart?.
To chart a threshold crossing event, see How do I chart a threshold crossing event?.
Indicator data storage
Indicator data is stored in Postgres unless there is an auxiliary database enabled, in which case all collected data is stored in the auxiliary database.
By default, data is stored in Postgres for 35 days, and in the auxiliary database for 90 days. These values can be changed using the RESTCONF API or by updating the age-out policy; see How do I edit an age-out policy?.


