Top Loaded Nodes report
Top Loaded Nodes report overview
The Top Loaded Nodes report shows the top loaded NEs sorted by order of load. You can select a value of ‘N’ meaning top N loaded NEs. By default, N is set to 5. If N is not selected, then all NEs are included. The Top Loaded Nodes report can be generated based on Radio or Ethernet port utilization percentage.
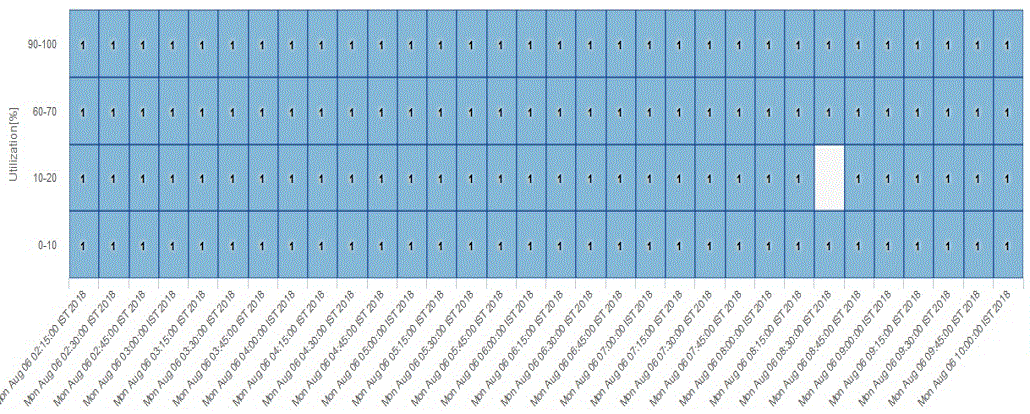
The heat map is colored according to the maximum and minimum values for the number of NEs that appear in each section of the chart.
Click each block on the heat map report to get the individual NE port utilization report. See Figure 15-37, Top Loaded Nodes Report—Utilization Details for the utilization report.
Note: We see utilization details with data upon clicking the empty box of the heat map with one minute interval. This happens when we see PM collection with one min interval and the time stamp is with less than 1 min duration.
Use cases
Capacity planning—Use the report to examine the top loaded NEs based on the radio or Ethernet traffic in a network and to plan for capacity requirements.
Prerequisites
The following table describes the aggregation rules that must be enabled and the accounting policies that must be configured for the NEs on which statistics are to be collected; see the NSP NFM-P Statistics Management Guide for information about configuring an accounting policy. To view the report for granularities other than raw data, the aggregation rules must be enabled; see How do I configure analytics aggregation?.
Table 15-33: Top Loaded Nodes report prerequisites
|
Aggregator name |
Monitored object class |
Statistics class |
Statistics collection |
MIB |
NE types |
|---|---|---|---|---|---|
|
Wavence Ingress Stats Bandwidth Aggregator Wavence Egress Stats Bandwidth Aggregatorr |
NE |
Ethernet |
Ethernet Aggregate Rx Stats (15Min) Ethernet Aggregate Tx Stats (15Min) |
ethAggrMaintRxEntry ethAggrMaintTxEntry |
Wavence MSS-1, Wavence MSS-4, Wavence MSS-8, Wavence MSS-O, Wavence MSS-E, Wavence MSS-HE, Wavence MSS-XE, Wavence MSS-1c, Wavence SA, Wavence UBT-SA, Wavence UBT-I, Wavence UBT-T XP, 9500 MPR-A Chassis 1, 9500 MPR-A Chassis 4, 9500 MPR-A Chassis 8, 9500 MPR-E Chassis 1, 9500 MPR-E Chassis 4, 9500 MPR-E Chassis 8, 9500 MSS-1c, 9500 MSS-O ANSI, 9500 MSS-O ETSI, 9500 SA |
Report characteristics
The following table lists the principal report characteristics.
Table 15-34: Top Loaded Nodes report characteristics
Example
The following figures show a report example.
The below heatmap is displayed for all the NEs in the network based on the radio port utilization percentage.
Click each block to get the individual NE port utilization report.
Figure 15-35: Top Loaded Nodes Report—Radio Traffic

The below heatmap is displayed for top five NEs in the network based on the Ethernet port utilization percentage.
Clicking on each block will take the user to the individual NE port utilization report which is shown in the next figure.
Figure 15-36: Top Loaded Nodes Report—Ethernet Traffic

The Figure below is the individual NE port utilization report which displays the Site Id, Port Name, Utilization(%), Throughput (Mbps),Compression Gain and Average Utilization(%).
Figure 15-37: Top Loaded Nodes Report—Utilization Details
