How do I view past events on an object?
Event Timeline summary view
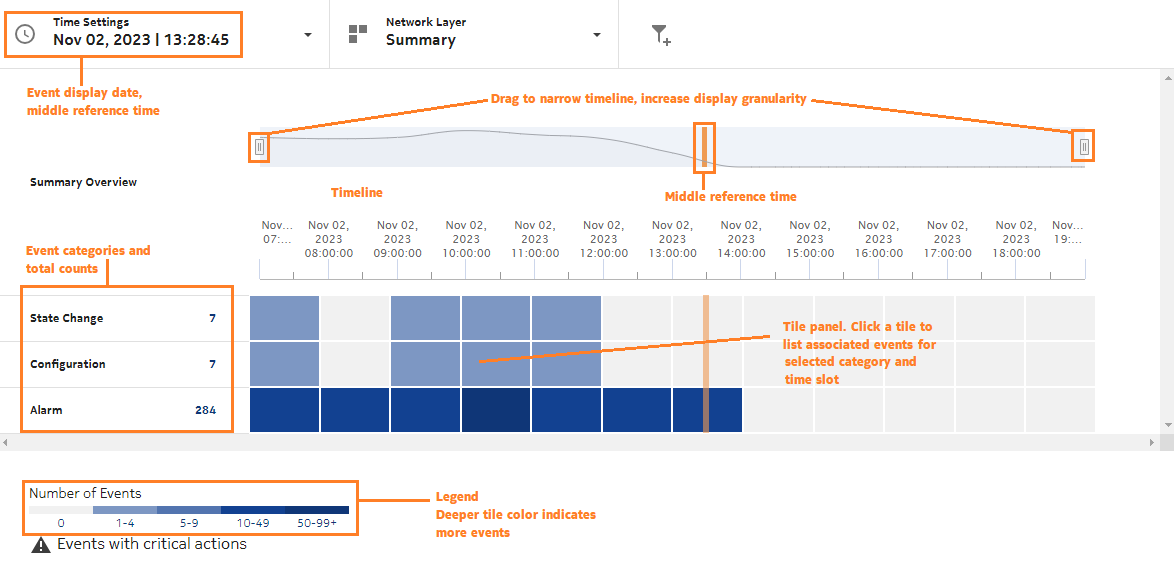
The Event Timeline displays events related to alarms, configuration and state change notifications, and OAM test failure notifications, to help determine the root cause of a problem with an NE or service. The Event Timeline is displayed as a summary in the Troubleshooting dashboard. The default timeline displays a plot along the bottom of the view and event categories, such as alarms or updates, are listed with total event counts.
View events that occurred prior to a hardware problem, or an alarm being raised to determine a possible cause (for example, an object configuration change).
When you are troubleshooting an NE, the timeline shows events on equipment, physical links originating or terminating on the NE, service site, service endpoint, tunnel bindings, tunnels, and LSPs originating on the NE.
When you are troubleshooting a service, the timeline shows events on services sites, endpoints, tunnel bindings, supporting LSPs, physical links, LAGs and supporting ports (for endpoints).
To open a more detailed view, click View in Event Timeline for event details by category in shorter time frames, with associated events listed.
Note: The Event Timeline does not auto-refresh. You must refresh the page manually OR change the time span to update the timeline, either in the summary view or expanded view.
Expanded view
The timeline is displayed across the top of the view, and event categories, such as alarms or updates, are listed on the left. Event counts are displayed as colored tiles. A deeper color indicates a high number of events within the specified time span.
A Critical icon is displayed if the time span has at least one critical event, such as a critical alarm or a failed OAM test.
