SAP Throughput reporting scenario

Purpose

The SAP Throughput (NSP) report shows throughput by a specified service and SAPs. The SAP Throughput (NSP) report includes throughput data for NEs managed by the NFM-P only, MDM (model-driven) only, or NFM-P+MDM-mediated NEs. The default display is a set of time series graphs, showing ingress, egress and total throughput.

This process shows how to set up a service for SAP Throughput reporting in Analytics.

Confirm that prerequisites for service provisioning are completed
 

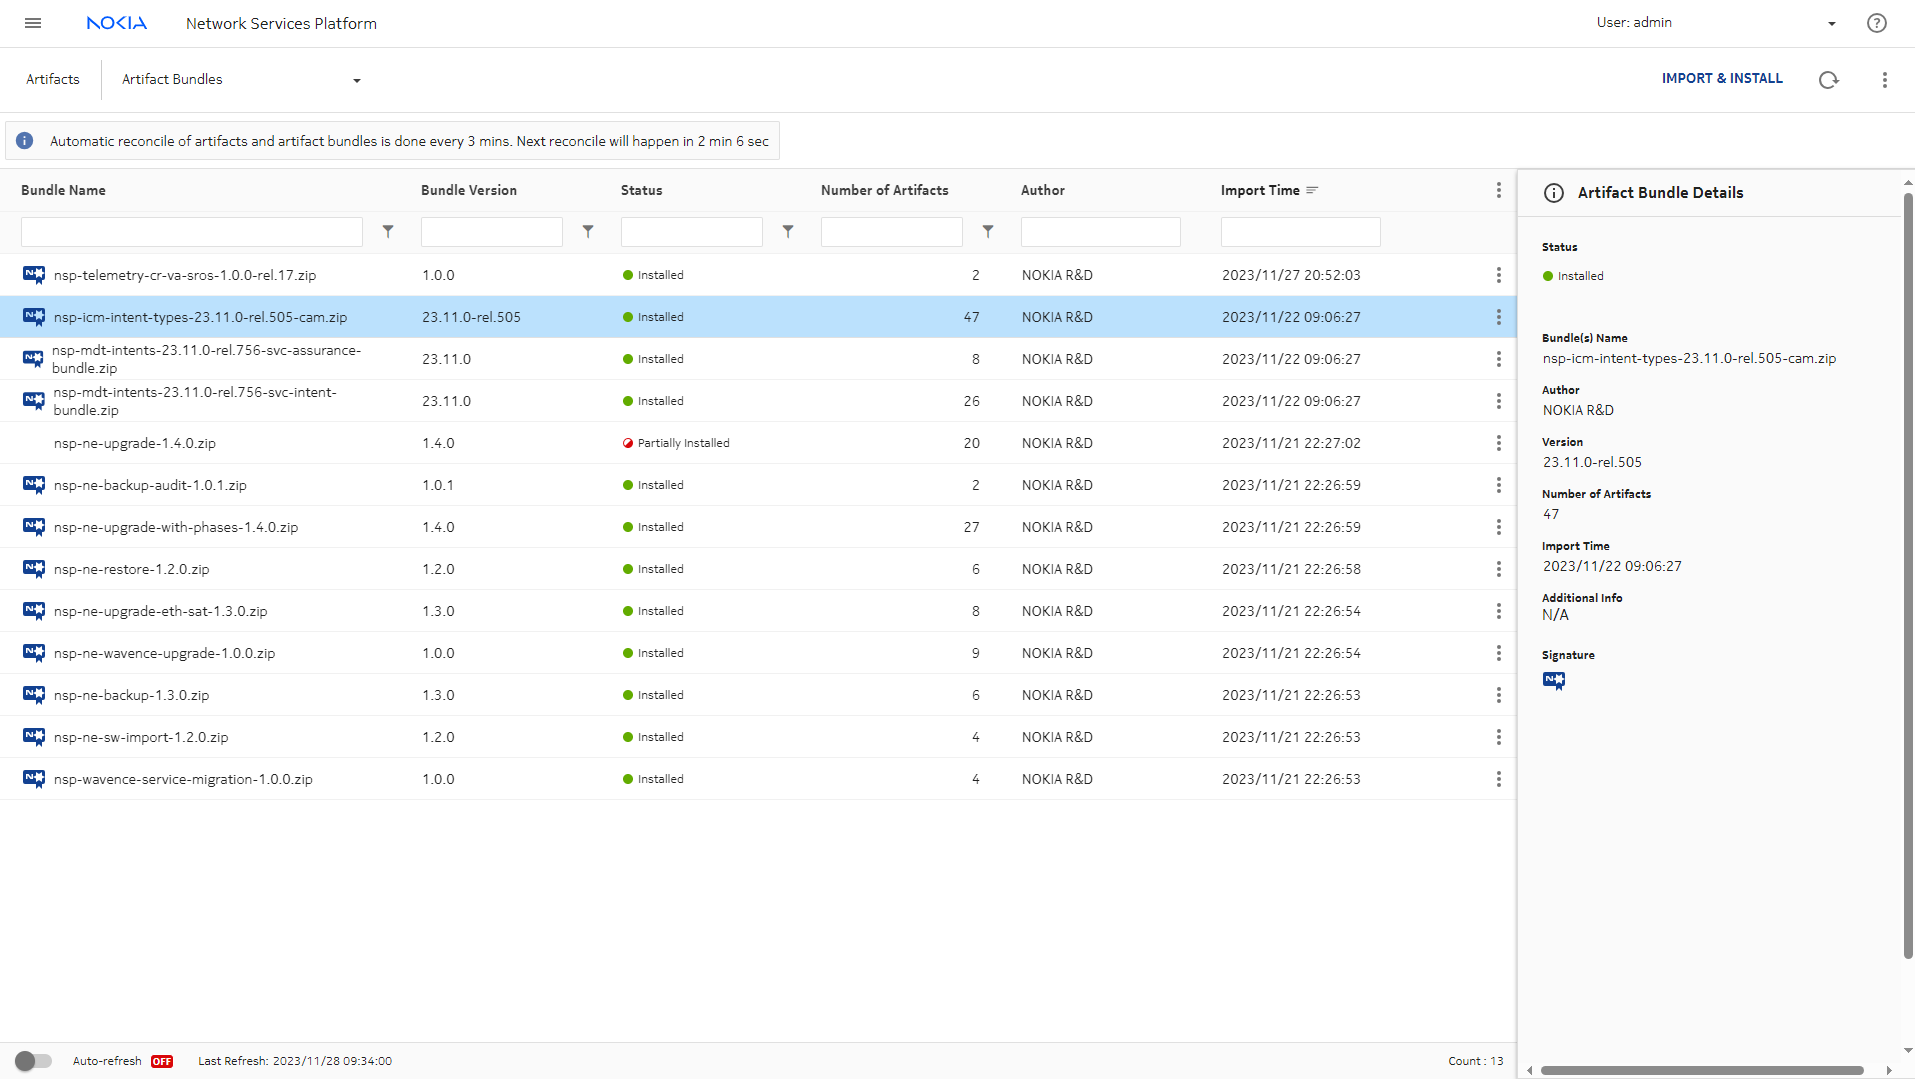
Two intent type bundles are required for provisioning our service, and for setting up QoS and telemetry: icm-intent-types, and mdt-intents.

Checking the Artifacts, Artifact Bundles view shows that both bundles are in Installed status.


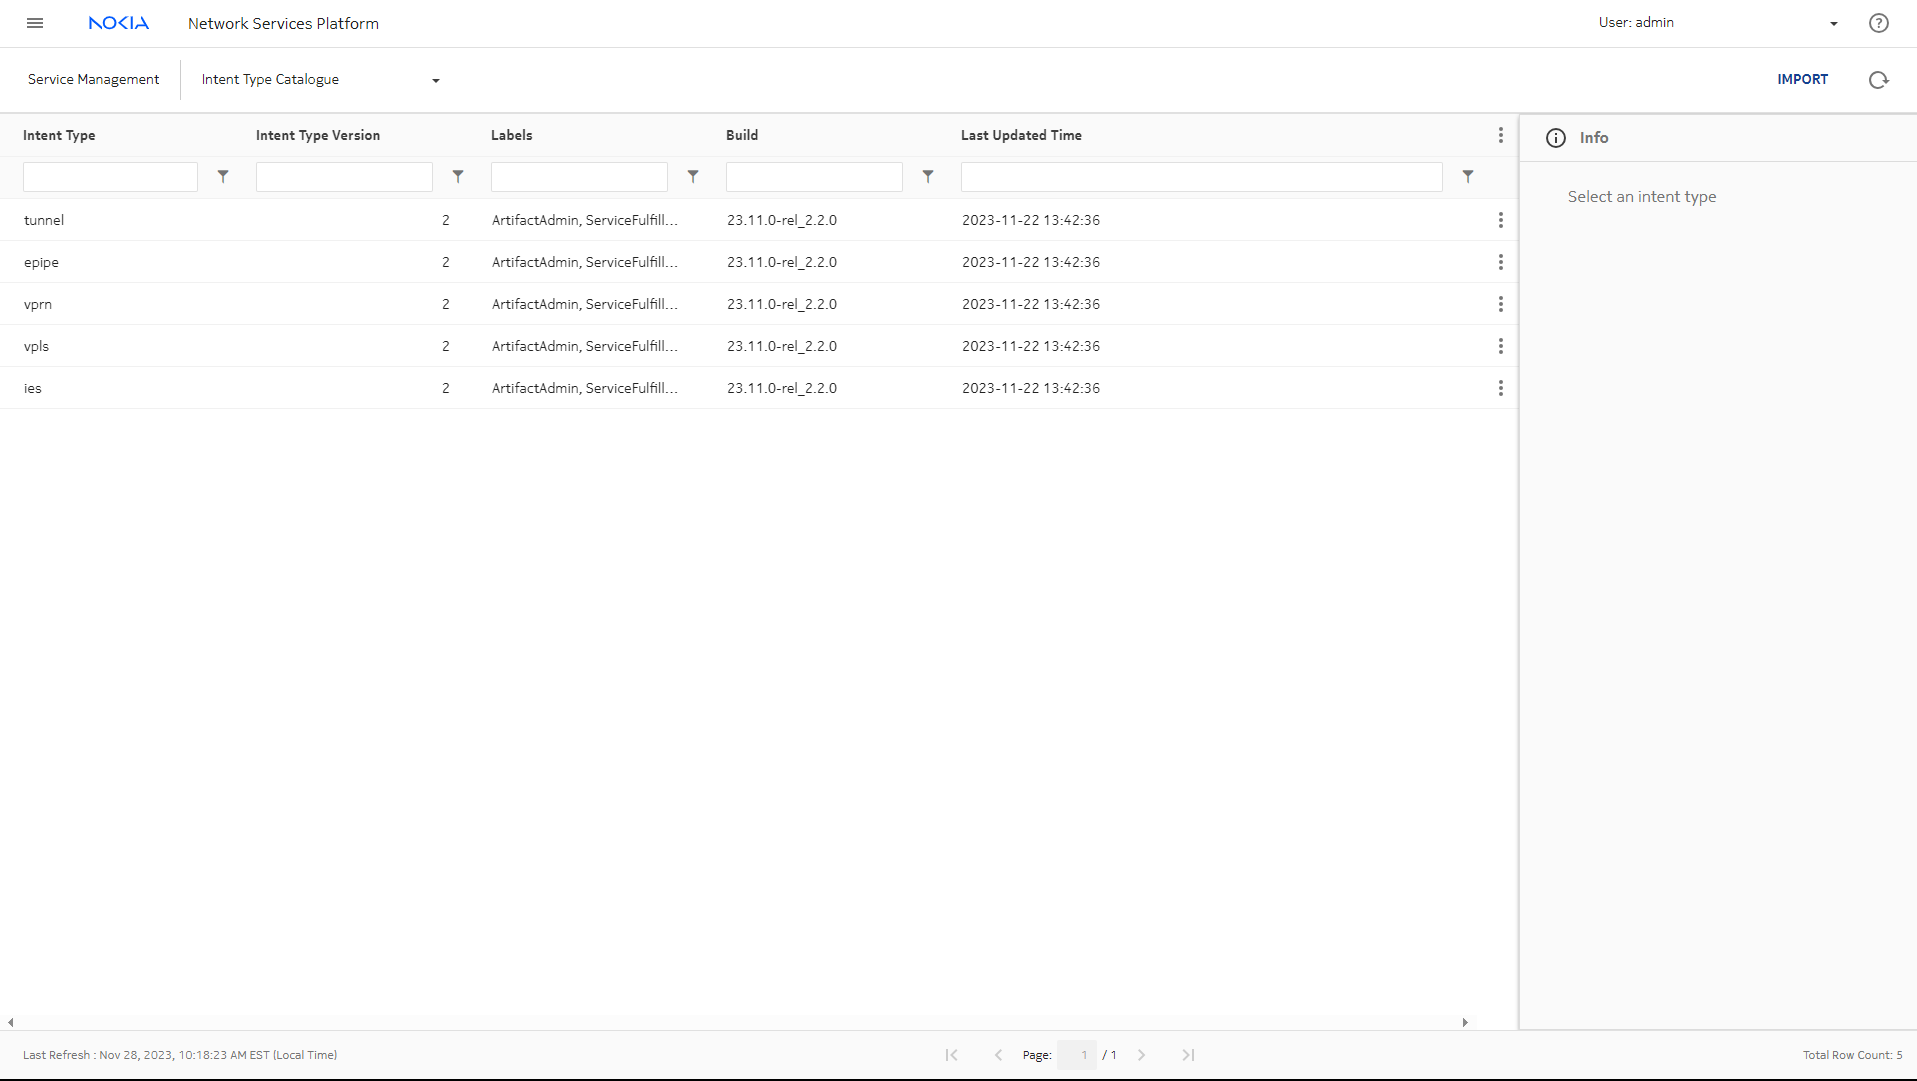
NSP installs the intent types to Network Intents, from which they can be imported to Service Management.

Checking the Service Management, Intent Type Catalogue view shows that the intent types have been imported and are available for use in Service Management.


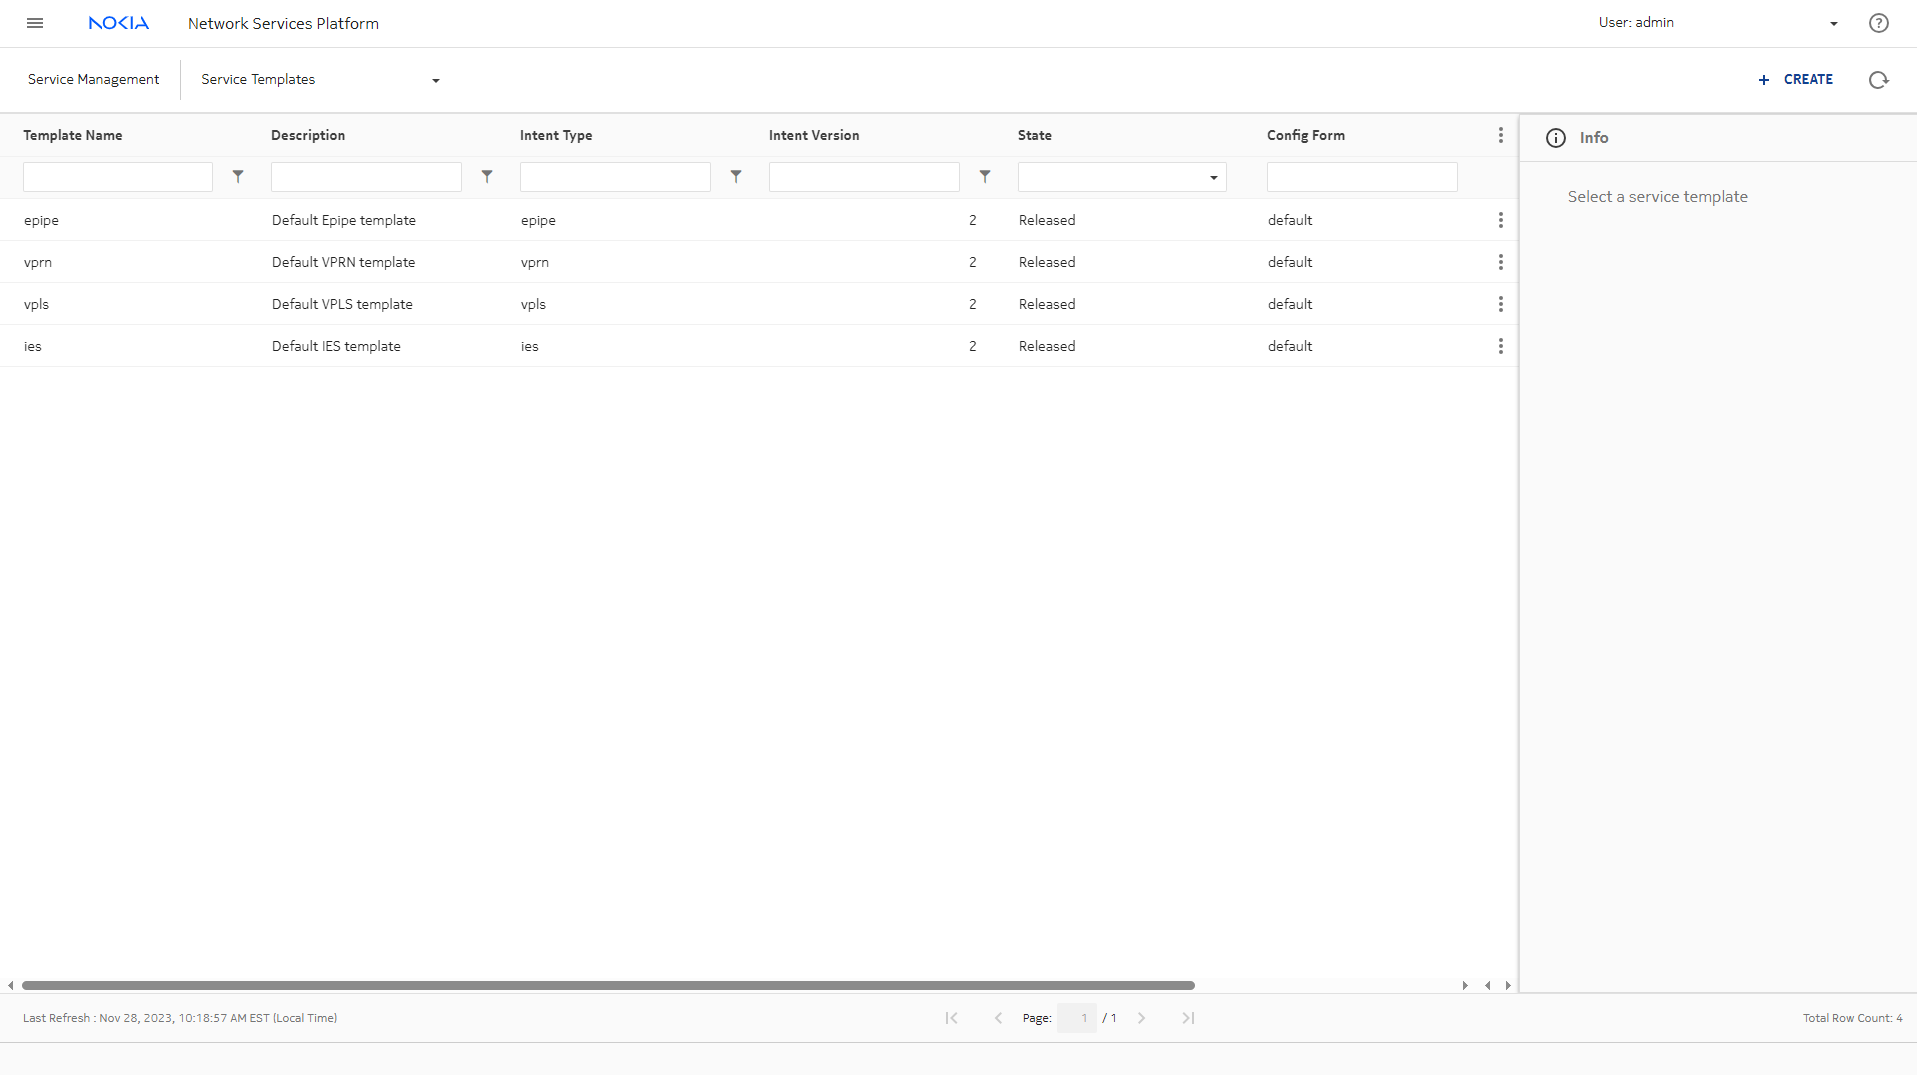
Switching to the Service Management, Service Templates view shows that the intent types have been used to create templates for various service types.

Verify policy configuration
 

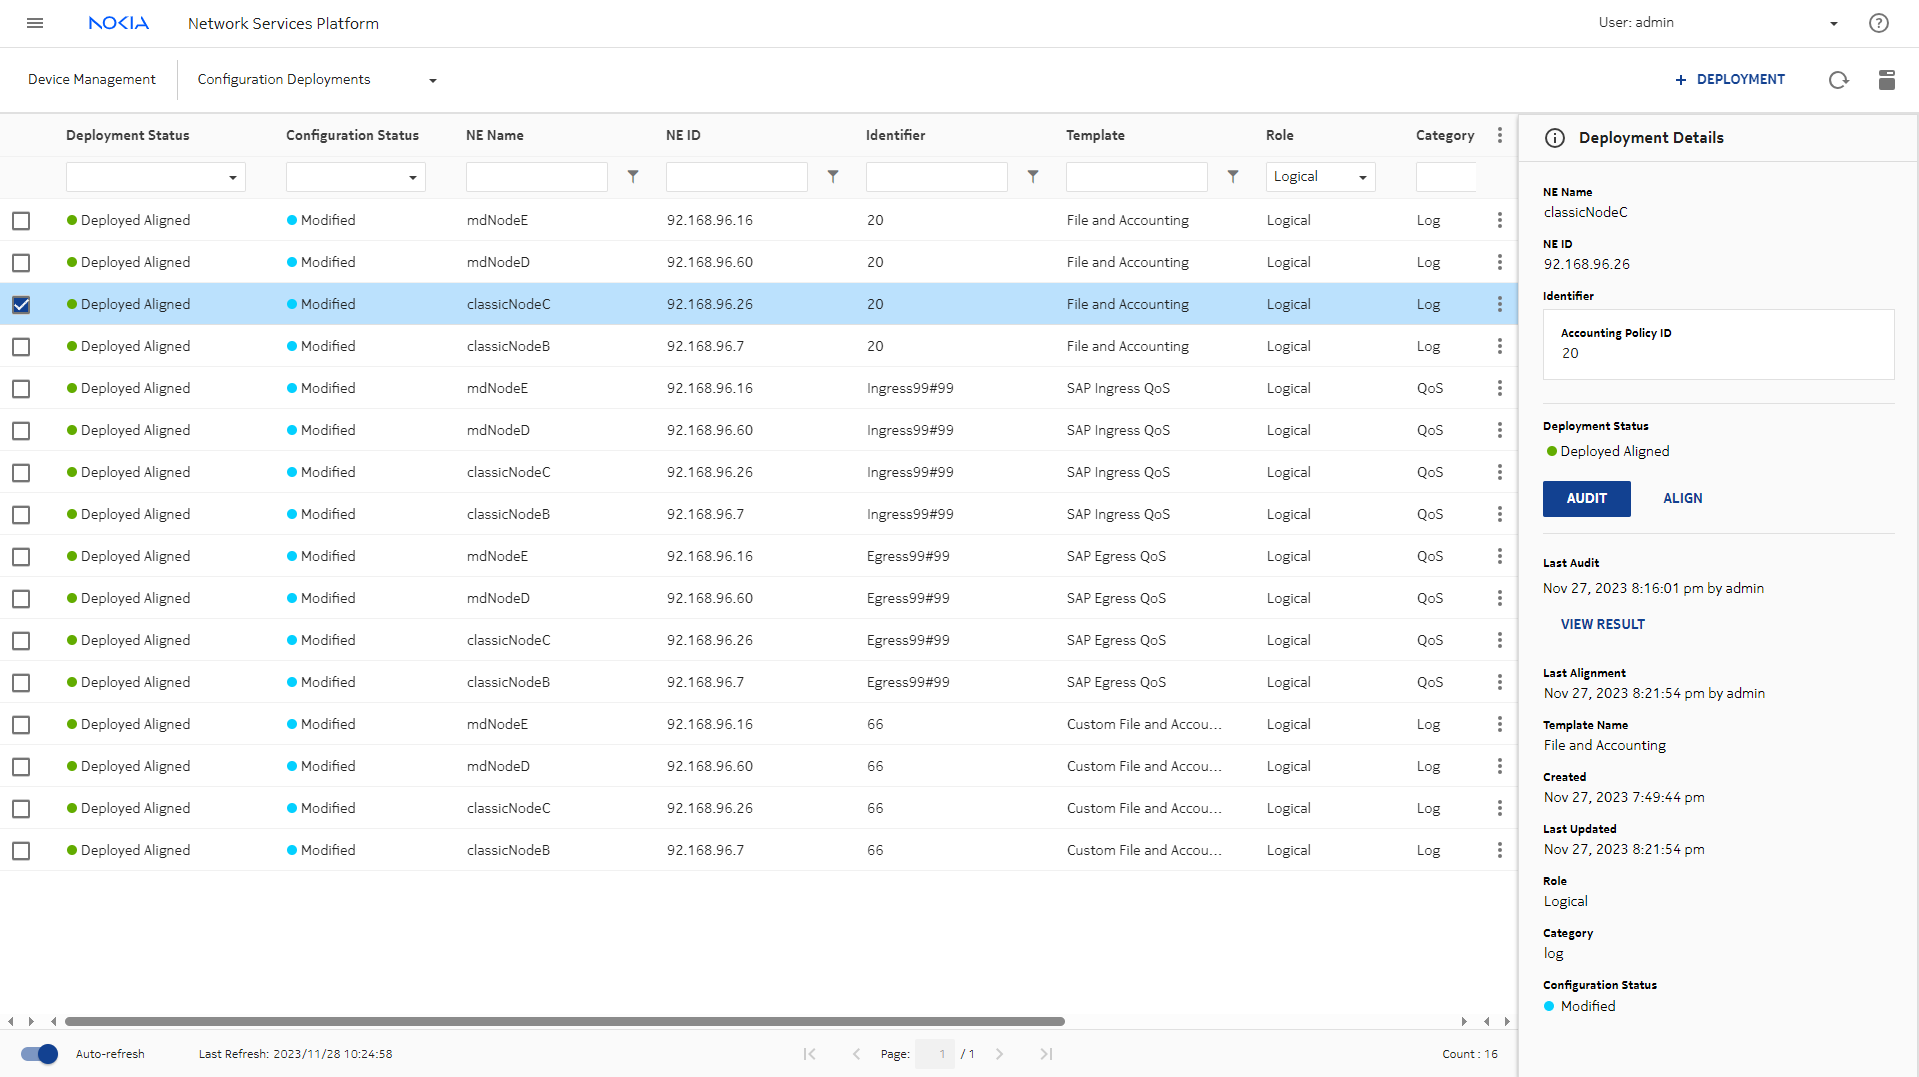
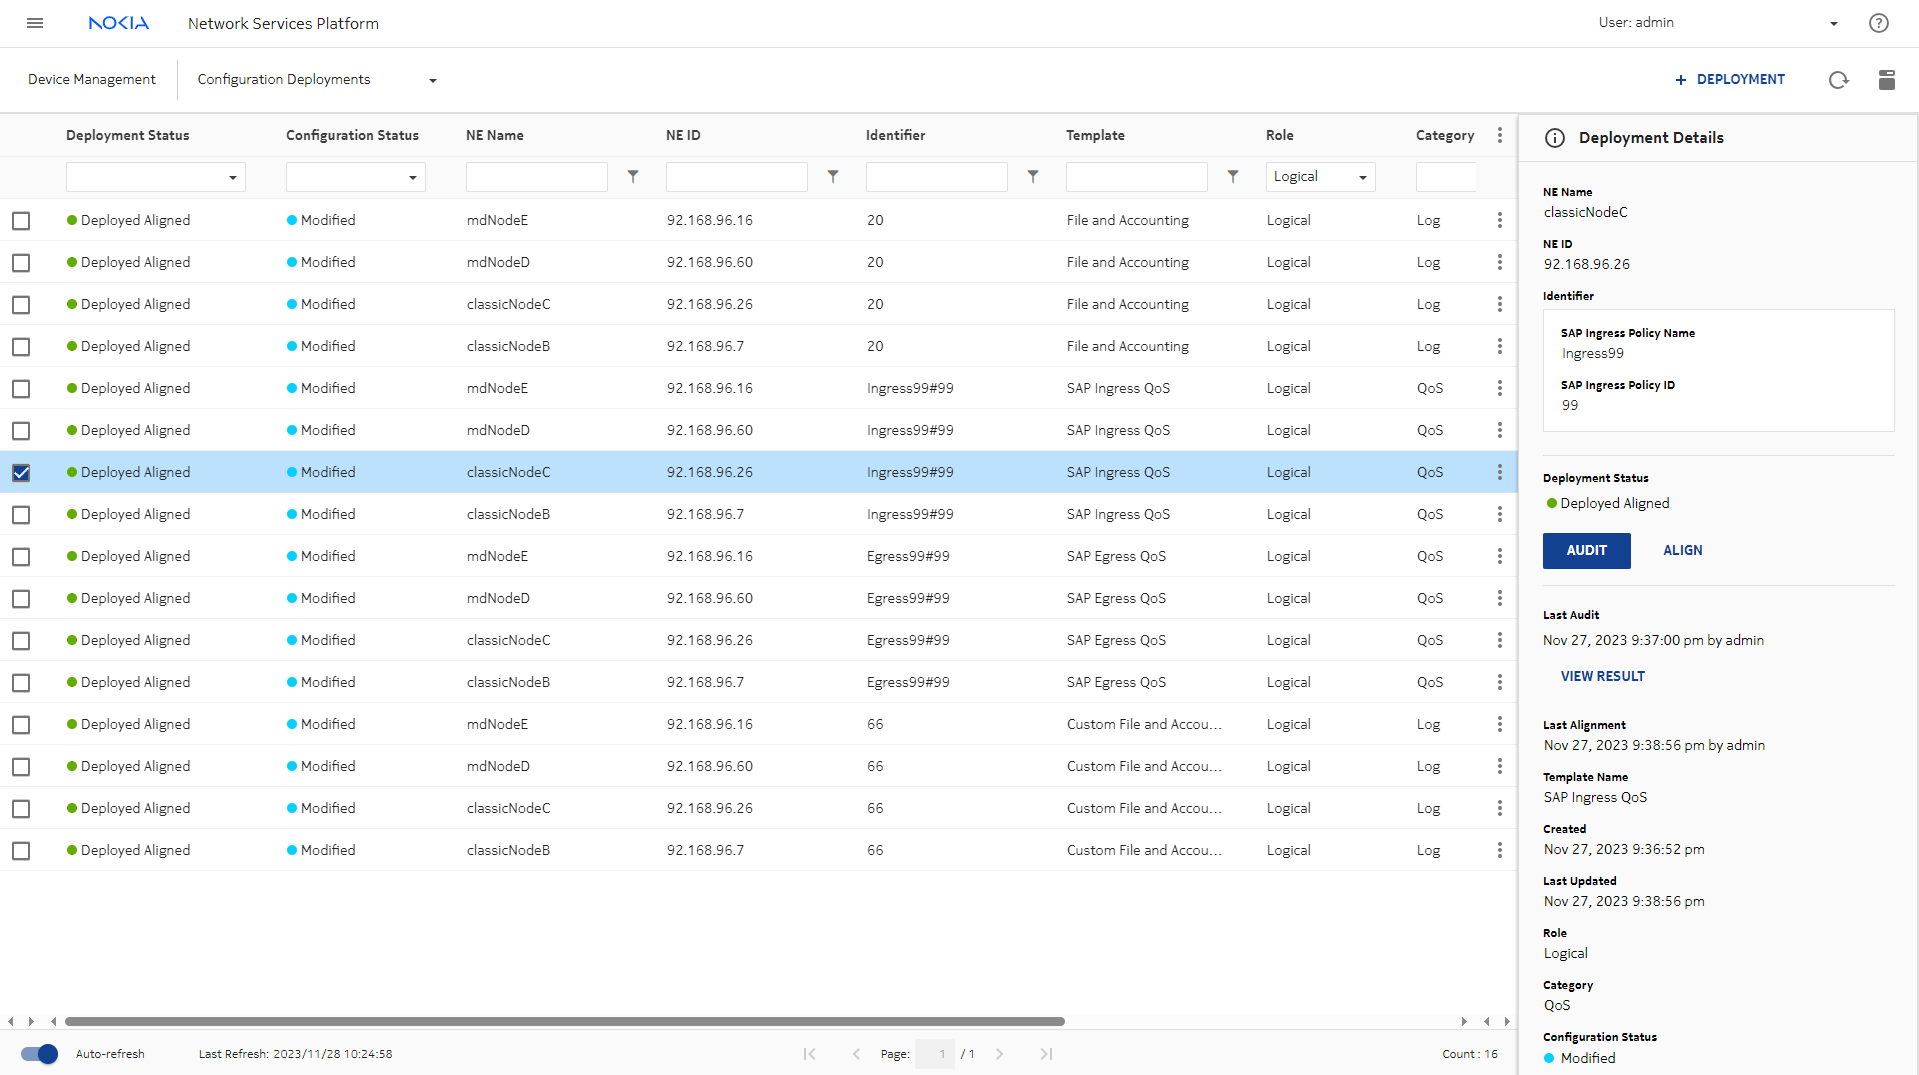
To collect statistics on an NE, a file and accounting policy must be configured on the NE. This can be done by deploying a template in the Device Management, Configuration Deployments view.

In the Configuration Deployments list, we can see that a template called File and Accounting has been deployed on the NE and the Deployment Status is Deployed Aligned. The policy identifier is 20.


We can view the template details to see policy details:

  1. Select the deployment and choose View/Edit from the Table row actions menu.

  2. In the form that opens, click VIEW/EDIT TEMPLATE CONFIG.

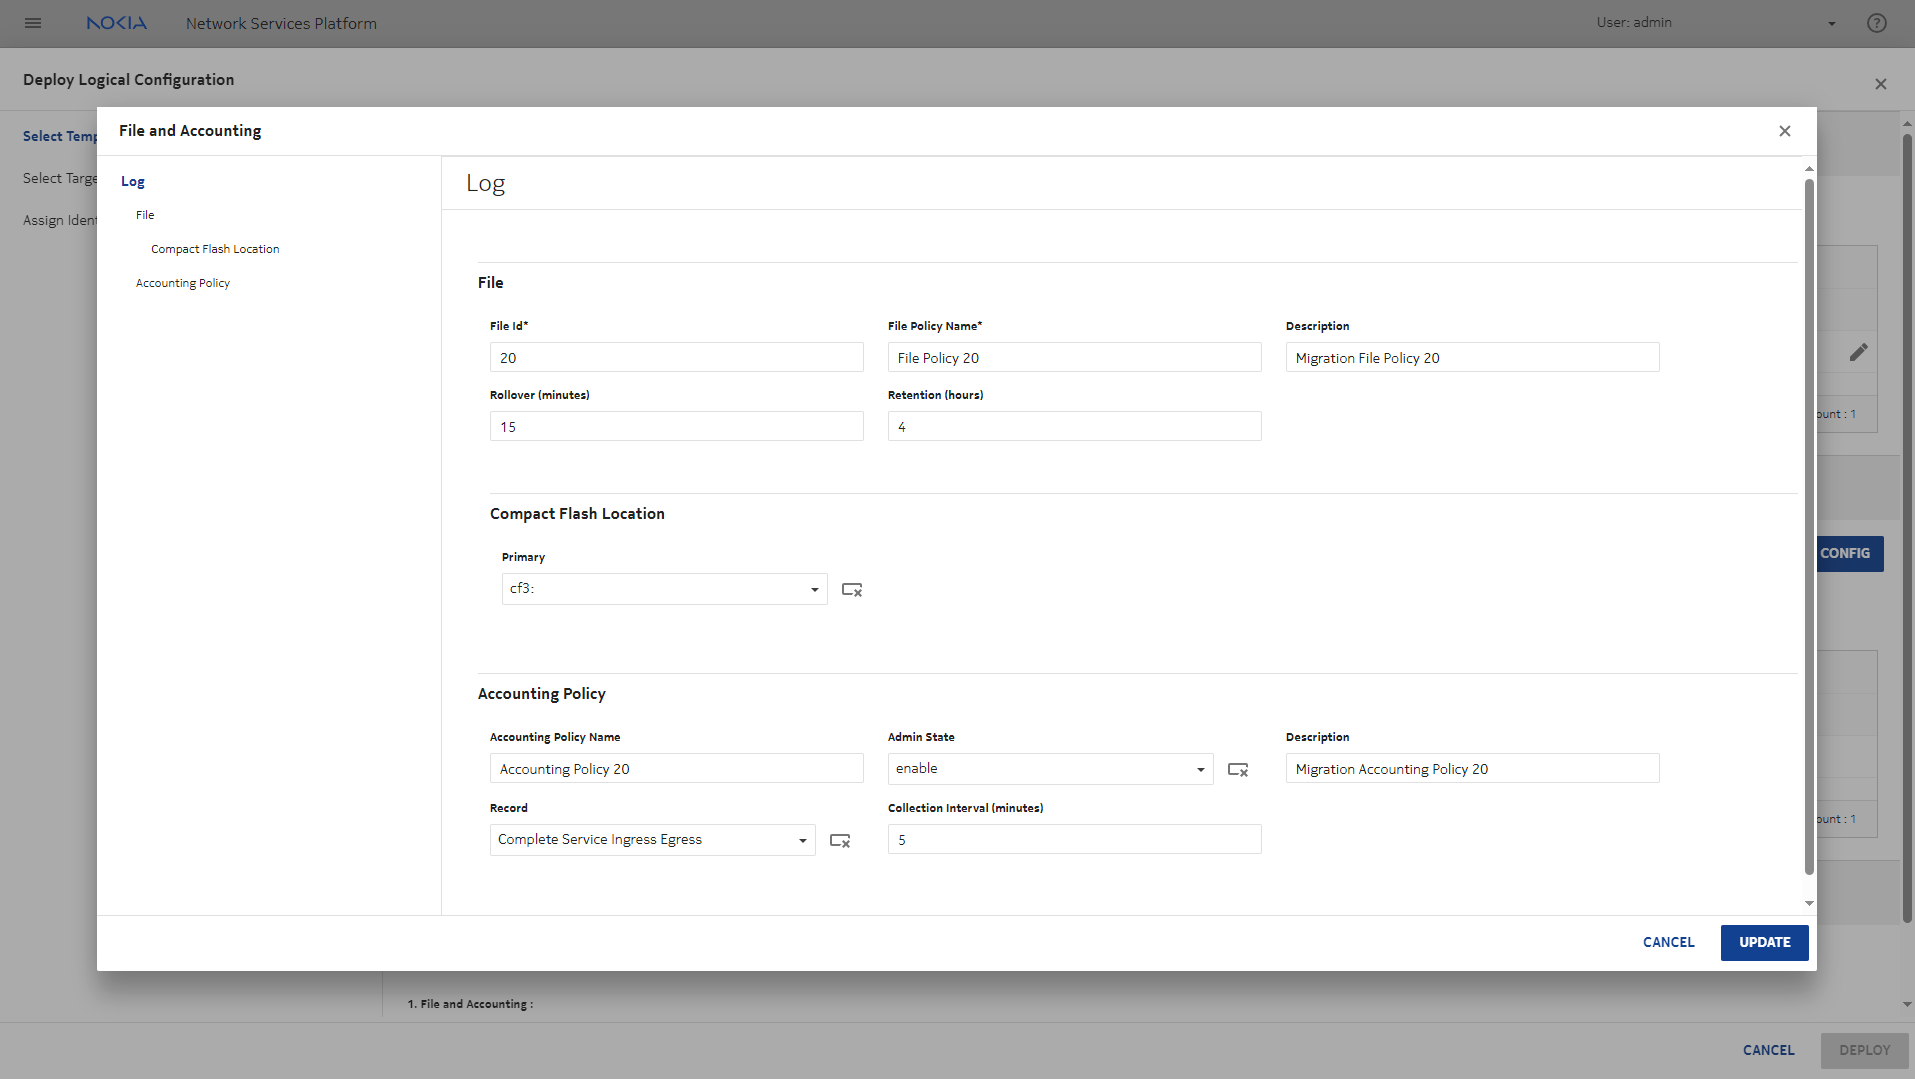
The template information shows the rollover duration, or how long a statistics collection file remains open before a new file is started, the retention period for the file, and the compact flash location where the file is stored.

Accounting policy details show that the policy applied is number 20, and it will be collecting Complete Service Ingress Egress statistics. The collection interval is 5 min, meaning that every 5 min the NSP will collect the statistics from the node and save them to the database.


Additionally, there are egress and ingress QoS policies deployed, which allows traffic shaping and to prioritize certain types of traffic.

The ingress QoS policy identifier is Ingress99#99.


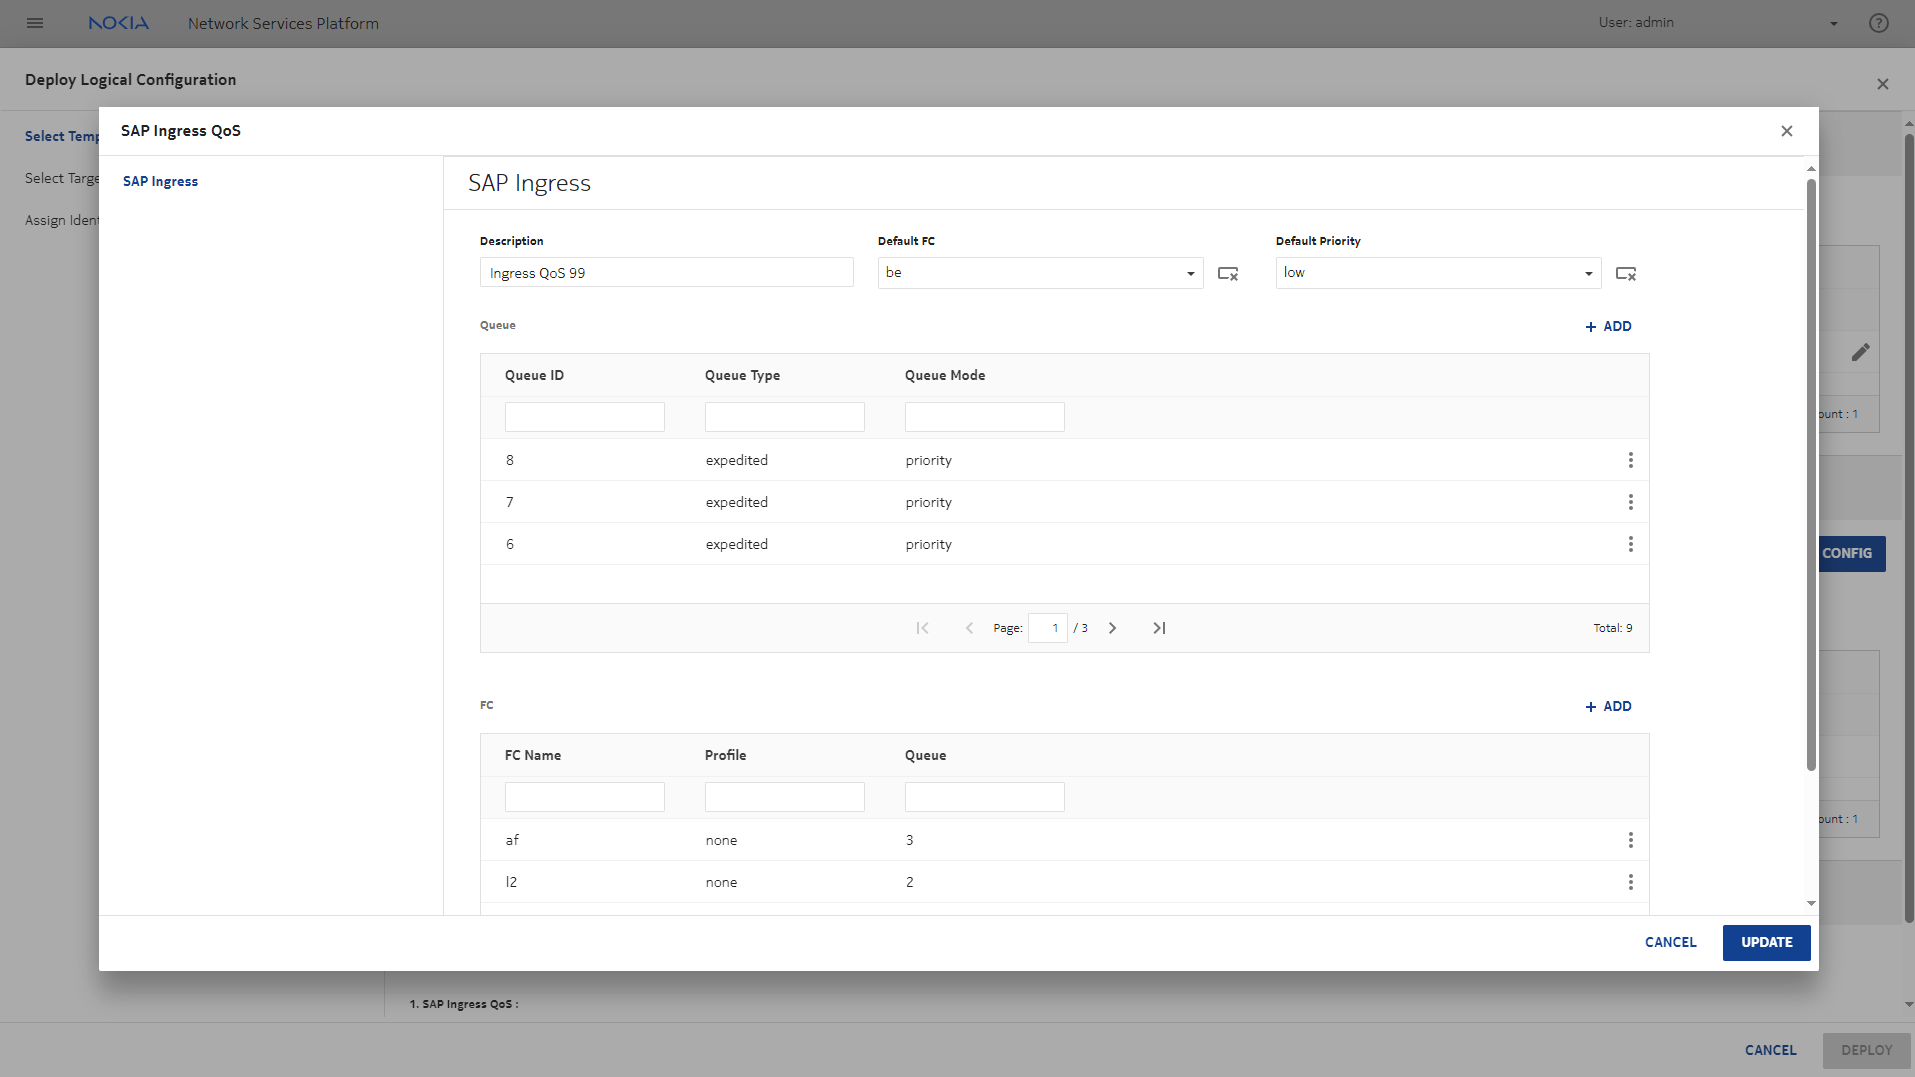
We’ll view the ingress template details as an example:

  1. Select the deployment and choose View/Edit from the Table row actions menu.

  2. In the form that opens, click VIEW/EDIT TEMPLATE CONFIG.

There are a total of nine queues configured. The three that display on this page have been configured as expedited queues with high priority. At the bottom of the form, we can see two of the forwarding classes.

Policers have also been applied directly to the NEs.

Verify the service parameters
 

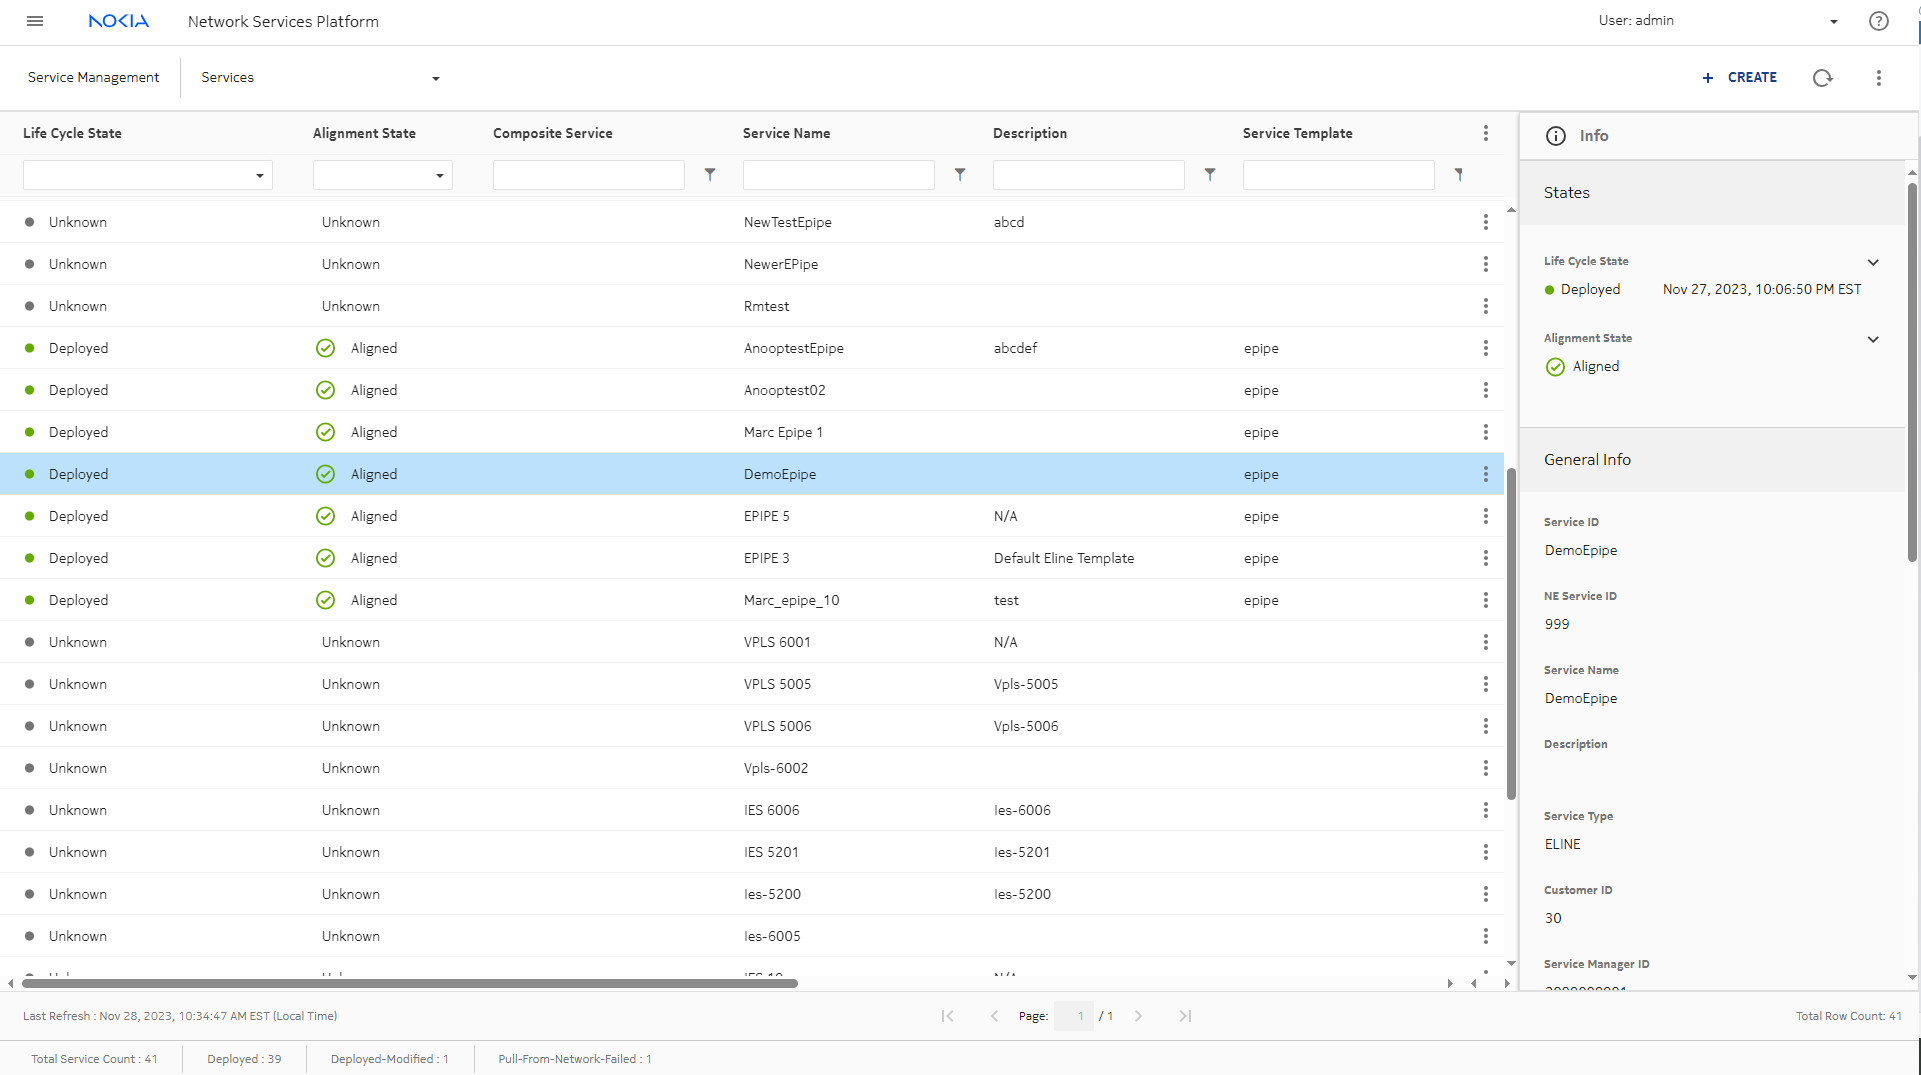
In the Service Management, Services view, we can see the provisioned services.


DemoEpipe is Deployed and Aligned.

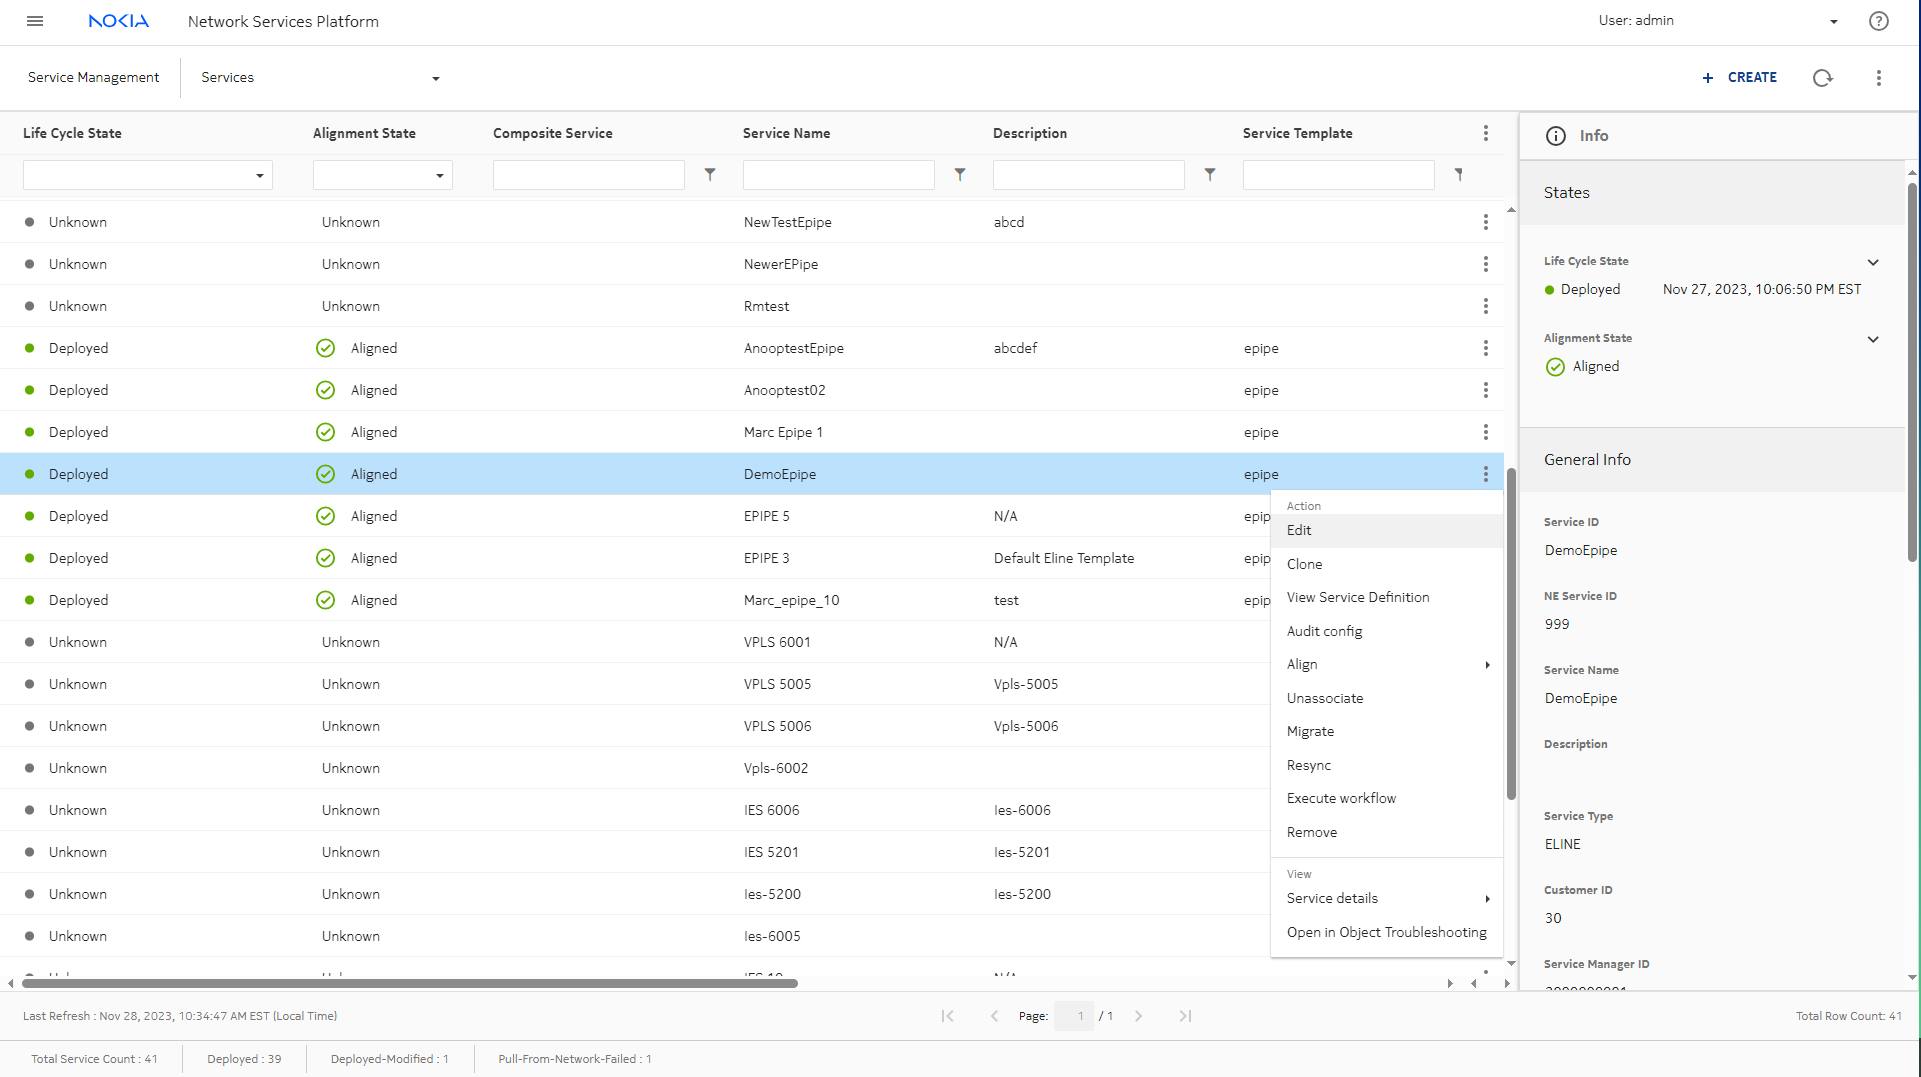
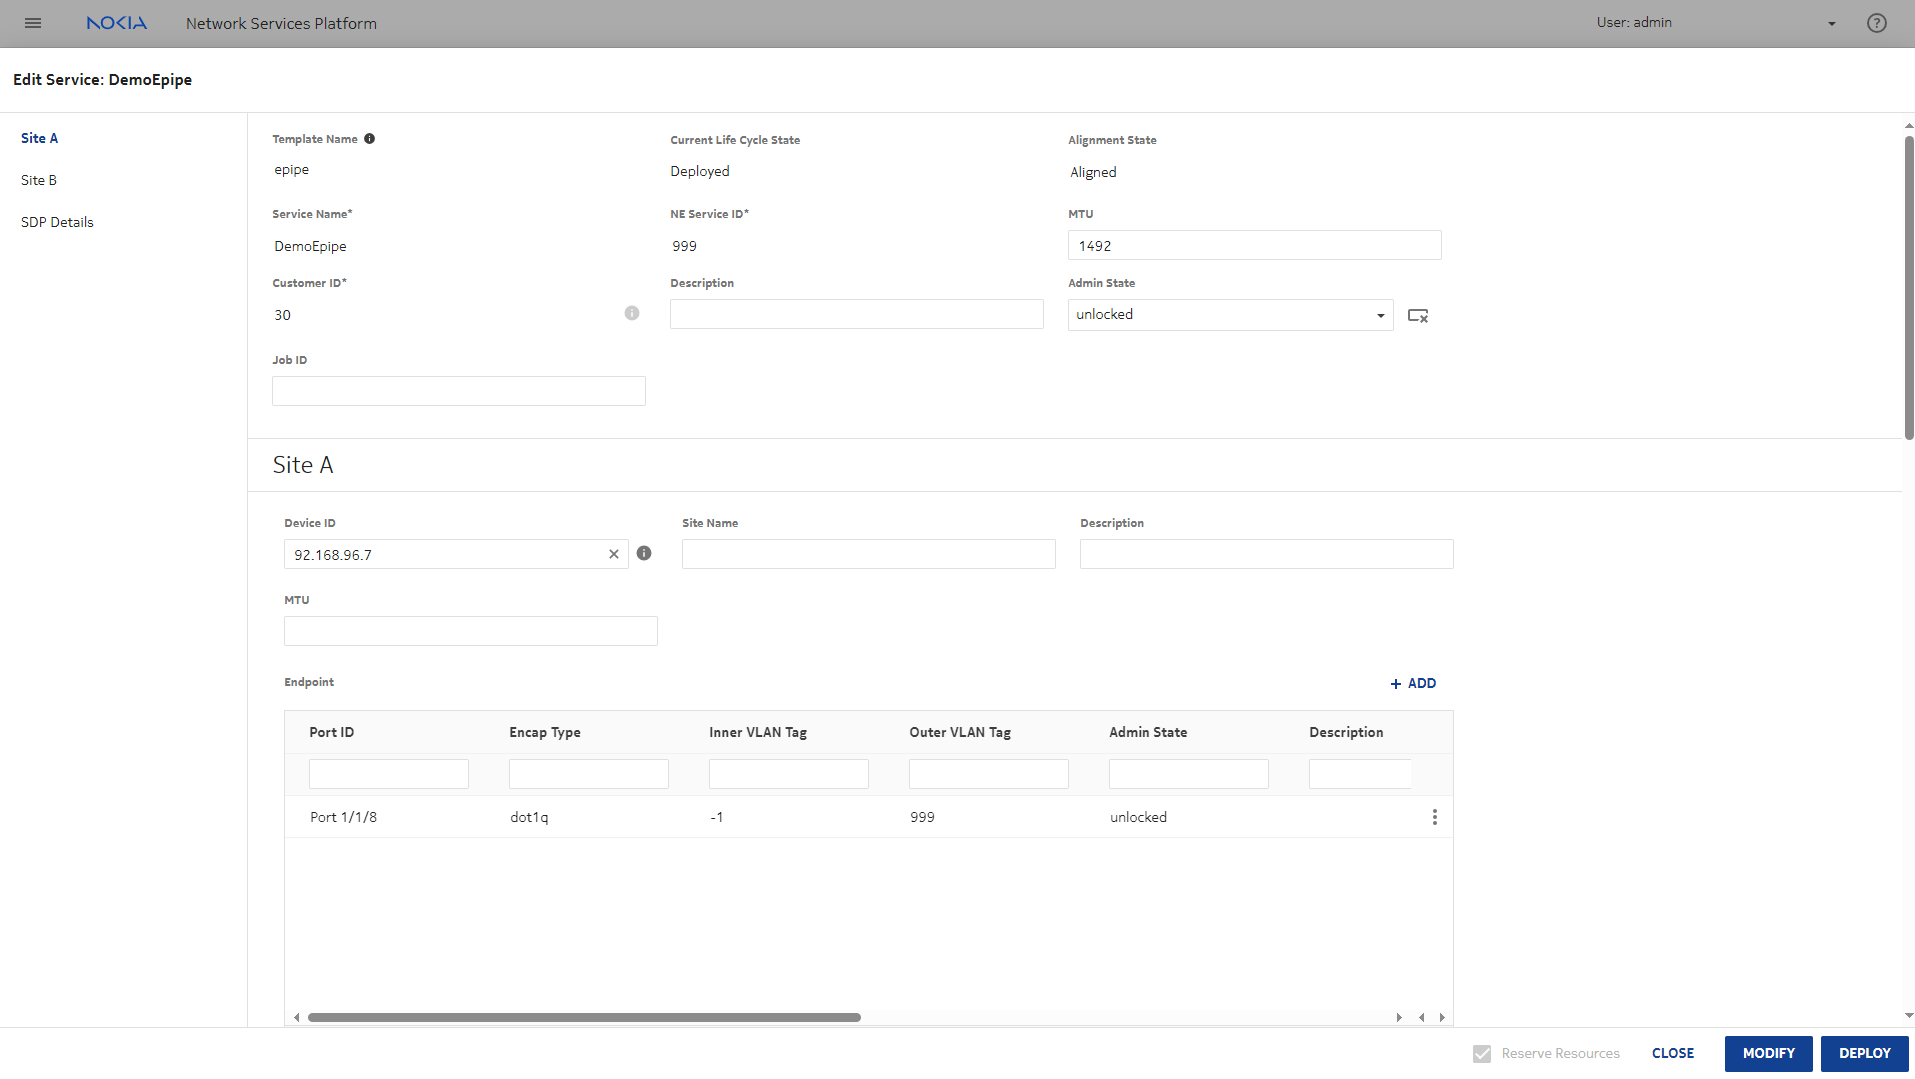
Opening the Edit form for the service will let us verify that everything we’ll need is in place. Select the service and select Edit from the Table Row actions menu.


The Edit service form shows the basic service parameters such as service name and customer ID, and the service endpoints.


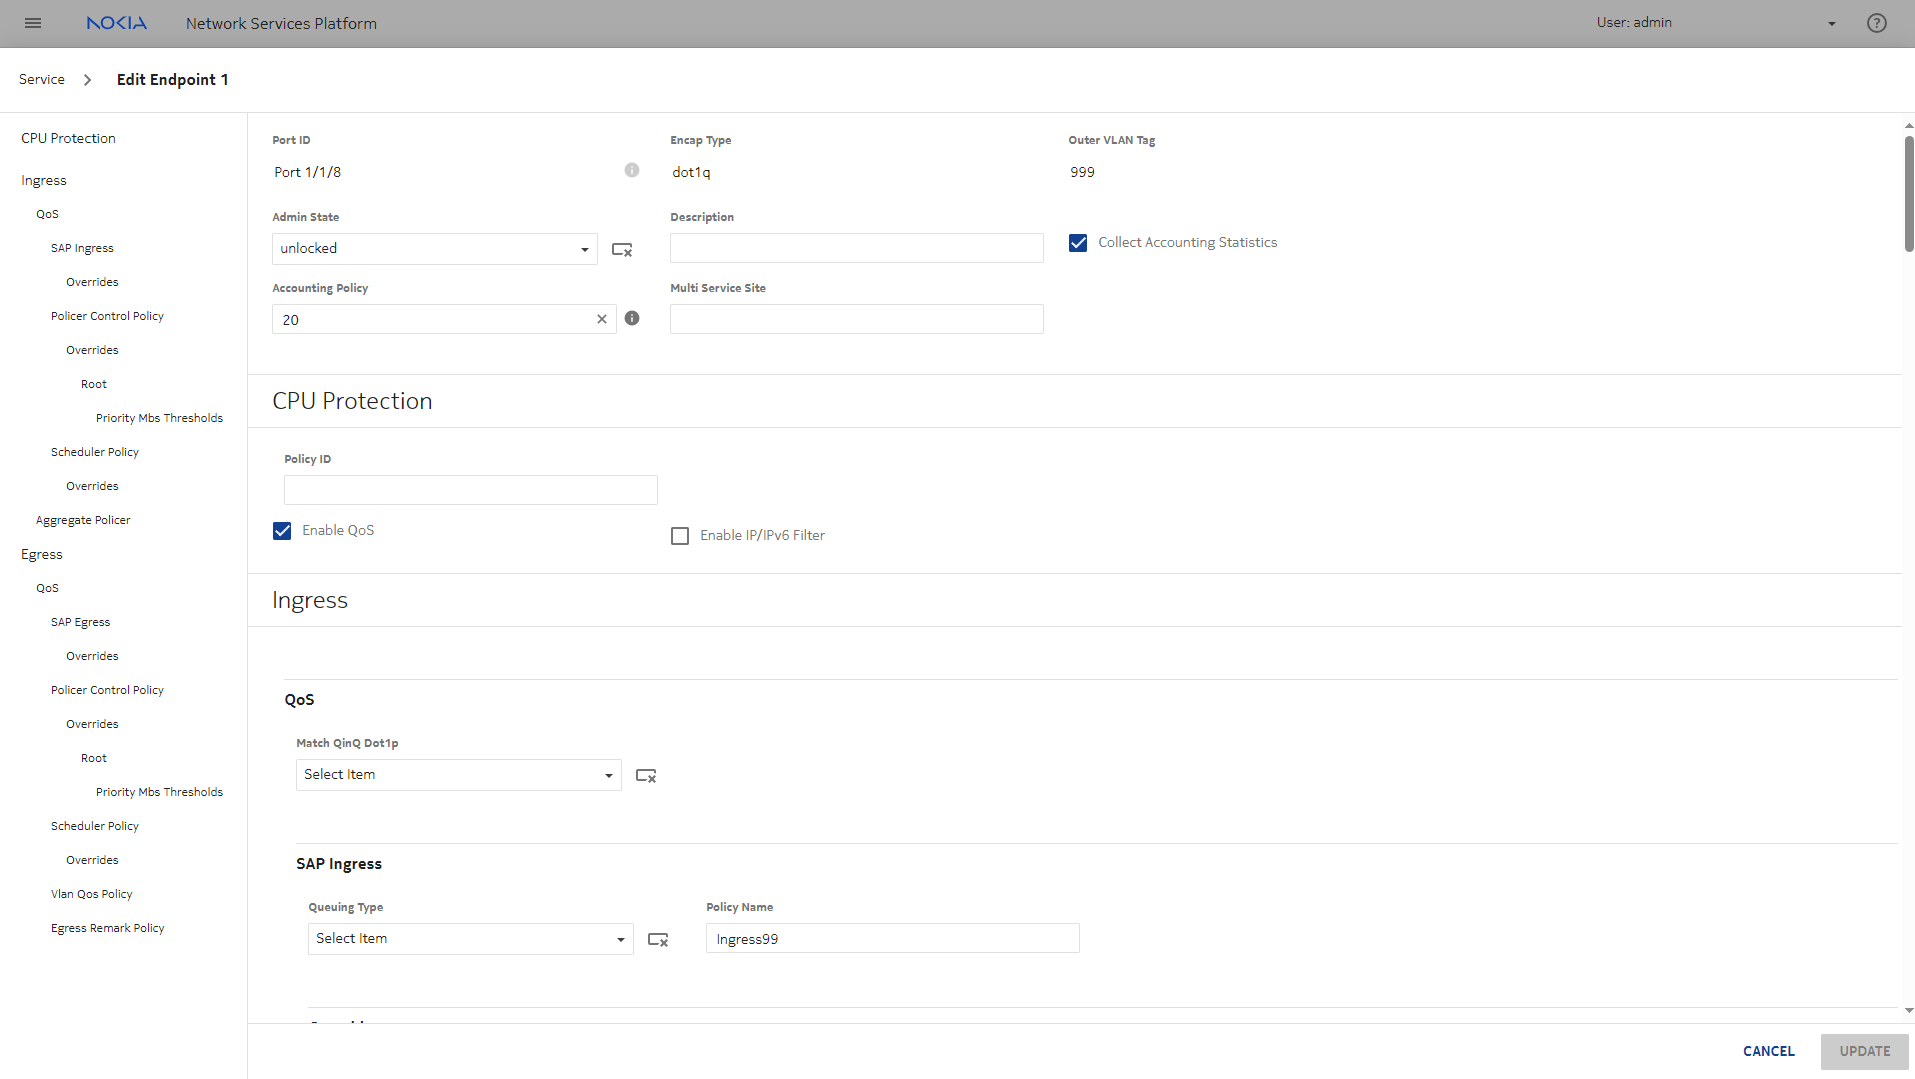
Site A of the service is on port 1/1/8. Select the endpoint and choose Edit to verify the endpoint parameters.

In the Edit Endpoint form, we can see that accounting statistics collection and QoS have been enabled, and the policies and overrides that have been applied. The accounting policy is 20, and the SAP Ingress policy is Ingress99: the policies we verified in the device management views.

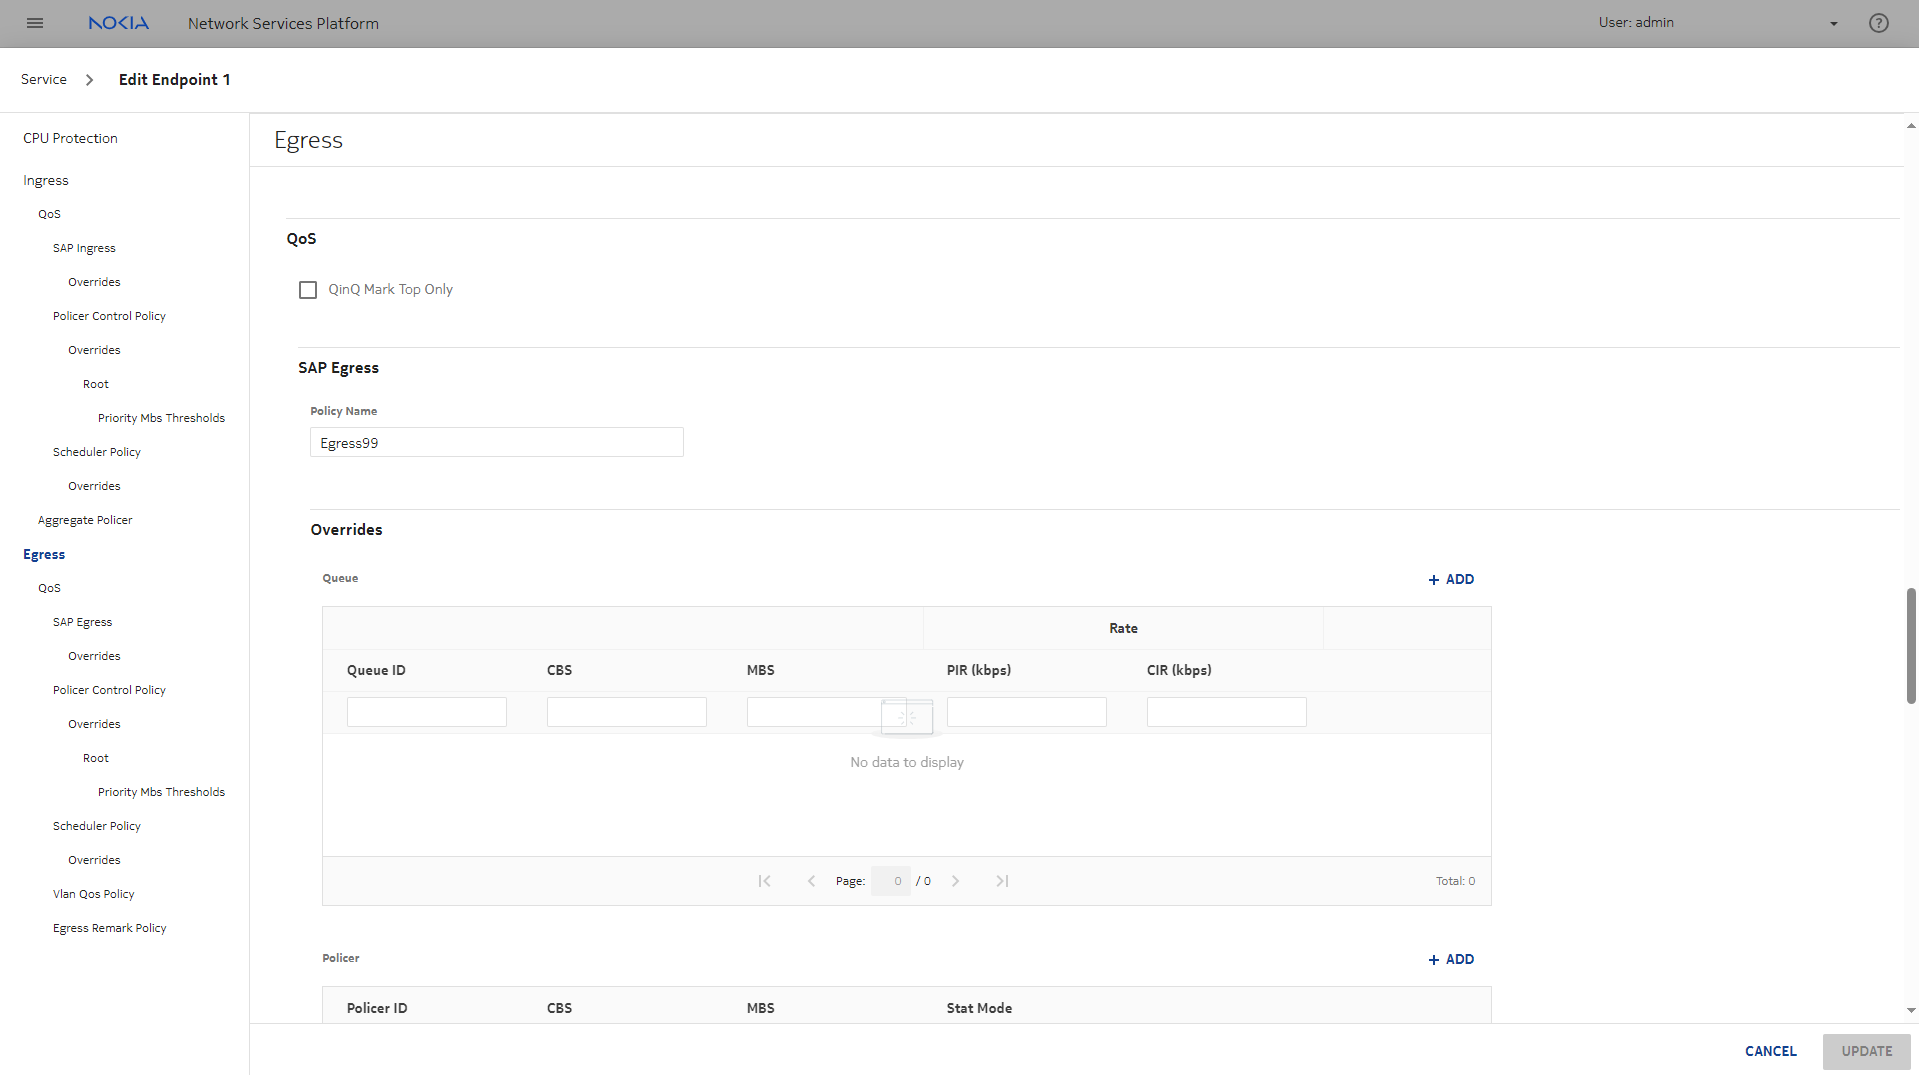
Scroll down to see the egress settings: the egress policy is Egress99.


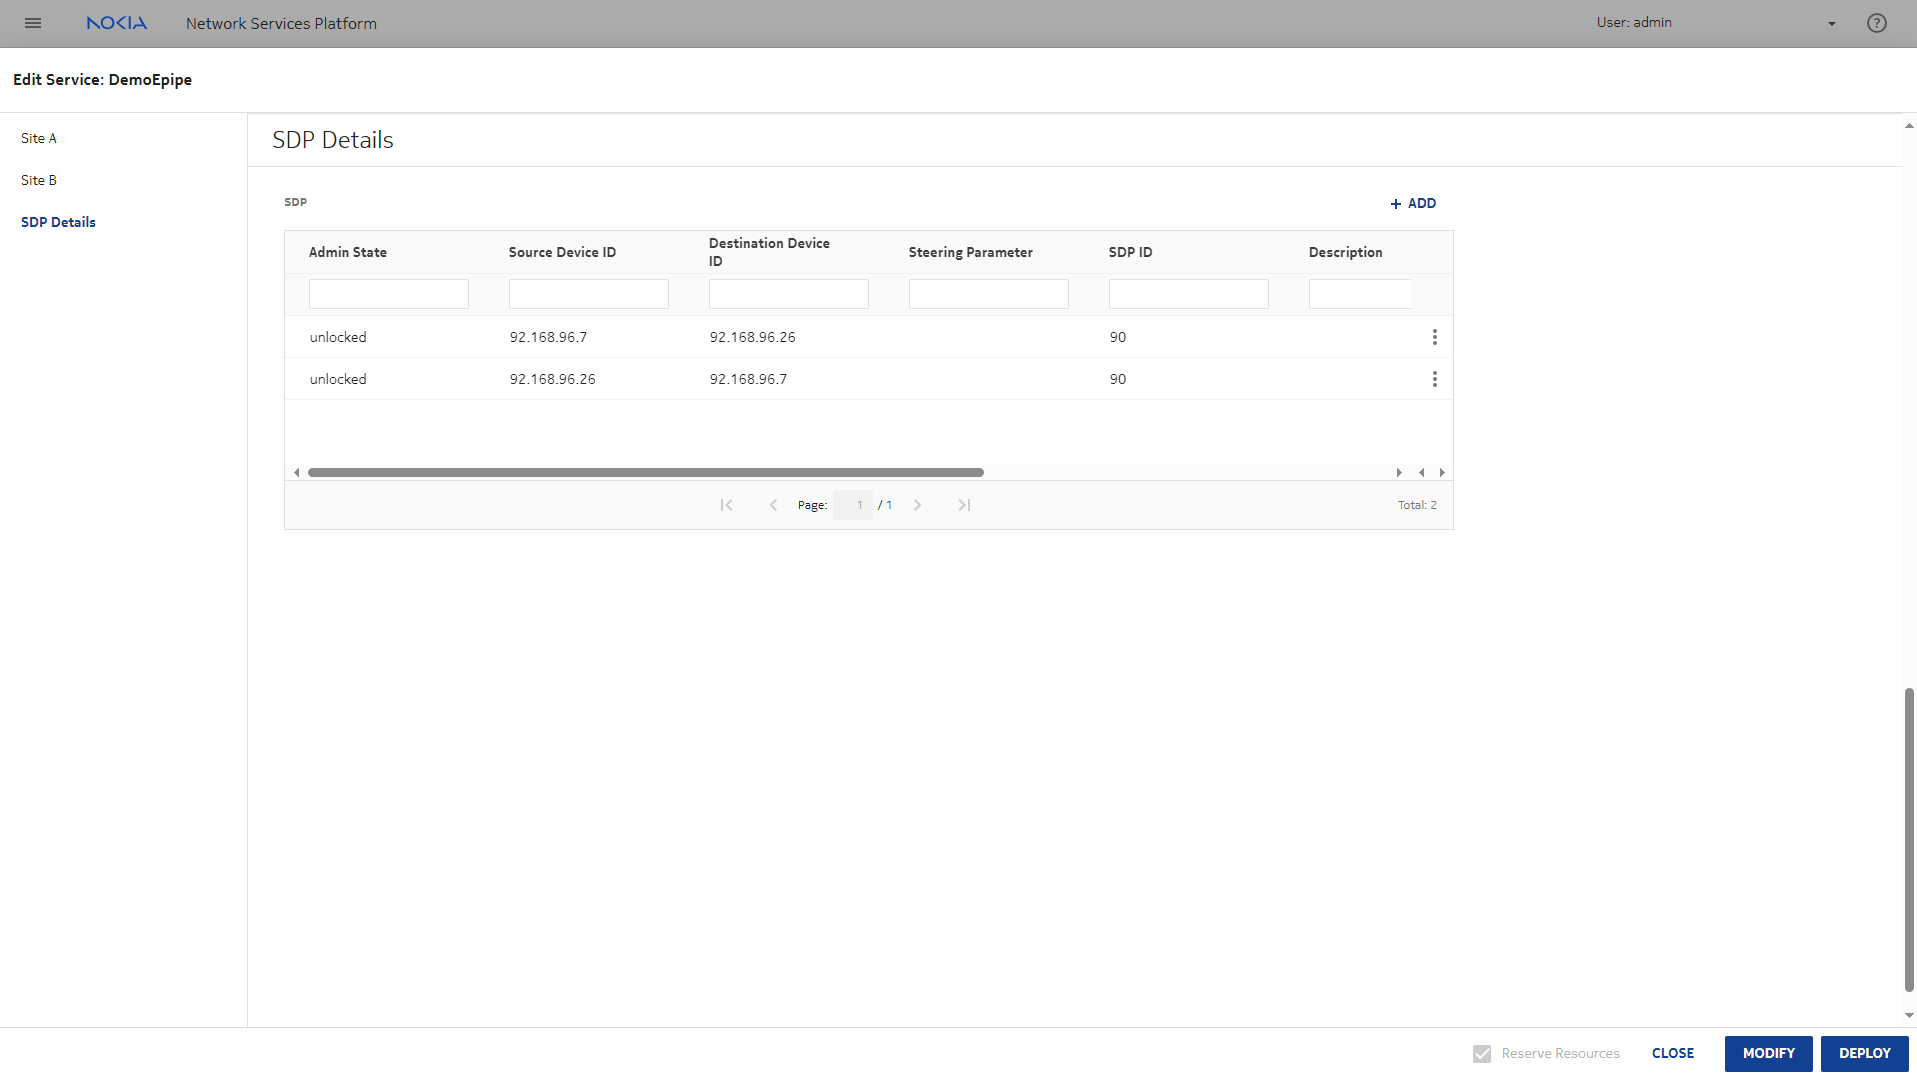
Returning to the Edit Service form, we can see the SDP details, the service destination points. An SDP has been added to the service for each direction.

Verify statistics collection configuration

Now that we have verified that the service is configured, we can confirm that statistics collection has been set up.


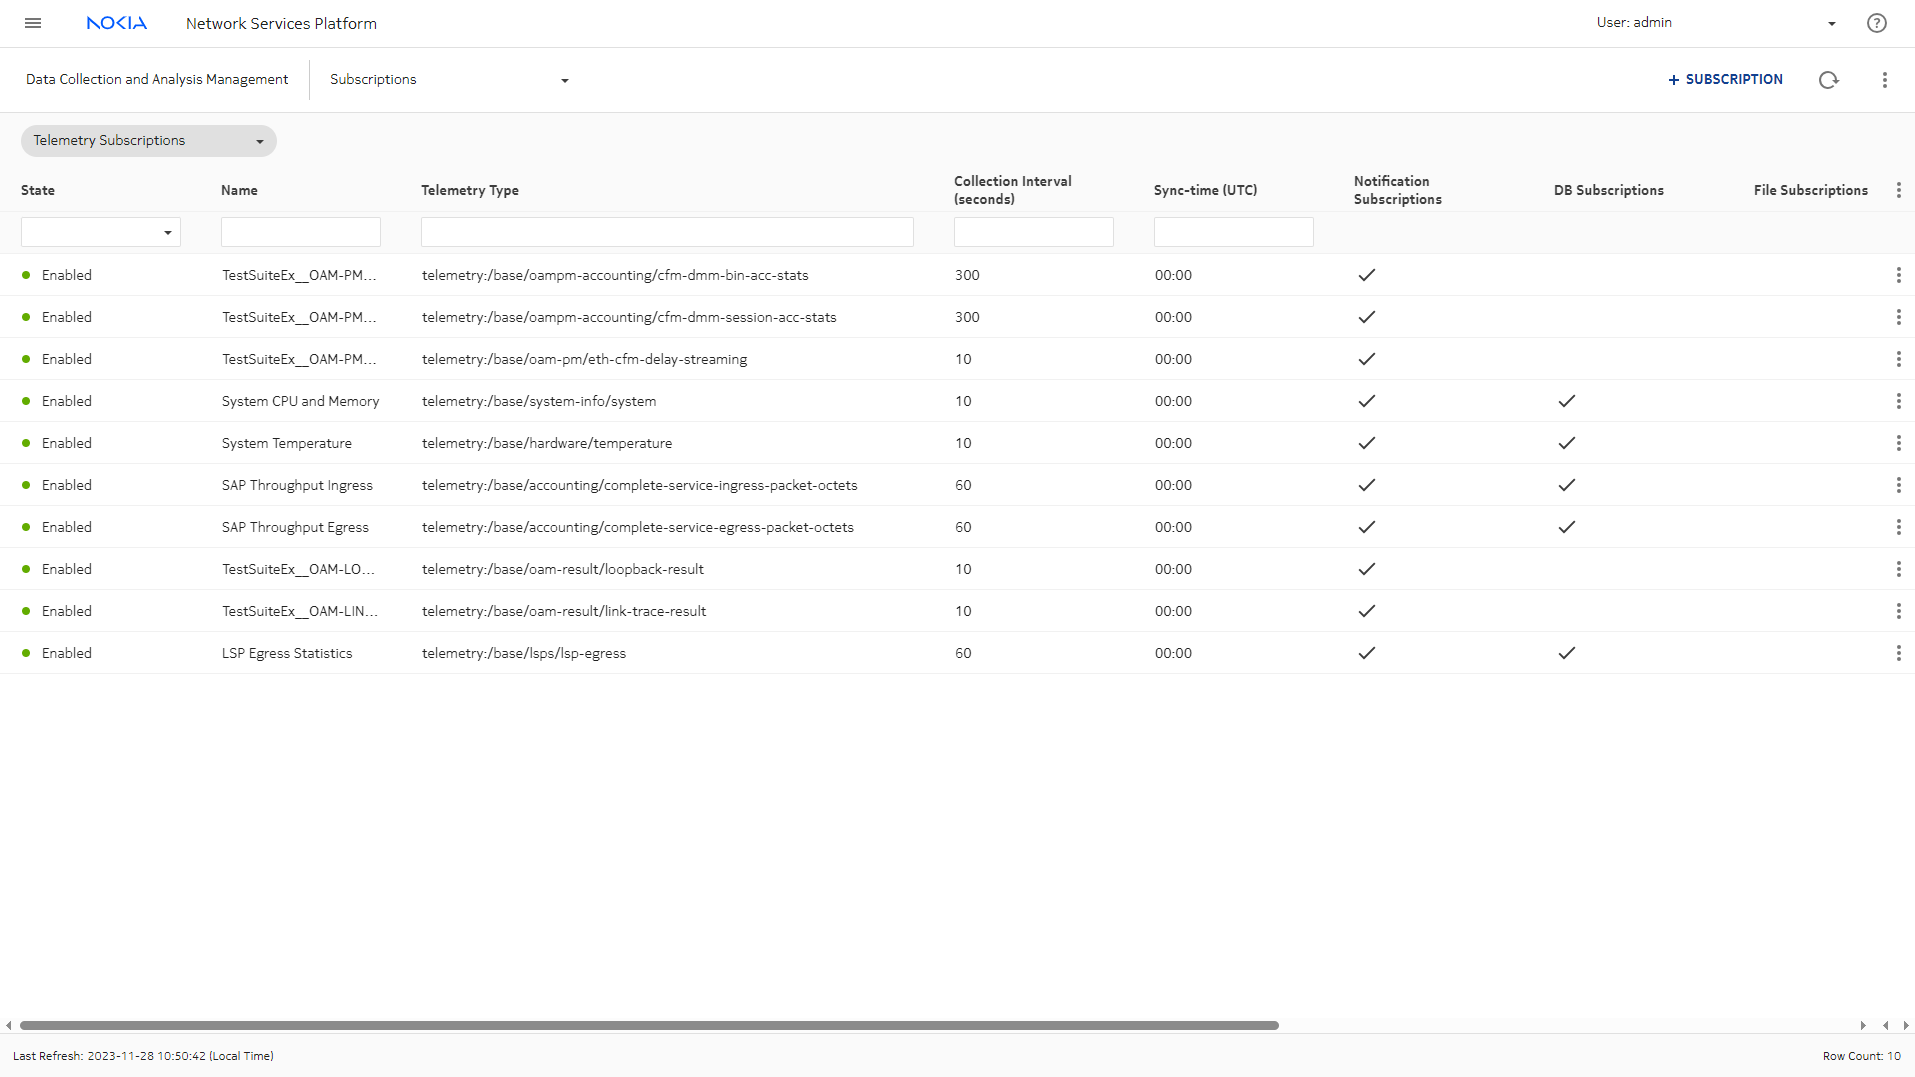
For the report we need to generate, we need to collect statistics for two telemetry types: base/accounting/complete-service-ingress-packet-octets and base/accounting/complete-service-egress-packet-octets.

In the Data Collection and Analysis Management, Subscriptions view, we see that subscriptions have been configured and enabled for each. The collection interval is 60 s, meaning the data will be collected by NSP every minute.

Database subscriptions are enabled: this will make the historical data available to Analytics.


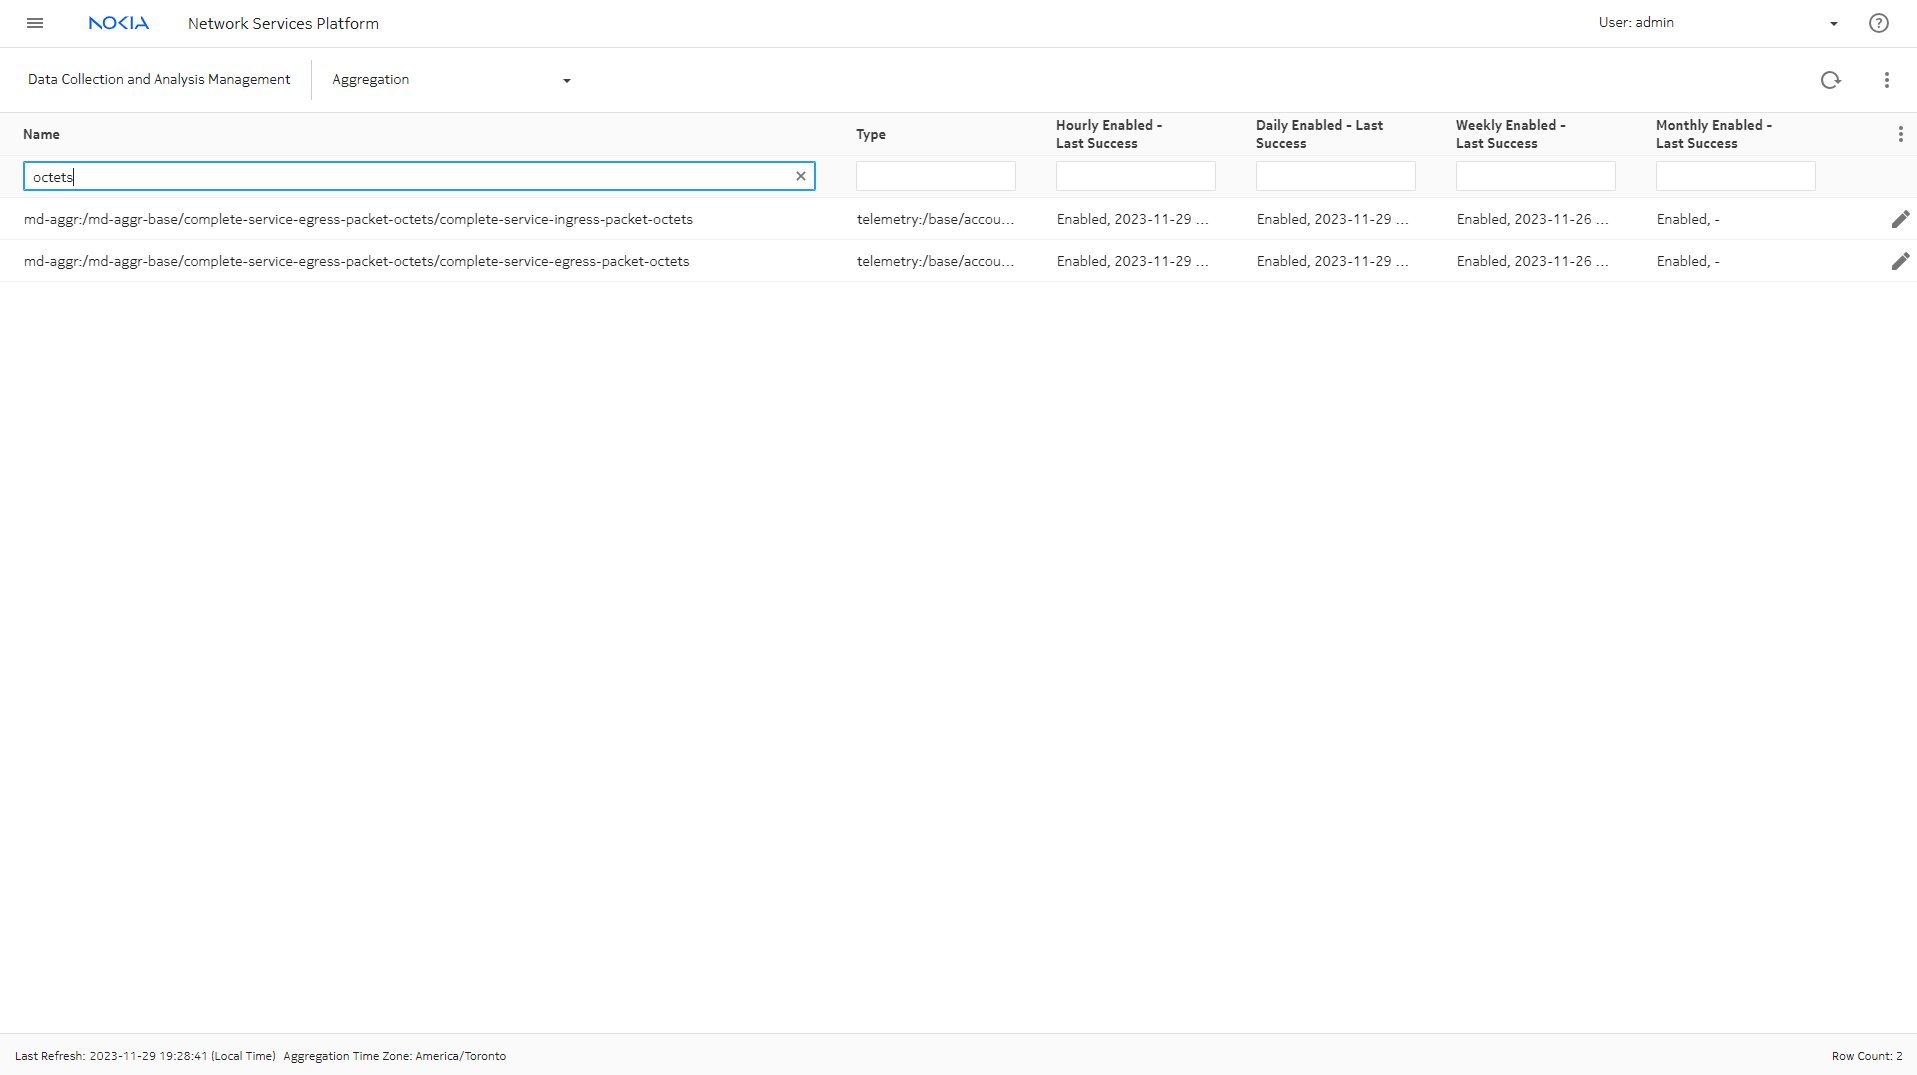
The report we need also reports based on aggregated data. Switching to the Data Collection and Analysis Management, Aggregation view, we’ll take a look at the aggregation settings for the telemetry types.

Here we see that all aggregation types are enabled for the telemetry types of interest. The Last Success Time can also be used to verify that the subscriptions are working. For example, the last success time for daily aggregation should not be longer than a day ago.


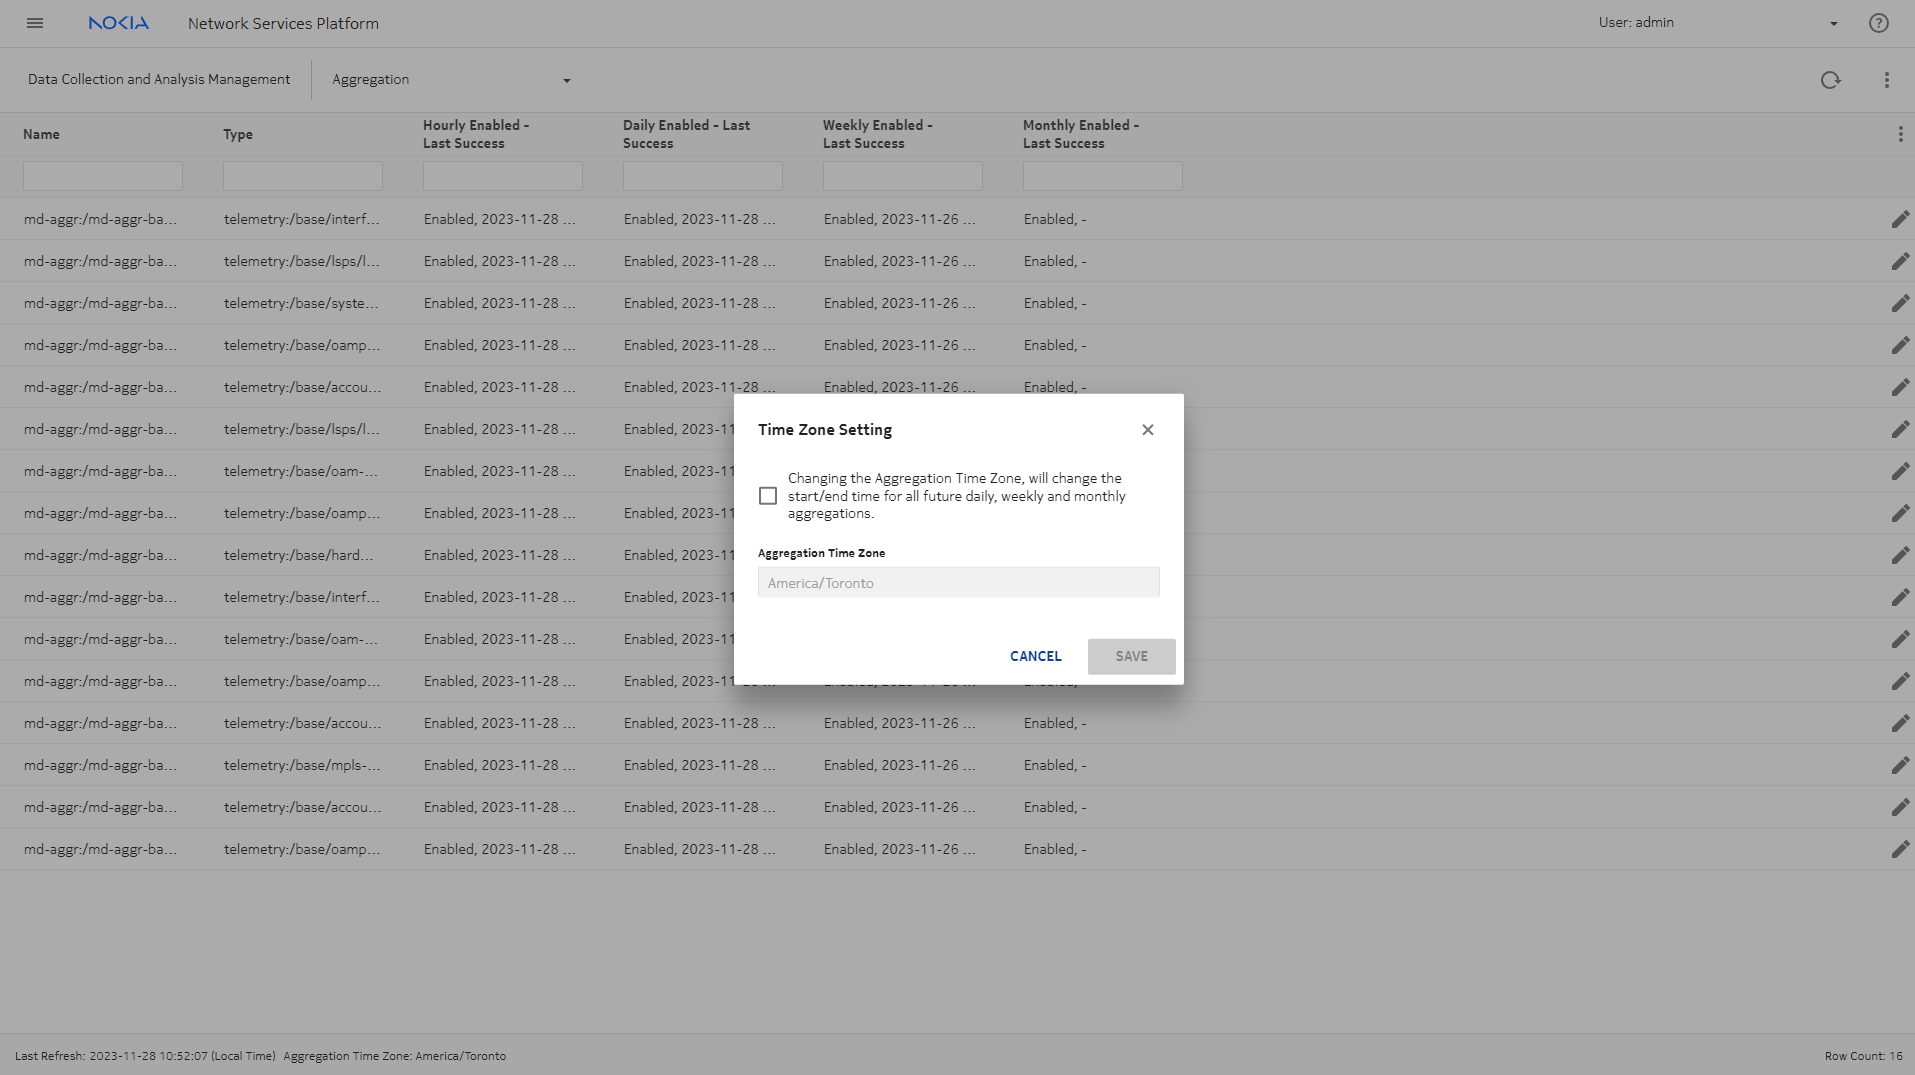
We also need to confirm that the aggregation time zone has been set correctly. If the aggregation time zone doesn’t match the reporting time zone, Analytics will show an error when we try to generate an aggregated report. Click on the More menu at the top of the page and select Time Zone Setting.

The time zone has been set to local time.


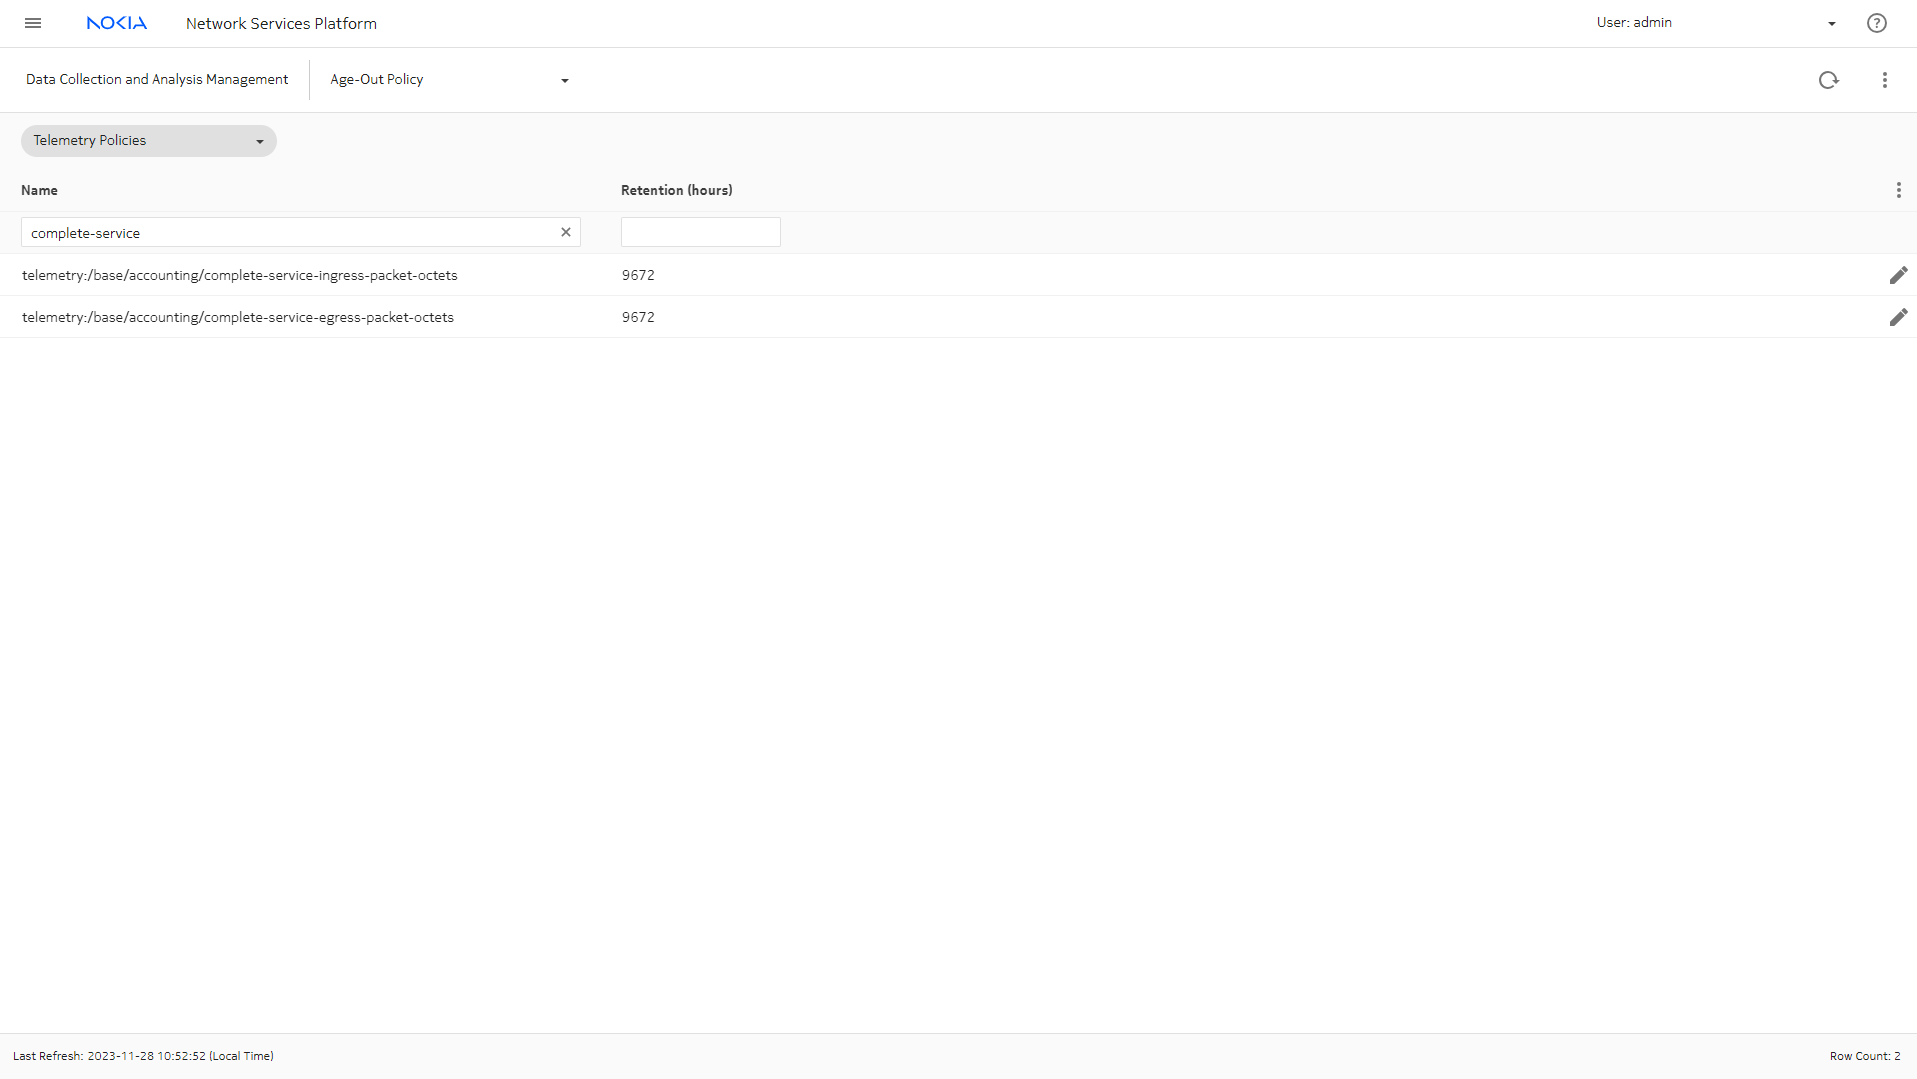
To generate a report using daily or monthly data, we need to ensure we have an appropriate retention policy for the telemetry type. Switching to the Age-Out Policy list, we can see that the retention policy for the telemetry types have been set to the maximum.

Generate the report in Analytics

Now that we’ve confirmed that all the prerequisites are in place, we can run the report.
 

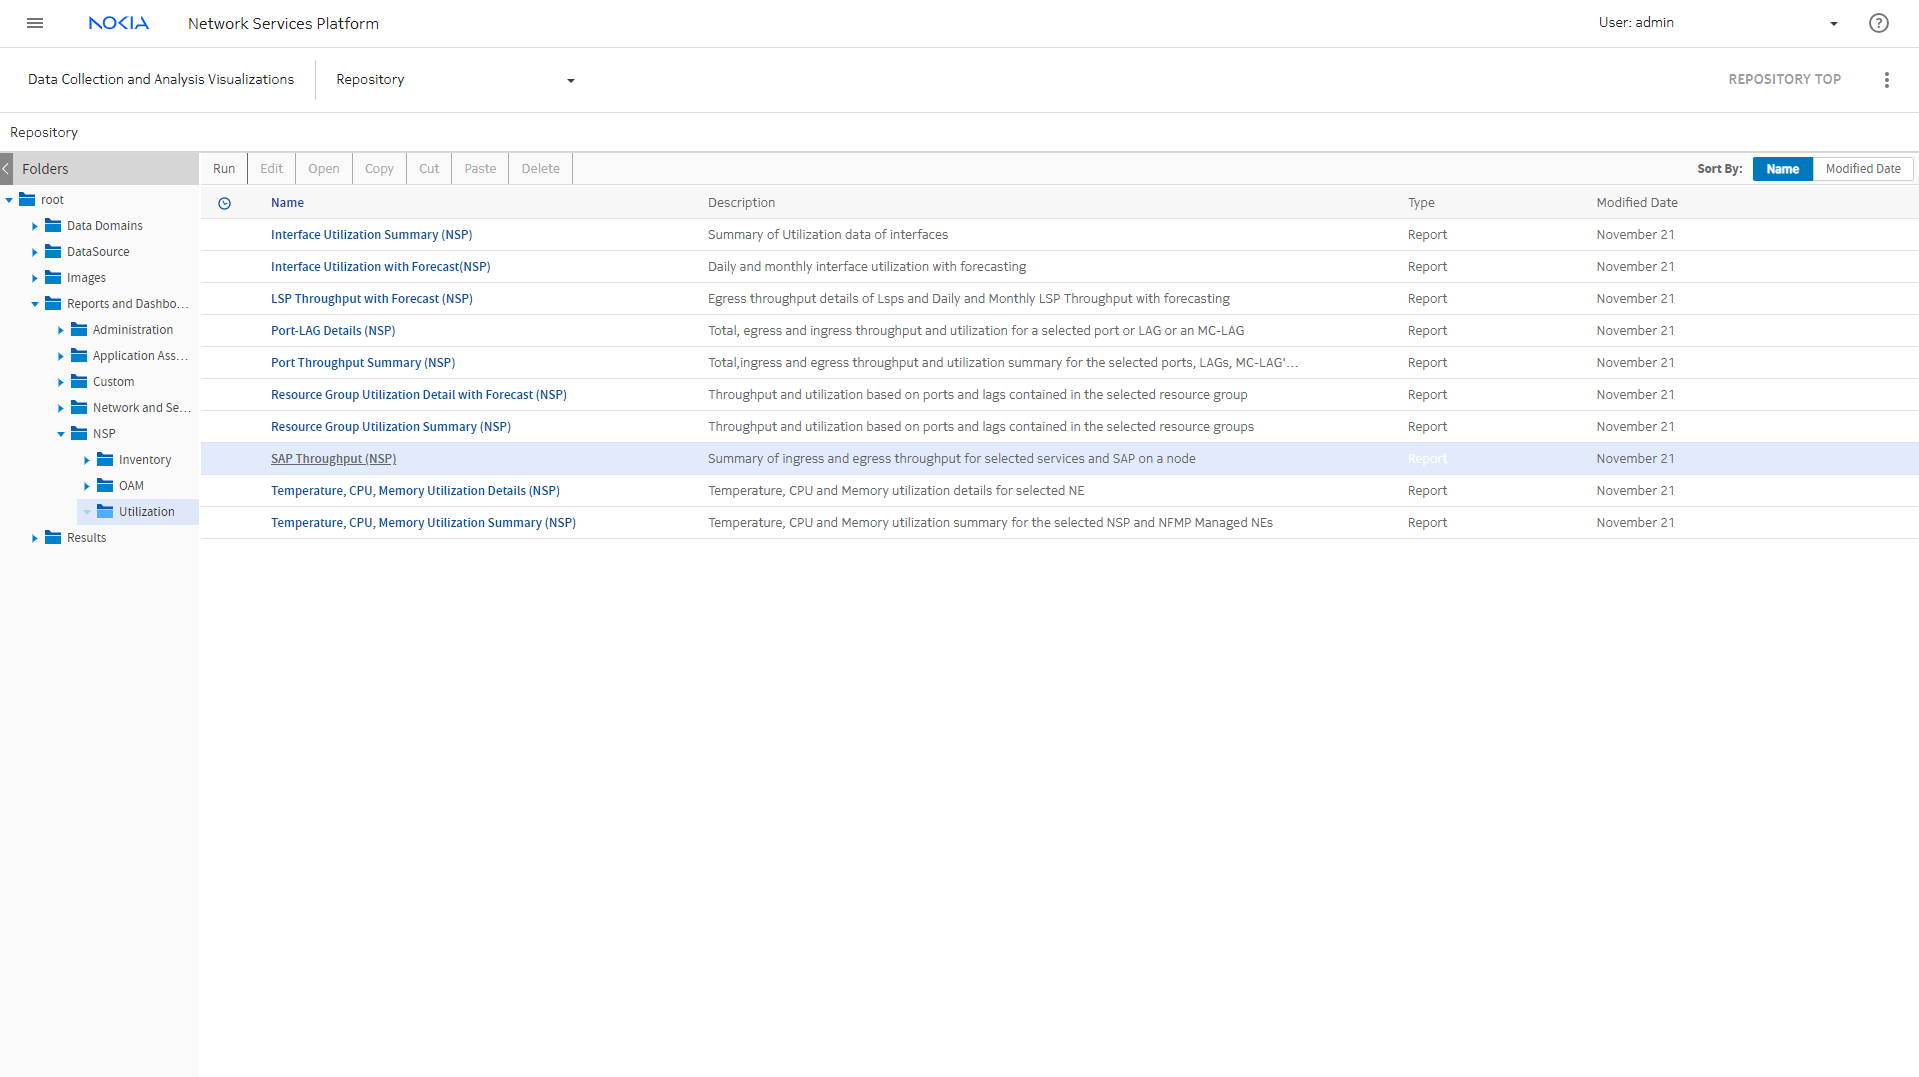
In the Analytics repository, the report we need is under Reports and Dashboards, NSP, Utilization. Navigate through the folders and choose SAP Throughput (NSP).


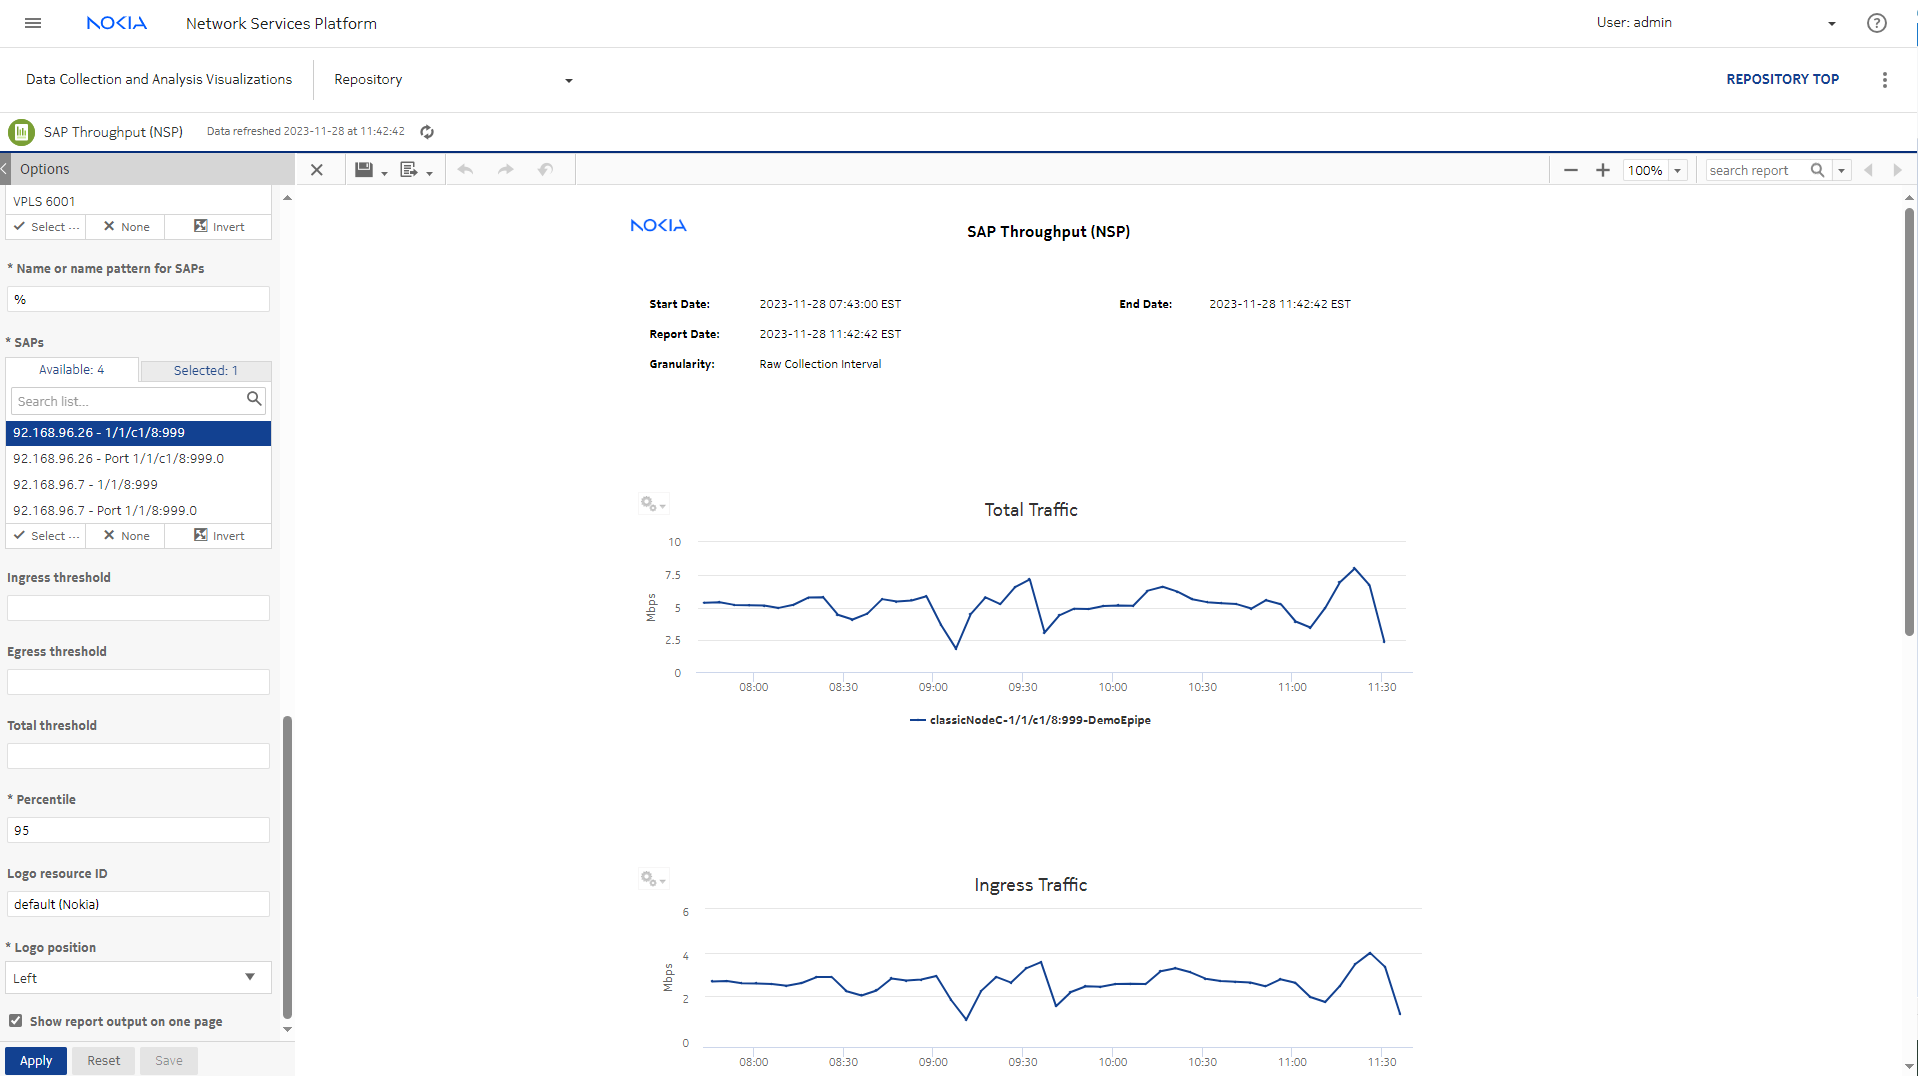
We’ll start with a raw data report.

  1. Select all the NE types.

  2. In the NE list, choose NEs that host the service endpoints.

  3. Choose a customer, a service, and one or more SAPs.

  4. Select the Show report output on one page check box.

  5. Click Apply.

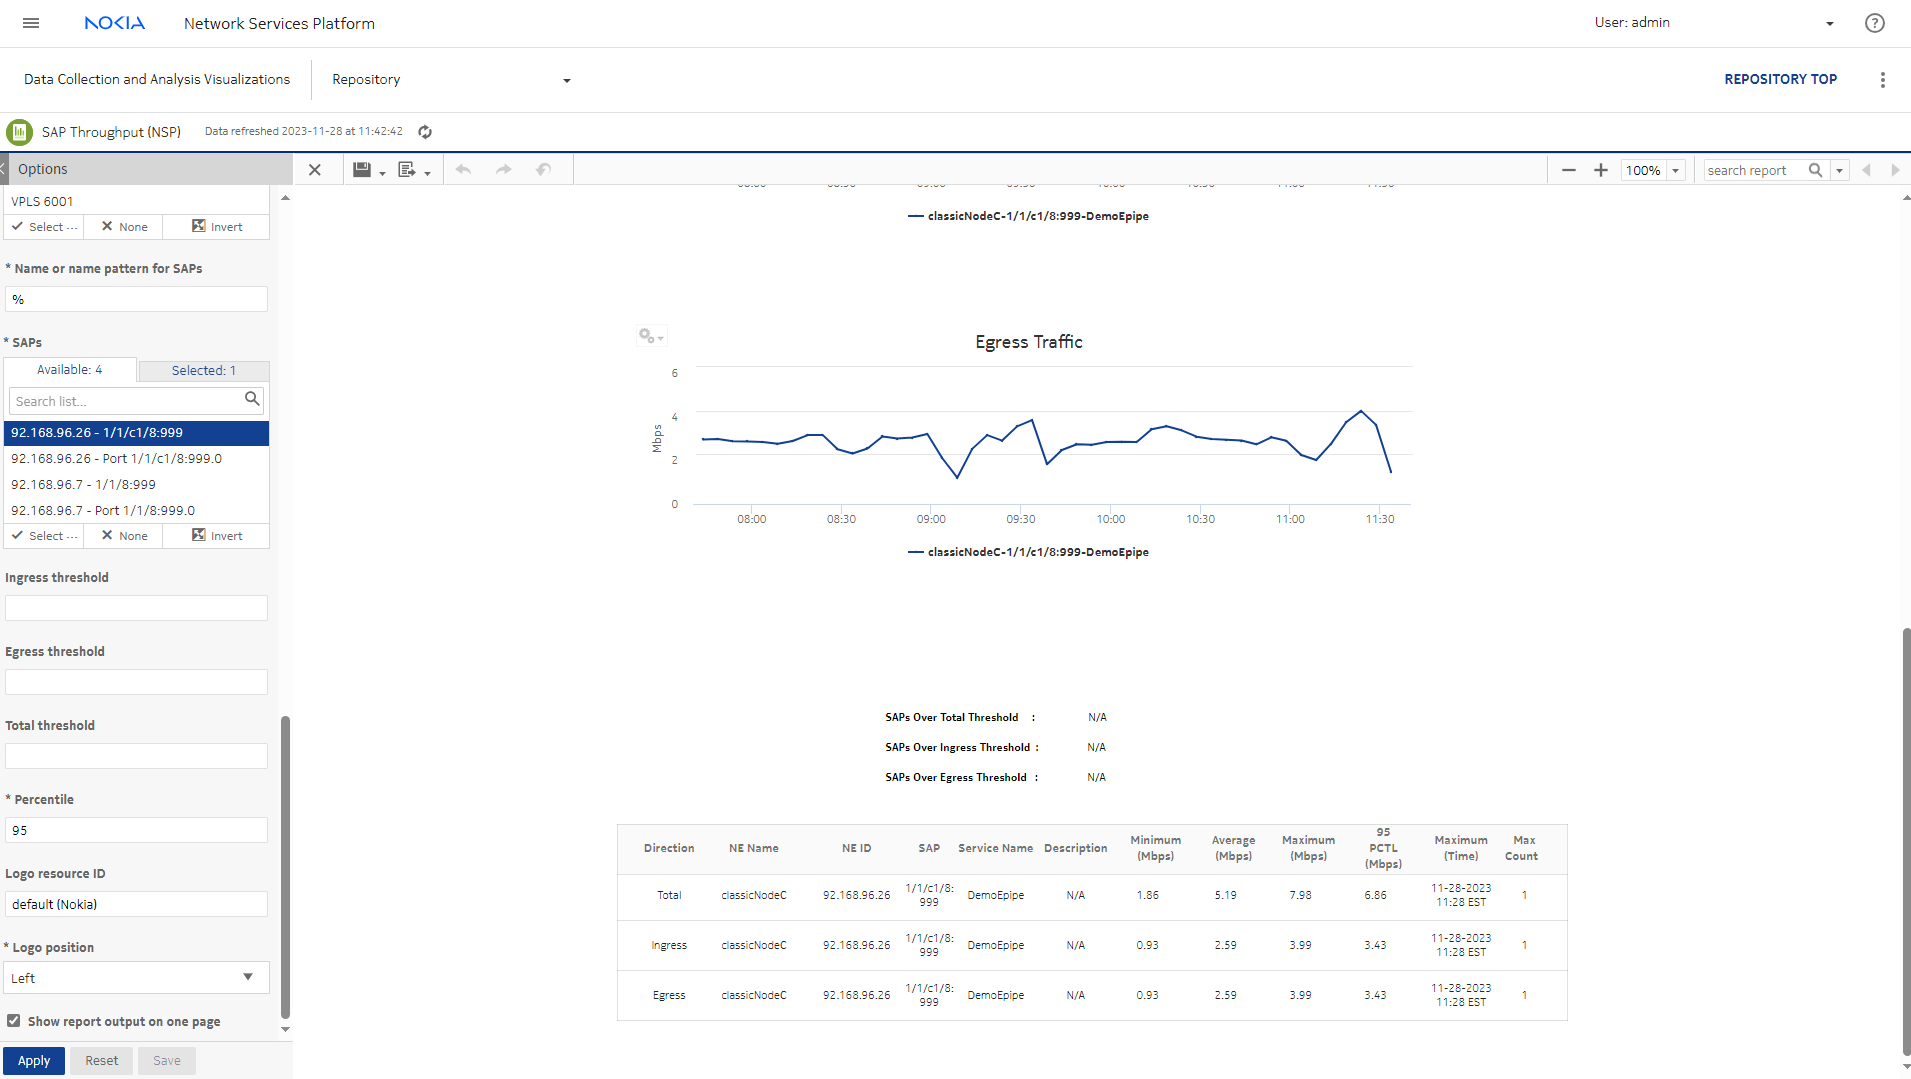
The report shows the raw SAP utilization data.


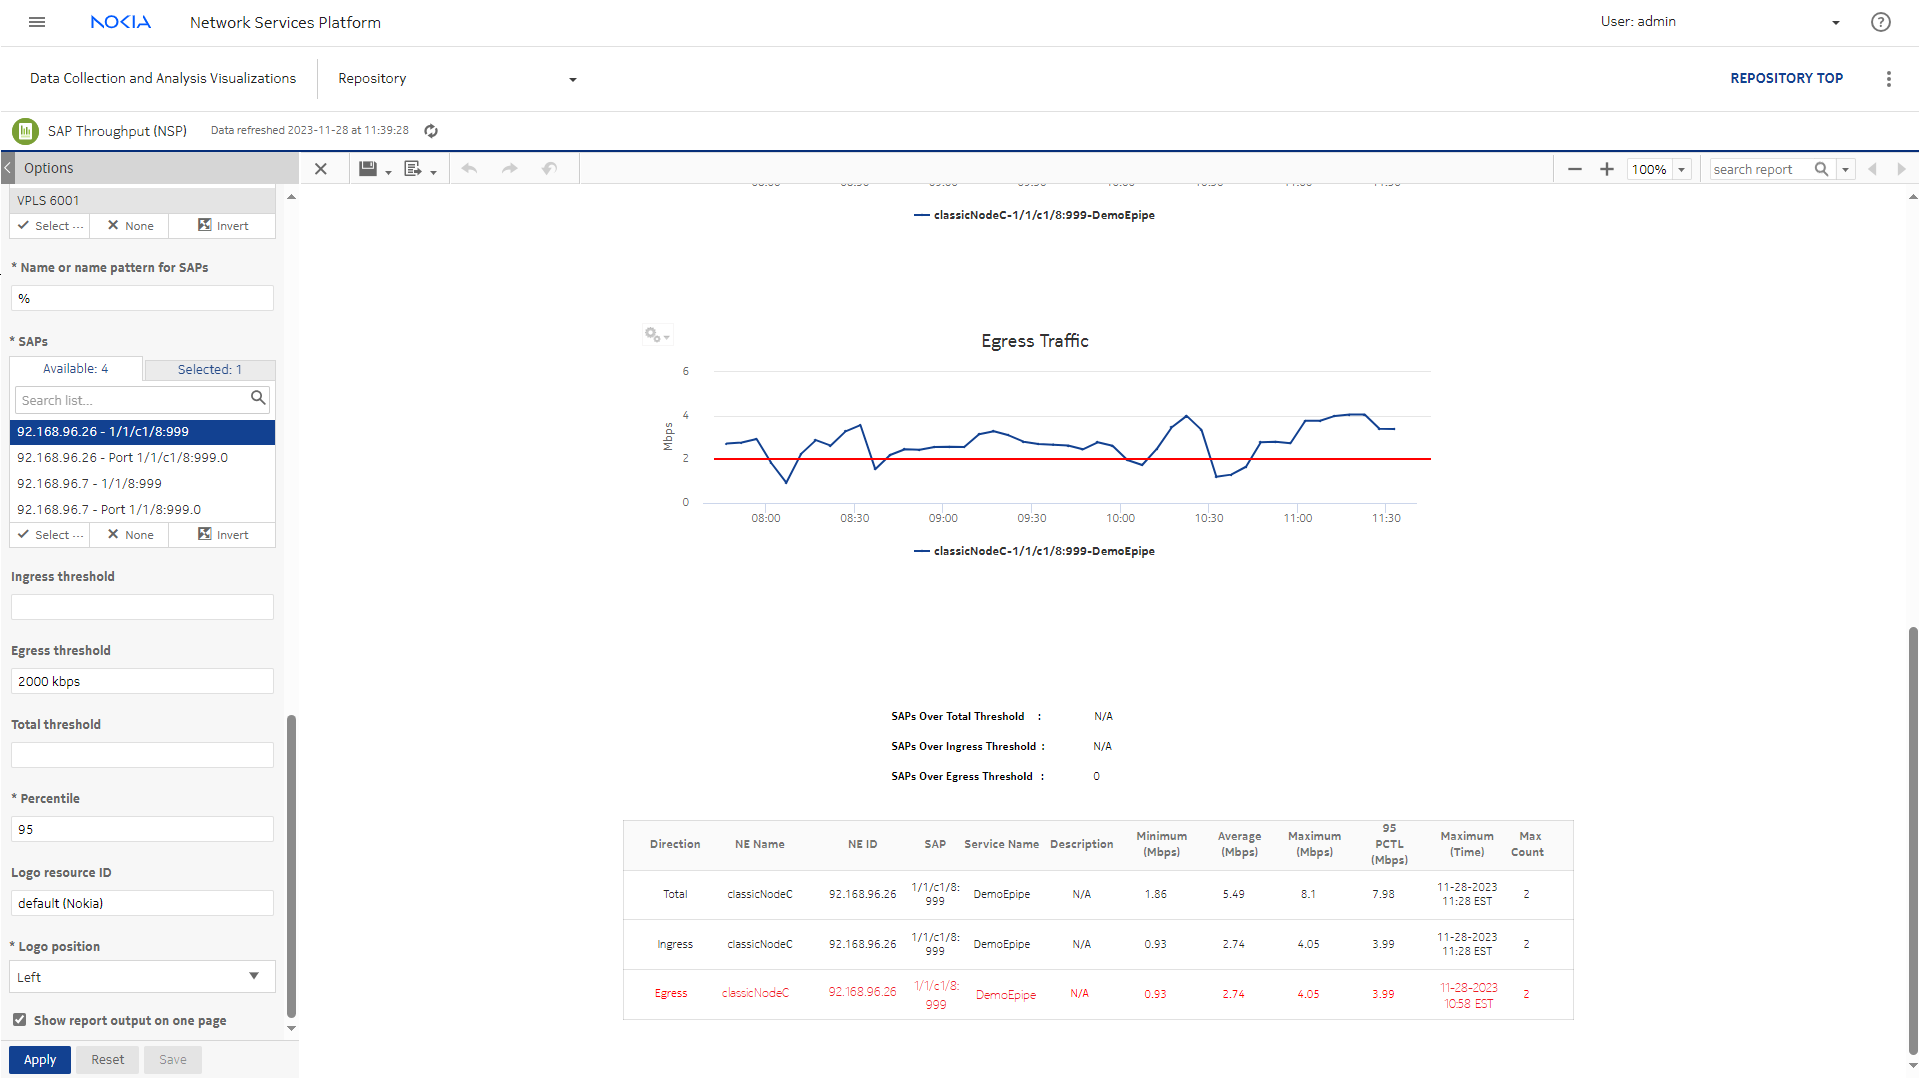
Next, we’ll re-run the report with a threshold. A threshold helps to visualize whether traffic is exceeding expected values.

For example, we’ll set an egress threshold of 2 000 kbps.

The report shows the threshold level on the graphs. If the average throughput rate exceeds the threshold, the table shows the values in red.