Ports and Interfaces Availability Details report
Ports and Interfaces Availability Details report overview
The Ports and Interfaces Availability Details report shows the availability details for ports, LAGs, bundles, and their associated network/access interfaces for all possible modes (network, access, and hybrid).
Use cases
-
Service level agreement—Use the report to validate that port and interface availability meets agreed targets.
-
Troubleshooting—Use the report to determine if a port or interface is currently, or has previously, been unavailable.
Limitations
Prerequisites
To create the report, the availability of interfaces and ports (LAG, bundle, SCADA, and POS) must be determined. An availability framework computes periodic outage time and outage counts from state change records contained in the auxiliary database data dictionary. These periodic values are aggregated to determine the availability of interfaces and ports over a period of time. A periodic table tracks the activity state and availability of interfaces and ports. The availability framework supports the creation of an availability table that aggregates the data in the periodic table based on the periodic synchronization time configured on the system.
Update the interval of Analytics Data Dictionary tables: The object synchronization interval for tables registered for periodic calculation must be configured to run every 15 min by configuring analyticsMODictPeriodicSyncTime in the nms-server.xml file; see How do I synchronize the Analytics data dictionary table data with the NFM-P?. This procedure applies to all availability reports; it can be skipped if it has already been done.
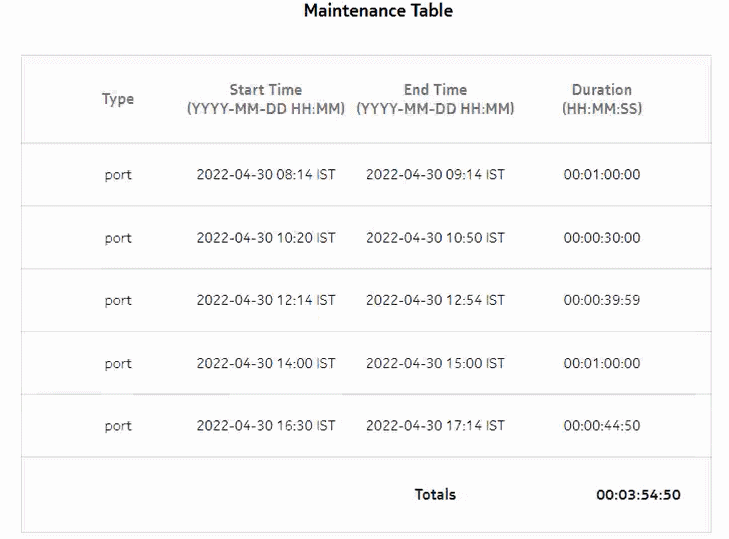
Optionally, you may populate the maintenance window table in the auxiliary database with details of object maintenance; see To add data to the samdb maintenance-window table in an auxiliary database. The report runs if the table is not created or empty; however, maintenance windows are treated as downtime when availability is calculated.
Attributes to track operational state changes
The following table contains the attributes for tracking operational state changes.
Note: The table does not need to be manually enabled as it is system wide; by default, it is enabled for the entire network. Therefore, no action is required to enable the table. The current database sizing tool does not account for availability reports, and the retention time is not configurable. The availability reports are limited.
Table 11-16: Attributes to track operational state changes
|
Dictionary Name |
Input Parameter |
If State Changed |
If State Not Changed | ||
|---|---|---|---|---|---|
|
analytics_bundleInterface |
operationalState |
Returns 1 |
Returns 0 | ||
|
analytics_lagInterface |
operationalState |
Returns 1 |
Returns 0 | ||
|
analytics_PhysicalPort |
operationalState |
Returns 1 |
Returns 0 | ||
|
analytics_Sts12Channel |
operationalState |
Returns 1 |
Returns 0 | ||
|
analytics_ScadaPort |
operationalState |
Returns 1 |
Returns 0 | ||
|
analytics_rtr_ntwInterface |
operationalState |
Returns 1 |
Returns 0 | ||
|
analytics_business_aa_sub |
operationalState |
Returns 1 |
Returns 0 | ||
Report characteristics
The following table lists the principal report characteristics.
Table 11-17: Ports and Interfaces Availability Details report characteristics
Notes:
Note: The 7705 SAR-H is not supported.


