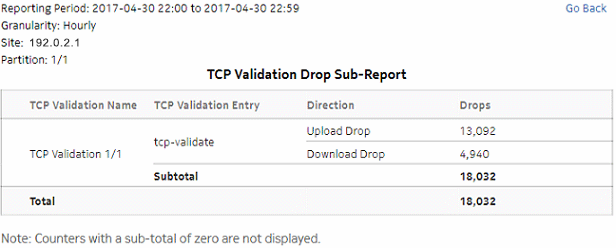
Firewall Drop Dashboard
Firewall Drop Dashboard overview
The Firewall Drop Dashboard shows the AA firewall packet-drop activity on selected AA partitions.
Use cases
Network security monitoring—Use the report to monitor network threats and identify potential attacks.
Policy verification—Use the report to ensure that policies are not dropping legitimate traffic.
Dashboard characteristics
The following table lists the principal dashboard characteristics.
Table 5-1: Firewall Drop Dashboard characteristics
Example
The following figures show the dashlets that the dashboard contains.
Figure 5-1: Top Session Filter Drop dashlet
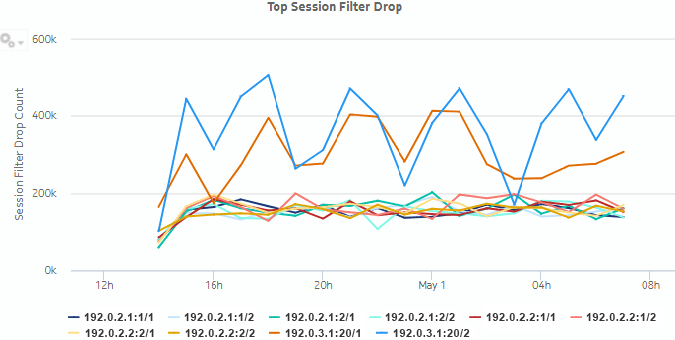
Figure 5-2: Top Session Filter Drop drill-down
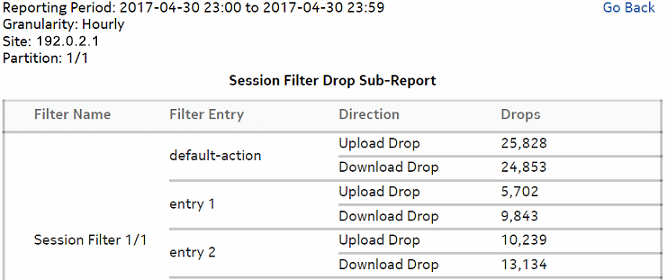
Figure 5-3: Top Policer Drop dashlet
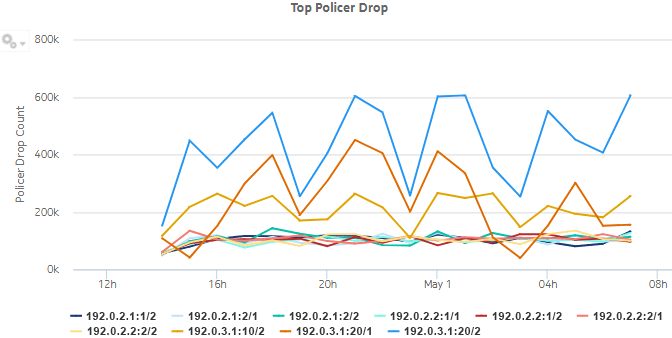
Figure 5-4: Top Policer Drop drill-down
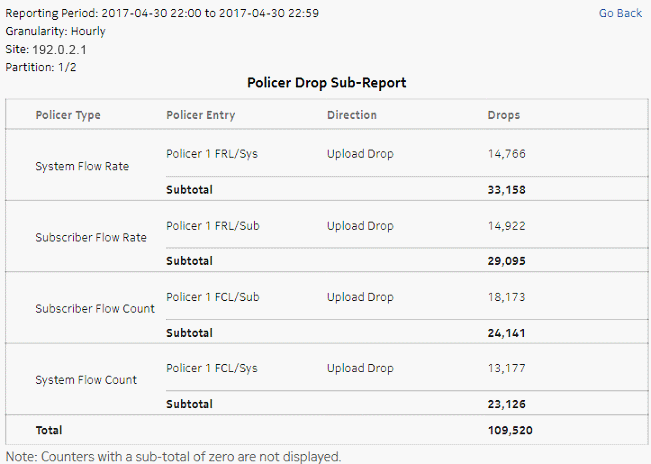
Figure 5-5: Top Anomaly Drop dashlet
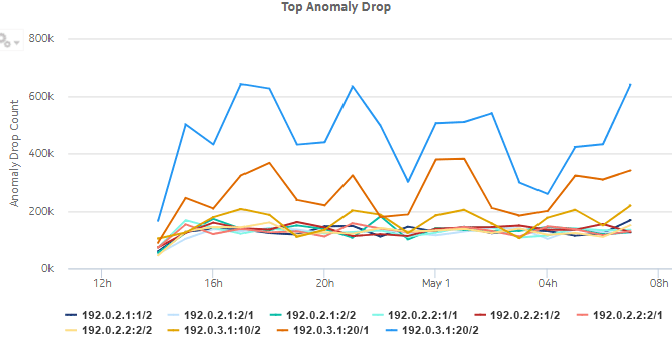
Figure 5-6: Top Anomaly Drop drill-down
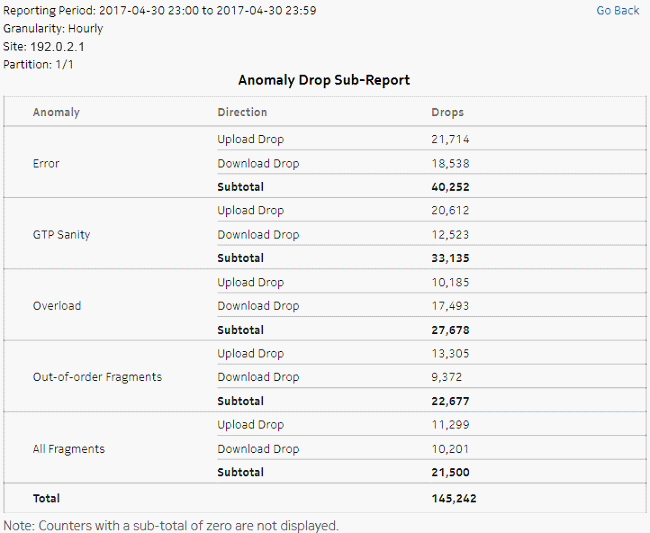
Figure 5-7: Top TCP Validation Drop dashlet
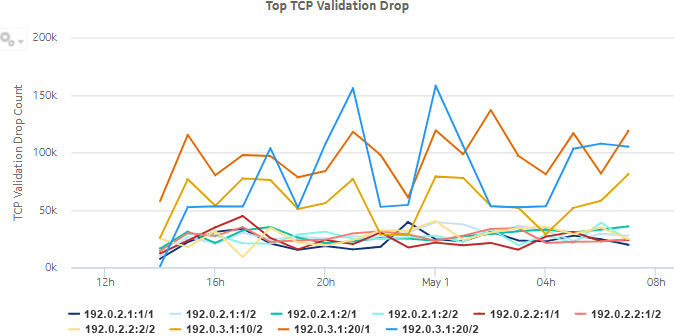
Figure 5-8: Top TCP Validation Drop drill-down
