ISA Performance Dashboard
Dashboard overview
The ISA Performance Dashboard shows the following ISA-AA information:
Use cases
Network resource planning—Use the dashboard to identify excessive ISA-AA usage.
Dashboard characteristics
The following table lists the principal dashboard characteristics.
Table 9-8: ISA Performance Dashboard characteristics
Example
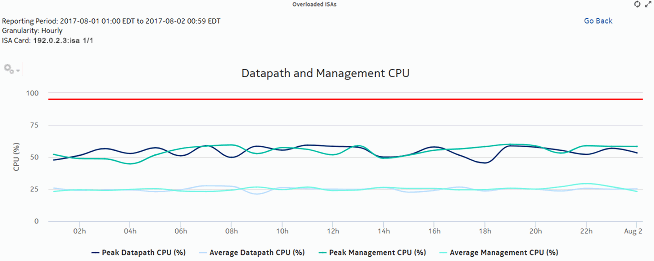
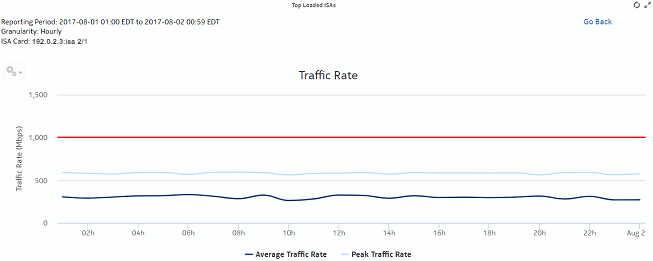
The following figures show the dashlets that the dashboard contains.
Figure 9-13: ISA Performance dashboard—Overloaded ISAs dashlet

Figure 9-14: ISA Performance dashboard—Top Loaded ISAs dashlet

Figure 9-15: ISA Performance dashboard—Overloaded ISAs drill-down

Figure 9-16: ISA Performance dashboard—Top Loaded ISAs drill-down
