Network and Subscriber Dashboard
Dashboard overview
The Network and Subscriber Dashboard shows the following network- and router-level information:
Use cases
Capacity planning—Use the dashboard to examine traffic growth and identify usage patterns for planning future capacity requirements.
Dashboard characteristics
The following table lists the principal dashboard characteristics.
Table 9-9: Network and Subscriber Dashboard characteristics
|
Characteristic |
Value | |
|---|---|---|
|
Statistics type |
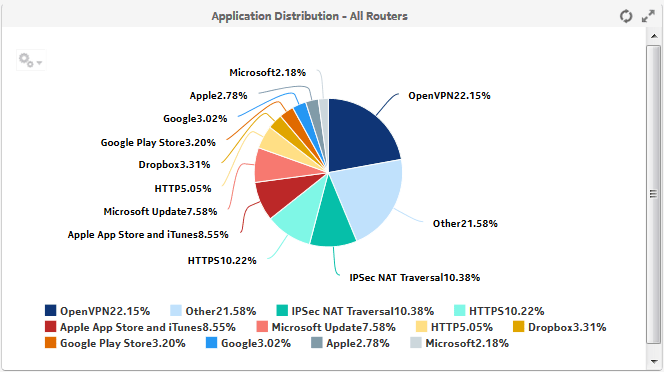
Top Routers - Download Bandwidth Per Router—AA Accounting per partition application group Total Download Bandwidth - All Routers—AA Accounting per partition application group Total Upload Bandwidth - All Routers—AA Accounting per partition application group Top Routers - Active Subscribers Per Router—AA Accounting network performance Application Group Distribution - Selected Routers—AA Accounting per partition application group Application Distribution - All Routers—AA Accounting per partition application | |
|
NSP Flow Collector required |
No | |
|
Domains |
Residential / Wi-Fi (ESM) Mobile Wi-Fi (DSM) Business | |
|
Report inputs |
Prompt |
Notes |
|
End date |
Calendar date or relative date (for example, two days ago) and time | |
|
Report range |
Length of time to be reported, in minutes (minutes, min), hours (hours, h), days (days, d), weeks (w), or months (months, m) | |
|
Node Type |
Search using partial names or wildcard (%). Select individual items or click Select All. | |
|
Site | ||
|
Rank |
Number of items to report | |
|
Bandwidth Percentage Threshold |
— | |
|
Drill-down support |
Yes—Application Group Distribution - Selected Routers dashlet only; display a table of the top applications in the selected application group | |
Example
The following figures show the dashlets that the dashboard contains.
Figure 9-17: Top Routers - Download Bandwidth Per Router dashlet
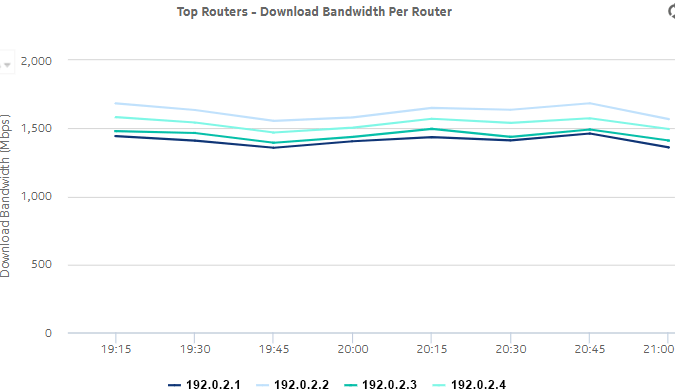
Figure 9-18: Top Routers - Active Subscribers Per Router dashlet
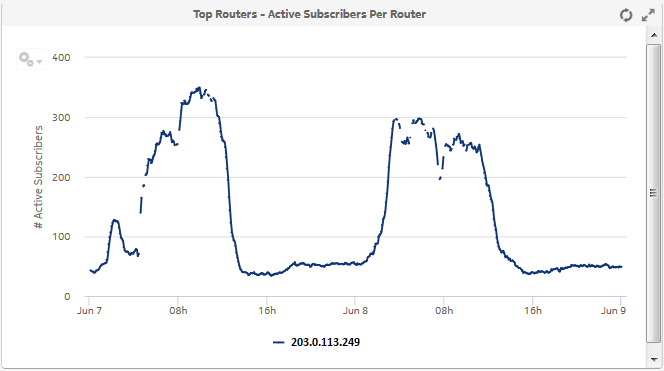
Figure 9-19: Total Download Bandwidth - All Routers dashlet
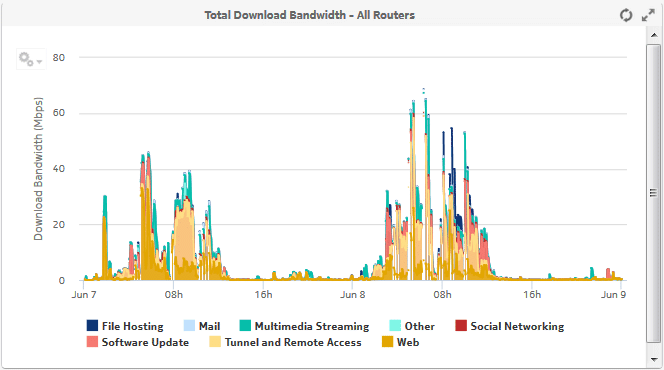
Figure 9-20: Application Group Distribution — Selected Routers dashlet
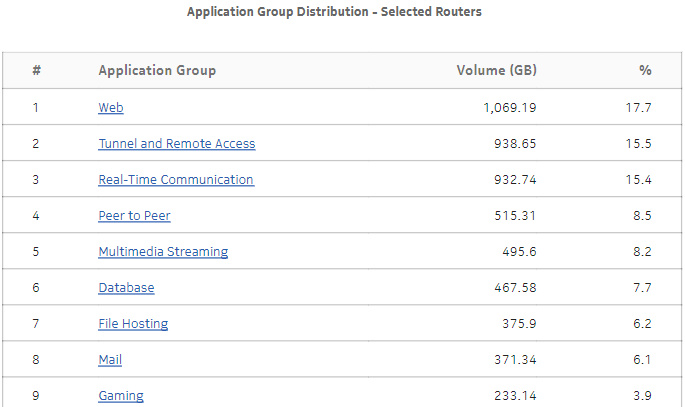
Figure 9-21: Application Group Distribution - Selected Routers drill-down
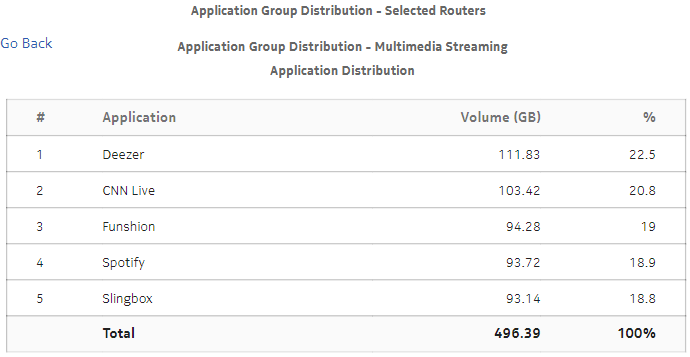
Figure 9-22: Total Upload Bandwidth - All Routers dashlet
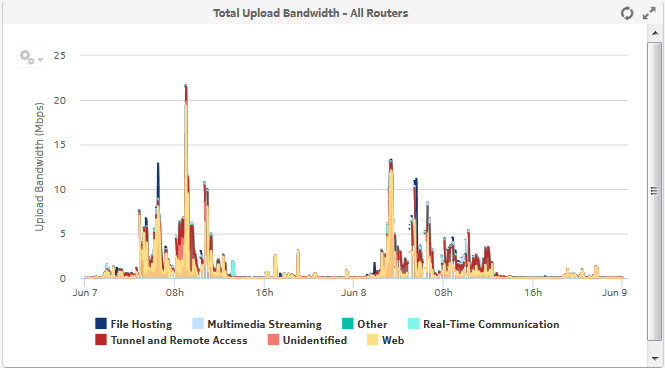
Figure 9-23: Application Distribution - All Routers dashlet
