TCP Performance Dashboard
Dashboard overview
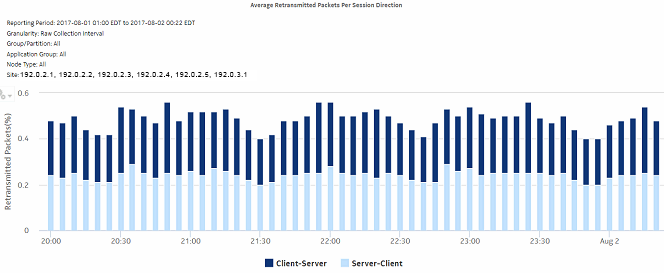
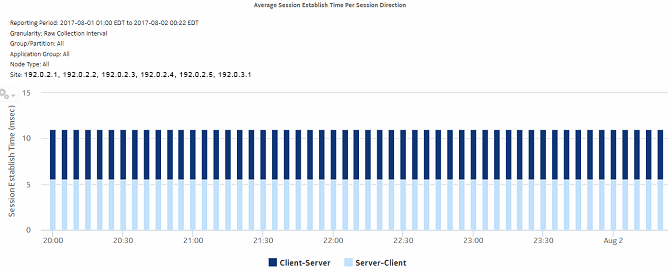
The TCP Performance Dashboard shows network performance in terms of the number of retransmitted packets and the time taken to establish a user session.
Use cases
User quality of experience—Use the report to anticipate user QoE issues by monitoring TCP performance to identify potential network issues.
Dashboard characteristics
The following table lists the principal dashboard characteristics.
Table 9-10: TCP Performance Dashboard characteristics
Example
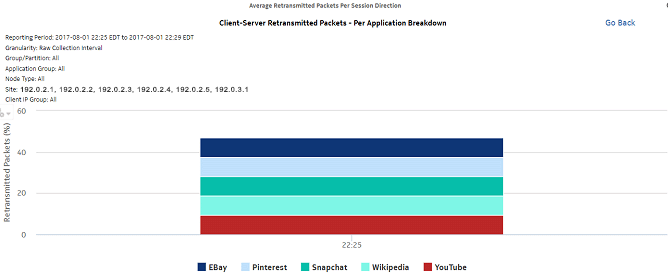
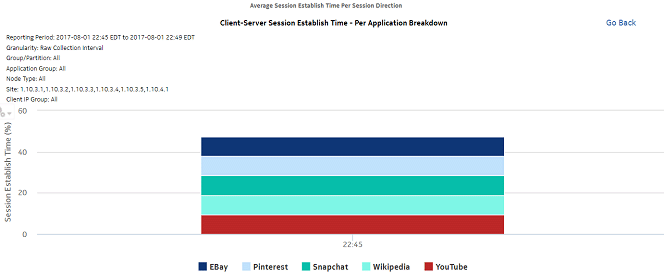
The following figures show the dashlets that the dashboard contains.
Figure 9-24: Average Retransmitted Packets Per Session Direction dashlet

Figure 9-25: Average Session Establish Time Per Session Direction dashlet

Figure 9-26: Average Retransmitted Packets Per Session Direction drill-down

Figure 9-27: Average Session Establish Time Per Session Direction drill-down
