TCP Performance Report - Worst Performing Applications report
TCP Performance Report - Worst Performing Applications report overview
The TCP Performance Report - Worst Performing Applications report shows the most poorly performing applications in terms of retransmitted packets or session establishment delay.
Use cases
User quality of experience—Use the report to identify low-quality application delivery and address user QoE issues by monitoring TCP performance to see the worst performing applications.
Report characteristics
The following table lists the principal report characteristics.
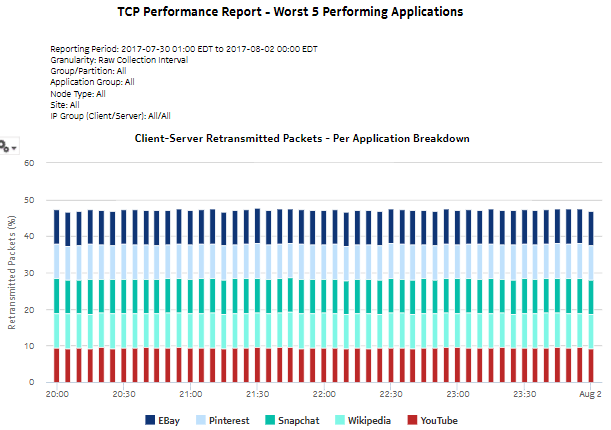
Table 9-11: TCP Performance Report - Worst Performing Applications report characteristics
Characteristic |
Value |
Statistics type |
AA Cflowd TCP performance application
Note: Cflowd aggregation per IP group must be enabled. |
NSP Flow Collector required |
Yes |
Domains |
Residential / Wi-Fi (ESM)
Mobile
Wi-Fi (DSM)
Business |
Report inputs |
Prompt |
Notes |
End date |
Calendar date or relative date (for example, two days ago) and time |
Granularity |
Aggregation types:
-
None (raw data)
-
Hourly
-
Daily
-
Monthly |
Report range |
Length of time to be reported, in minutes (minutes, min), hours (hours, h), days (days, d), weeks (w), or months (months, m) |
Node Type |
Search using partial names or wildcard (%).
Select individual items or click Select All. |
Node |
Group/Partition |
Application Group |
Top Applications |
Number of items to report |
Client IP Group |
Search using partial names or wildcard (%).
Select individual items or click Select All. |
Server IP Group |
Metrics |
Retransmitted packets, session establish time |
Direction |
Client-server, server-client |
Drill-down support |
No |
Example
The following figure shows a report example.