Creating an ad hoc report
Use case overview
This article shows how to create an ad hoc report in Analytics. In this use case, we want to trigger action for link expansion if a link has throughput exceeding a pre-defined capacity. To aid in making the decision, we’ll create a report showing the data we need.
Let’s go
To create a custom report, we’ll open the Adhoc Report Design view.
The information we’ll be tracking is in the Port Domain.
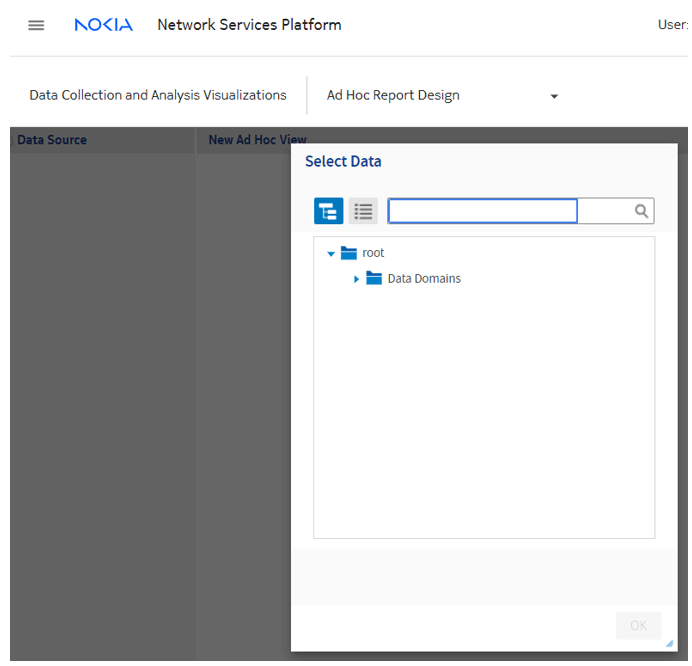
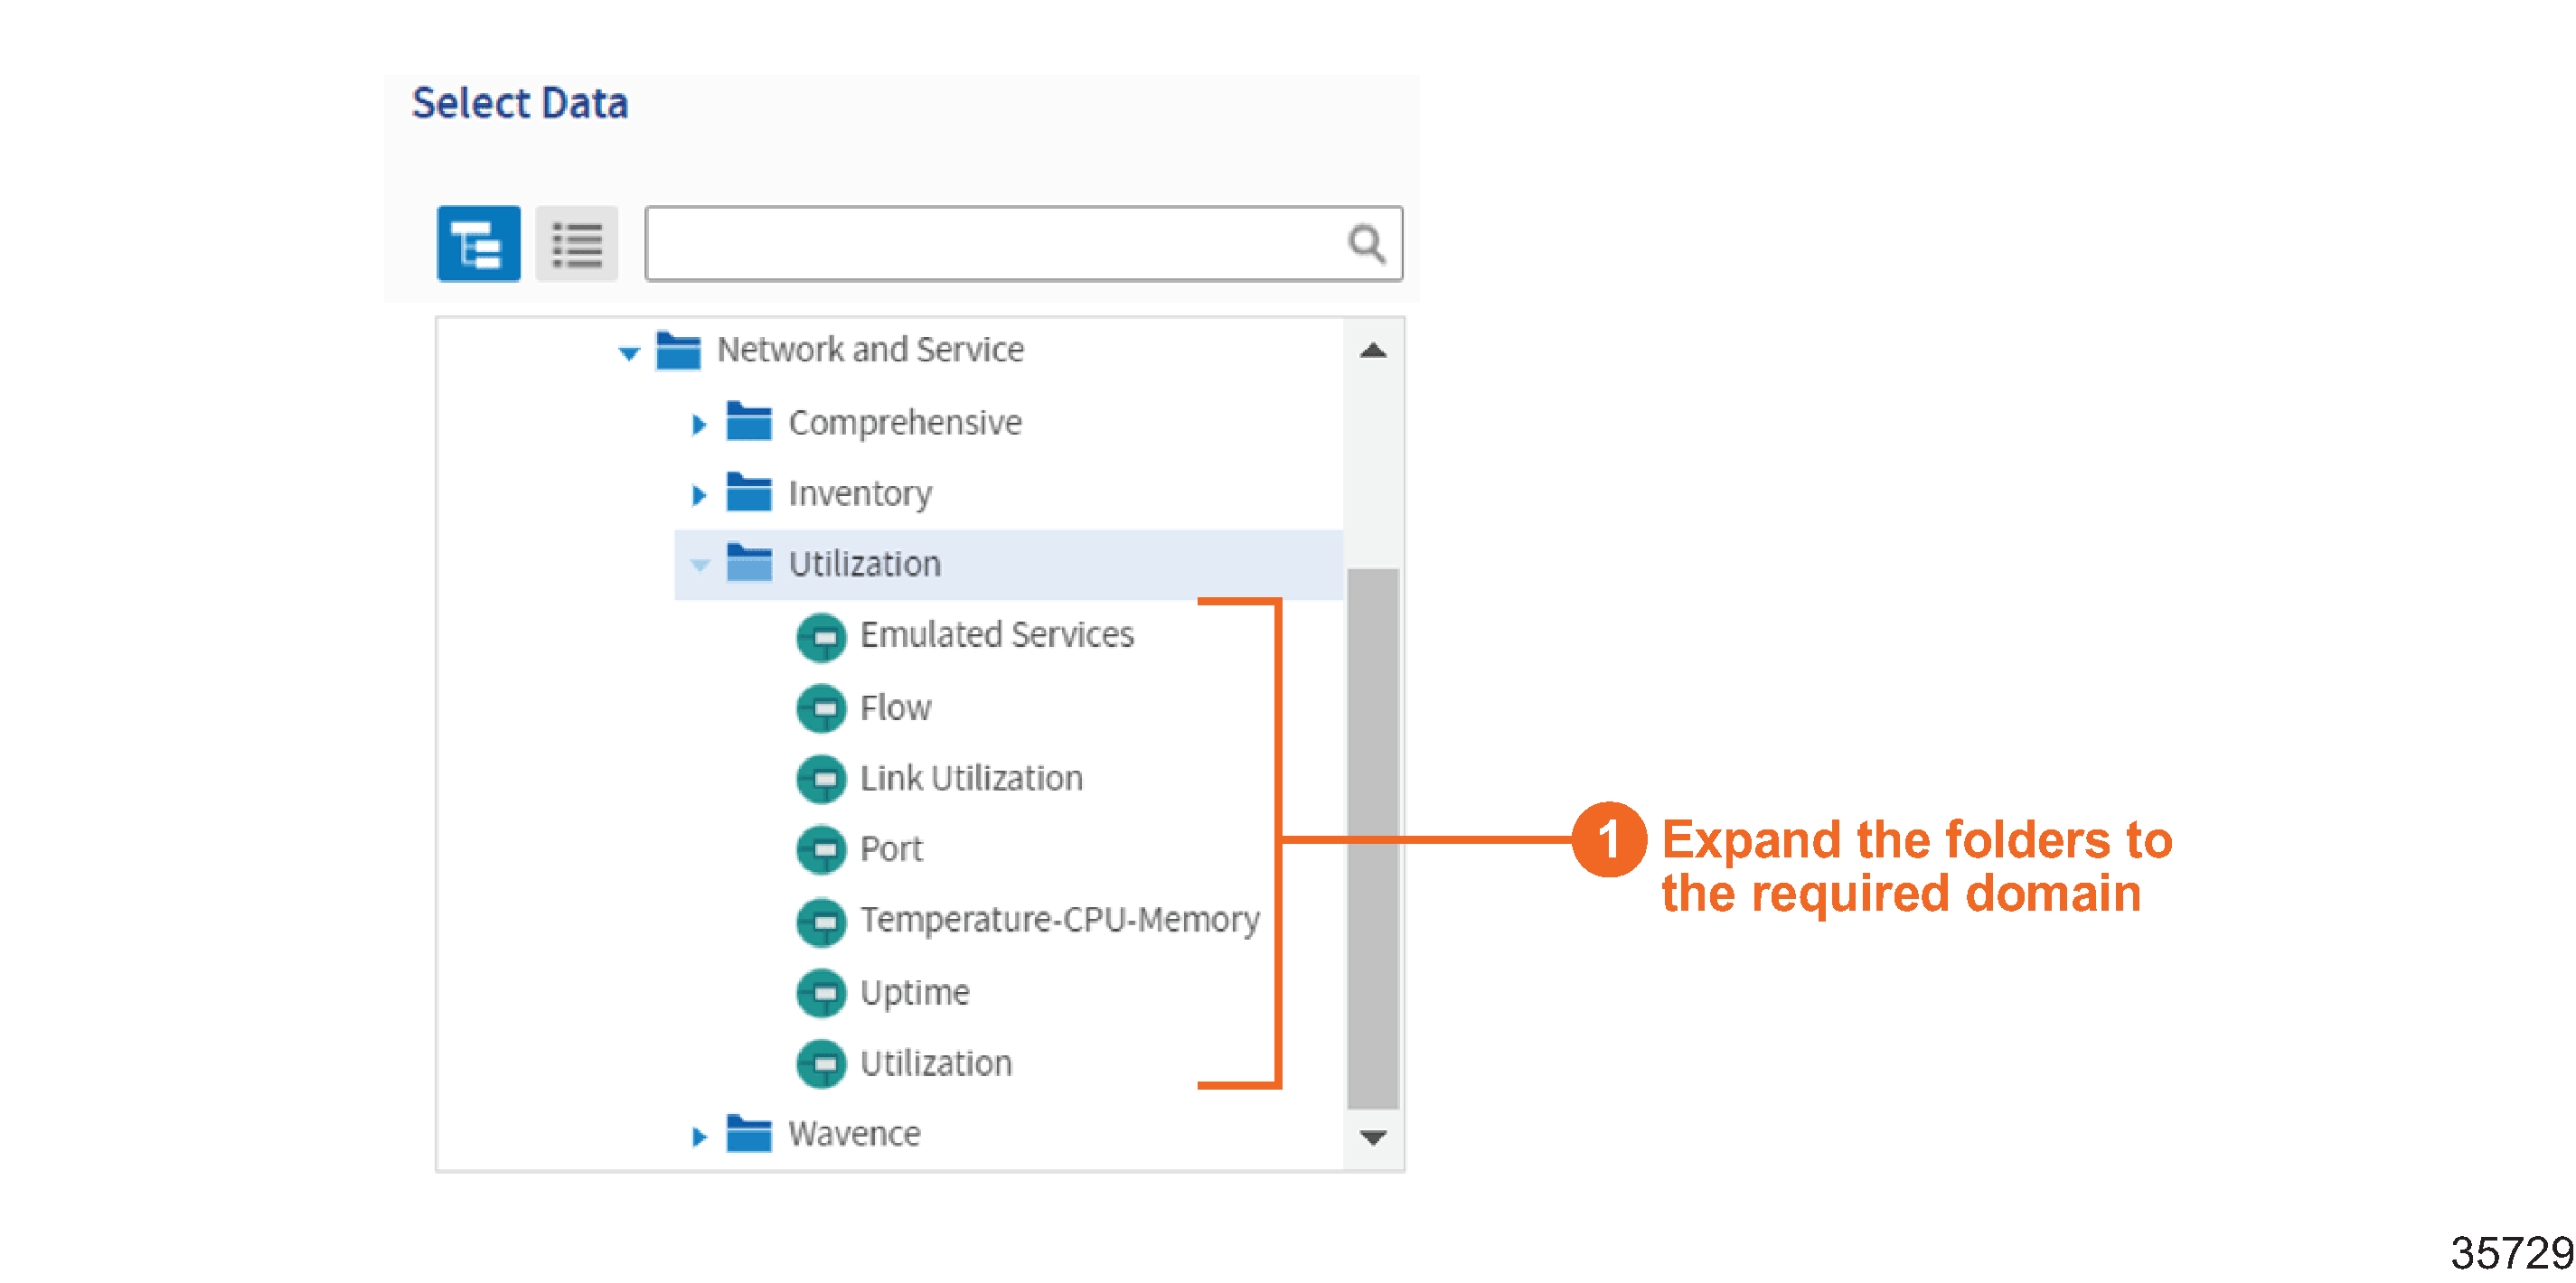
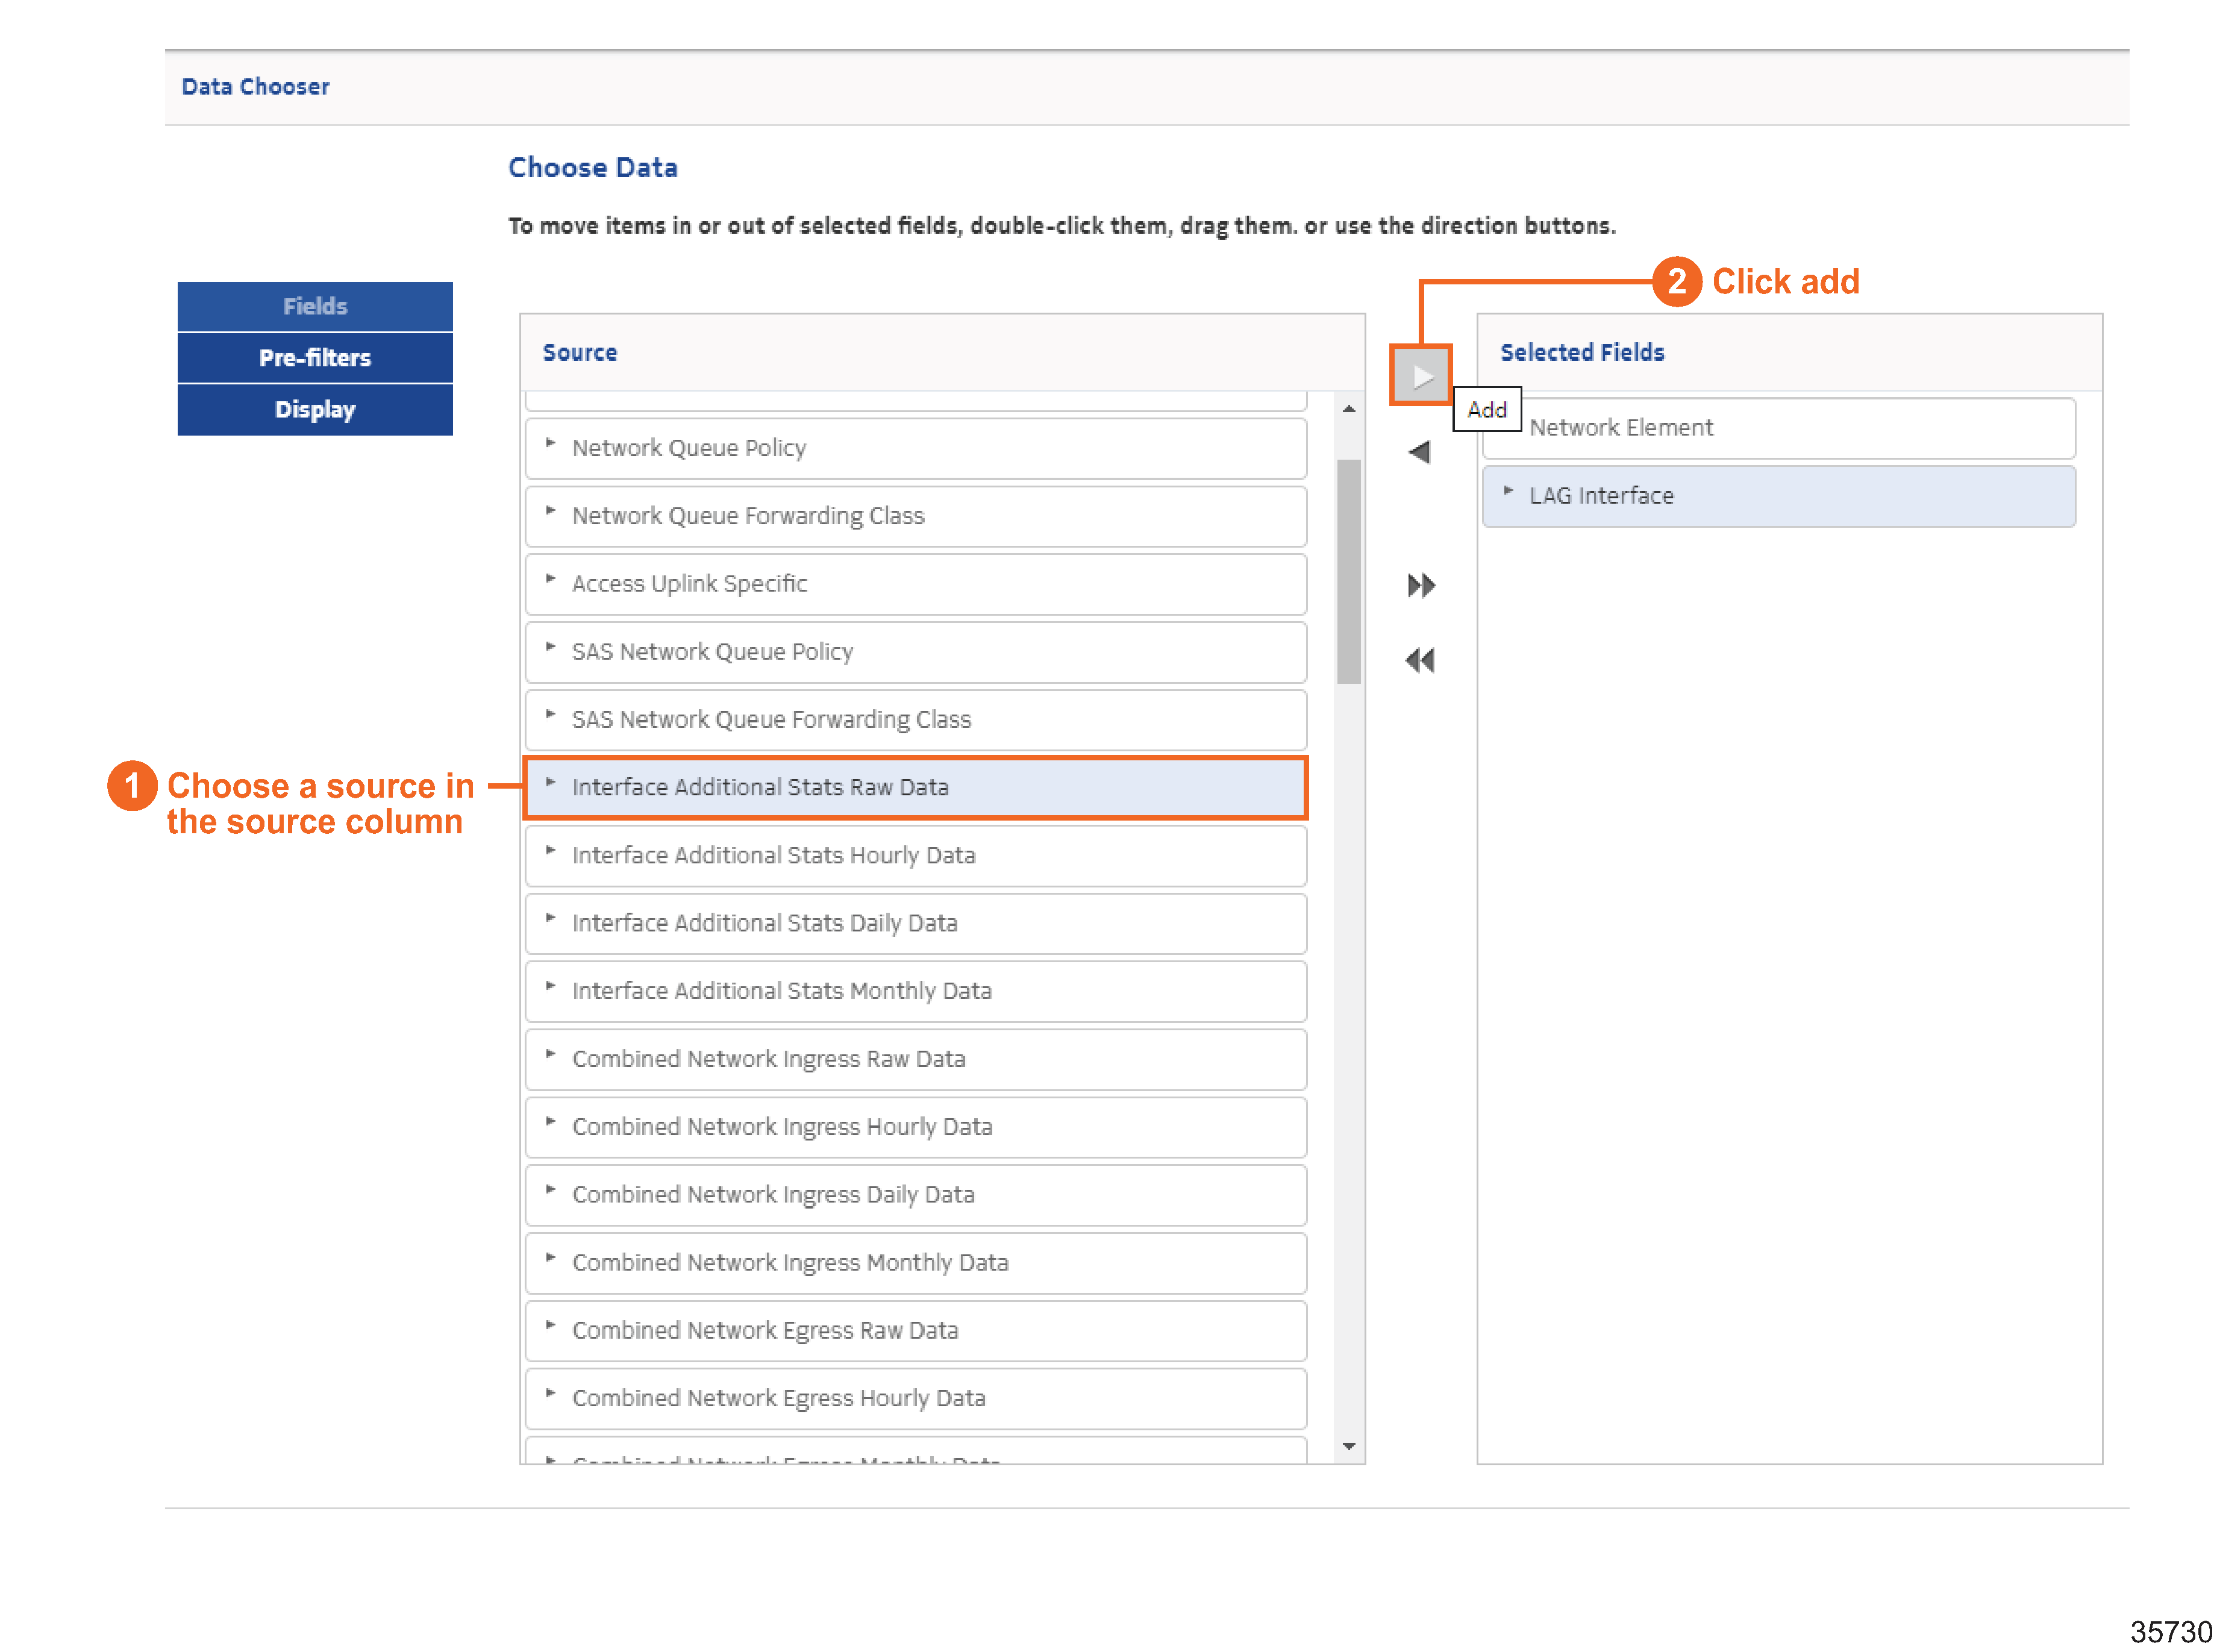
The fields and measures that are included with the data domains can be customized. Let’s update the names of some of the fields so that they’re easy to identify.
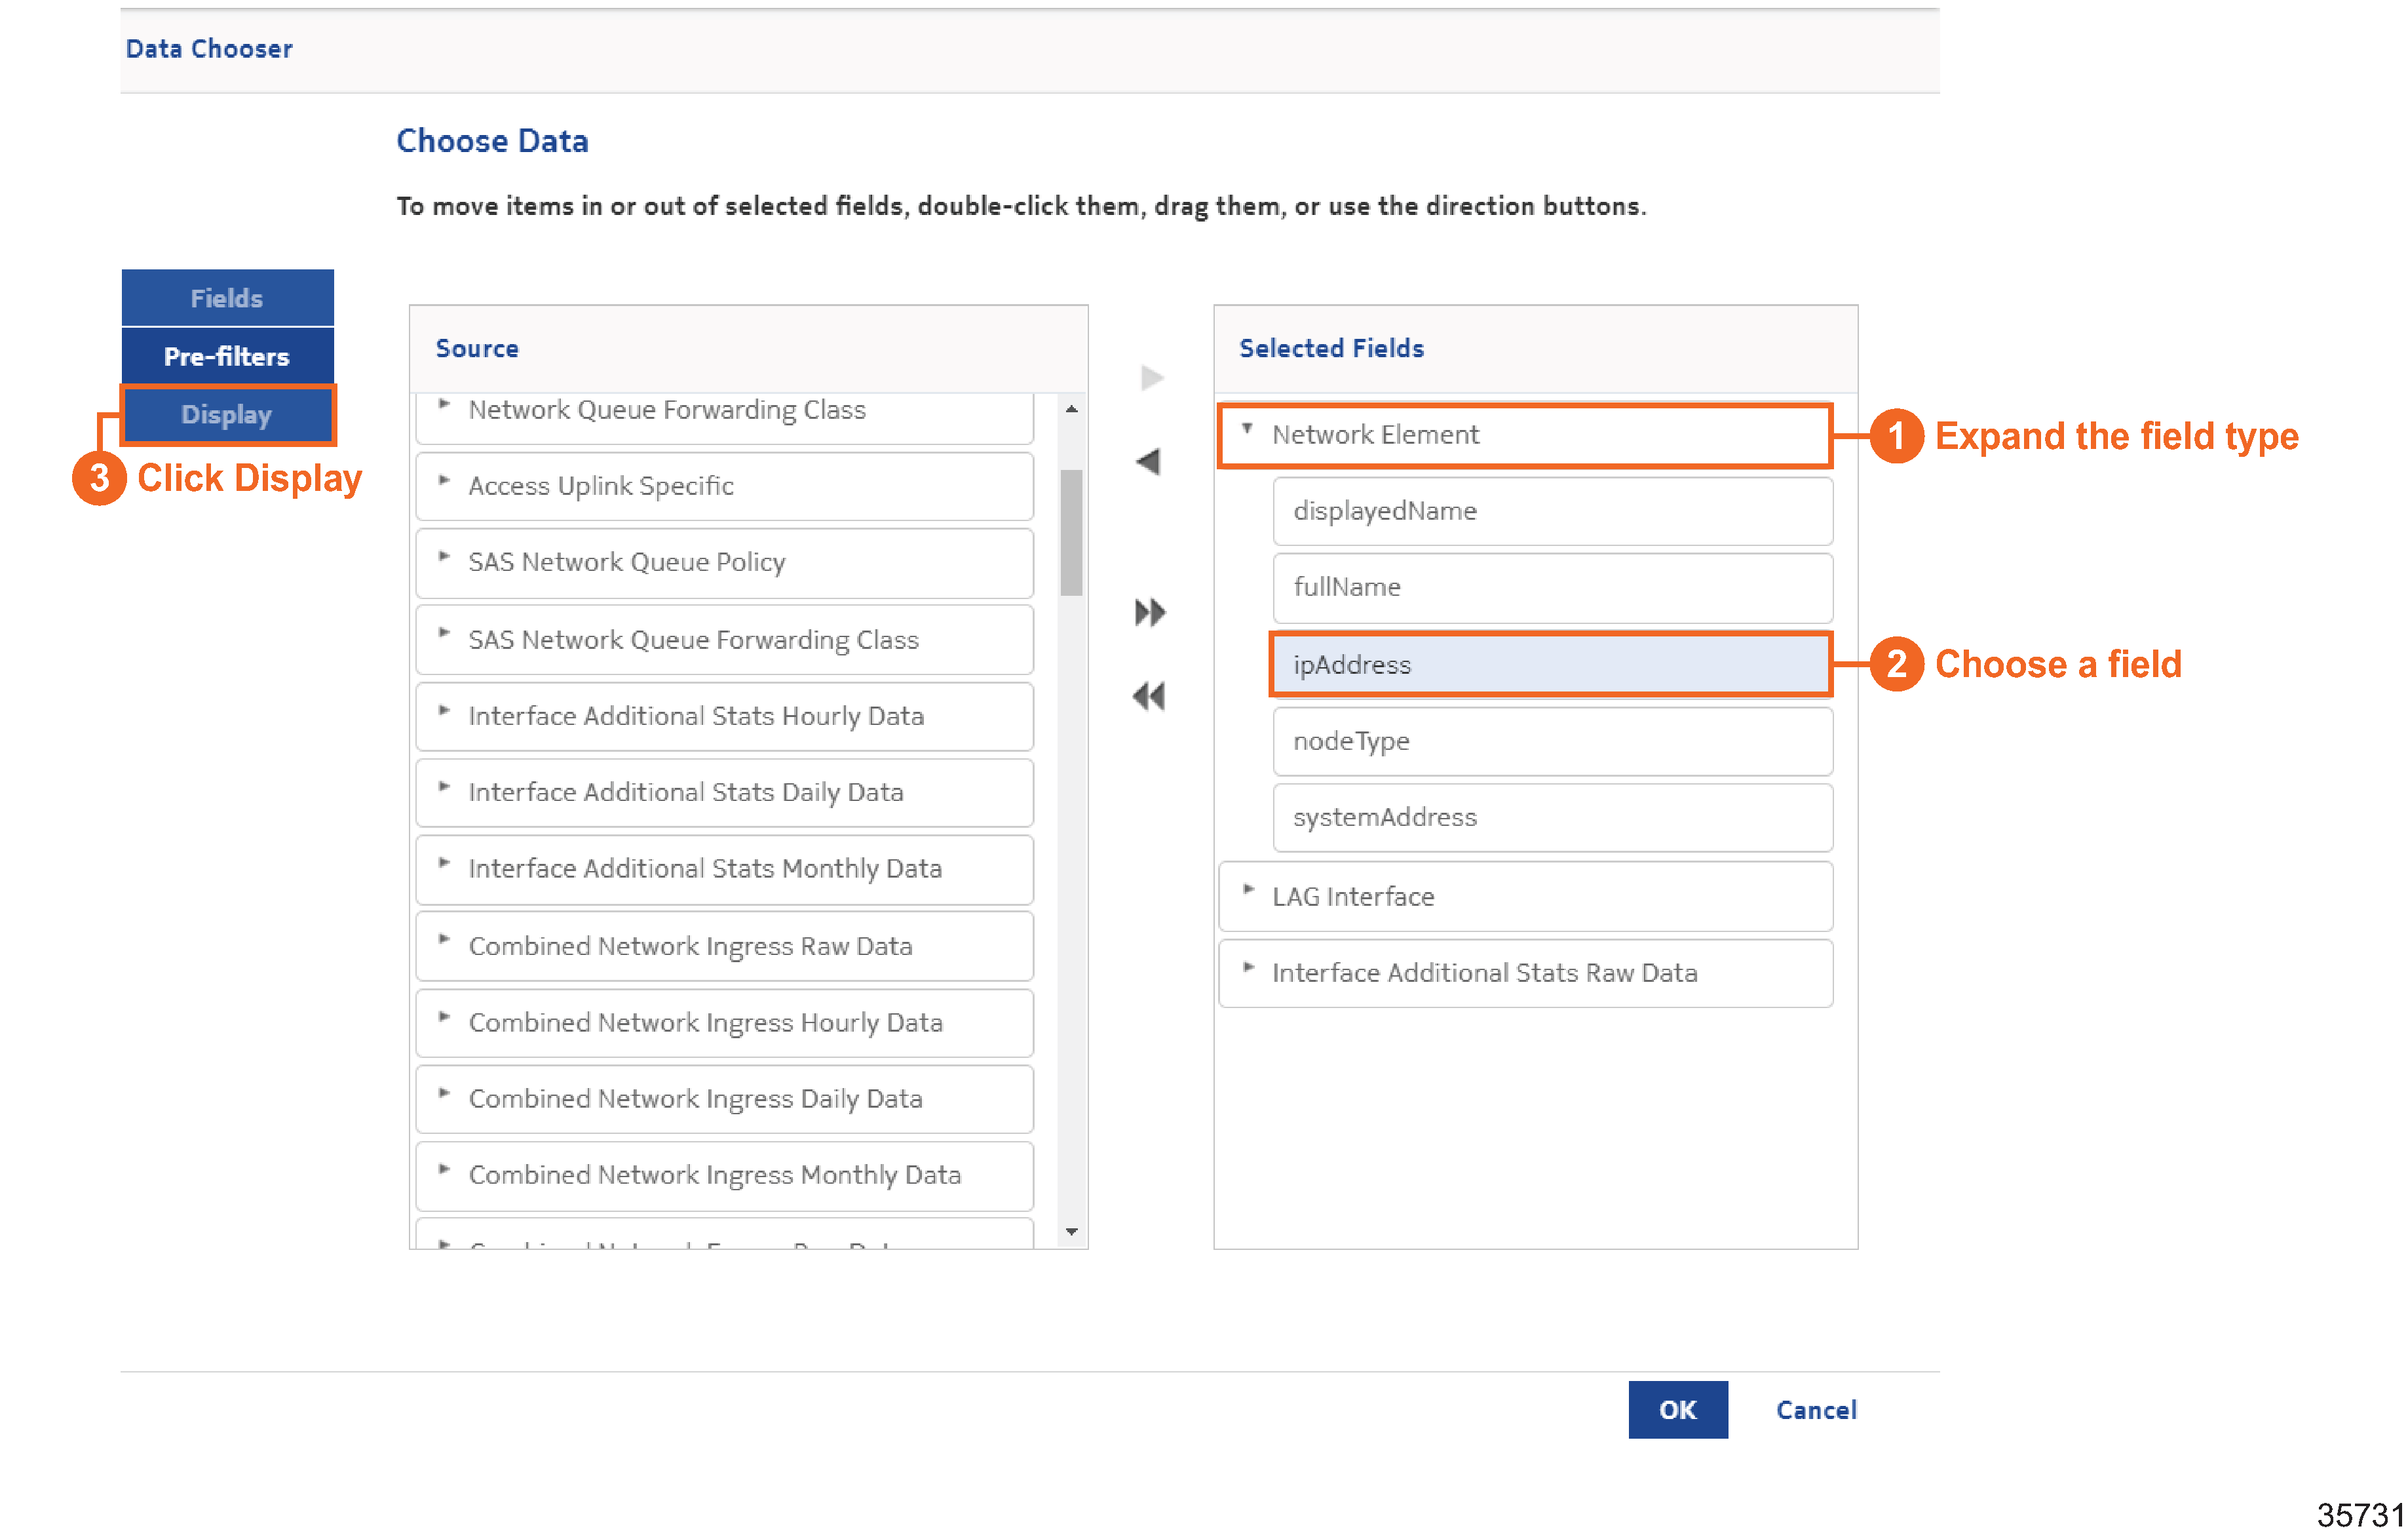
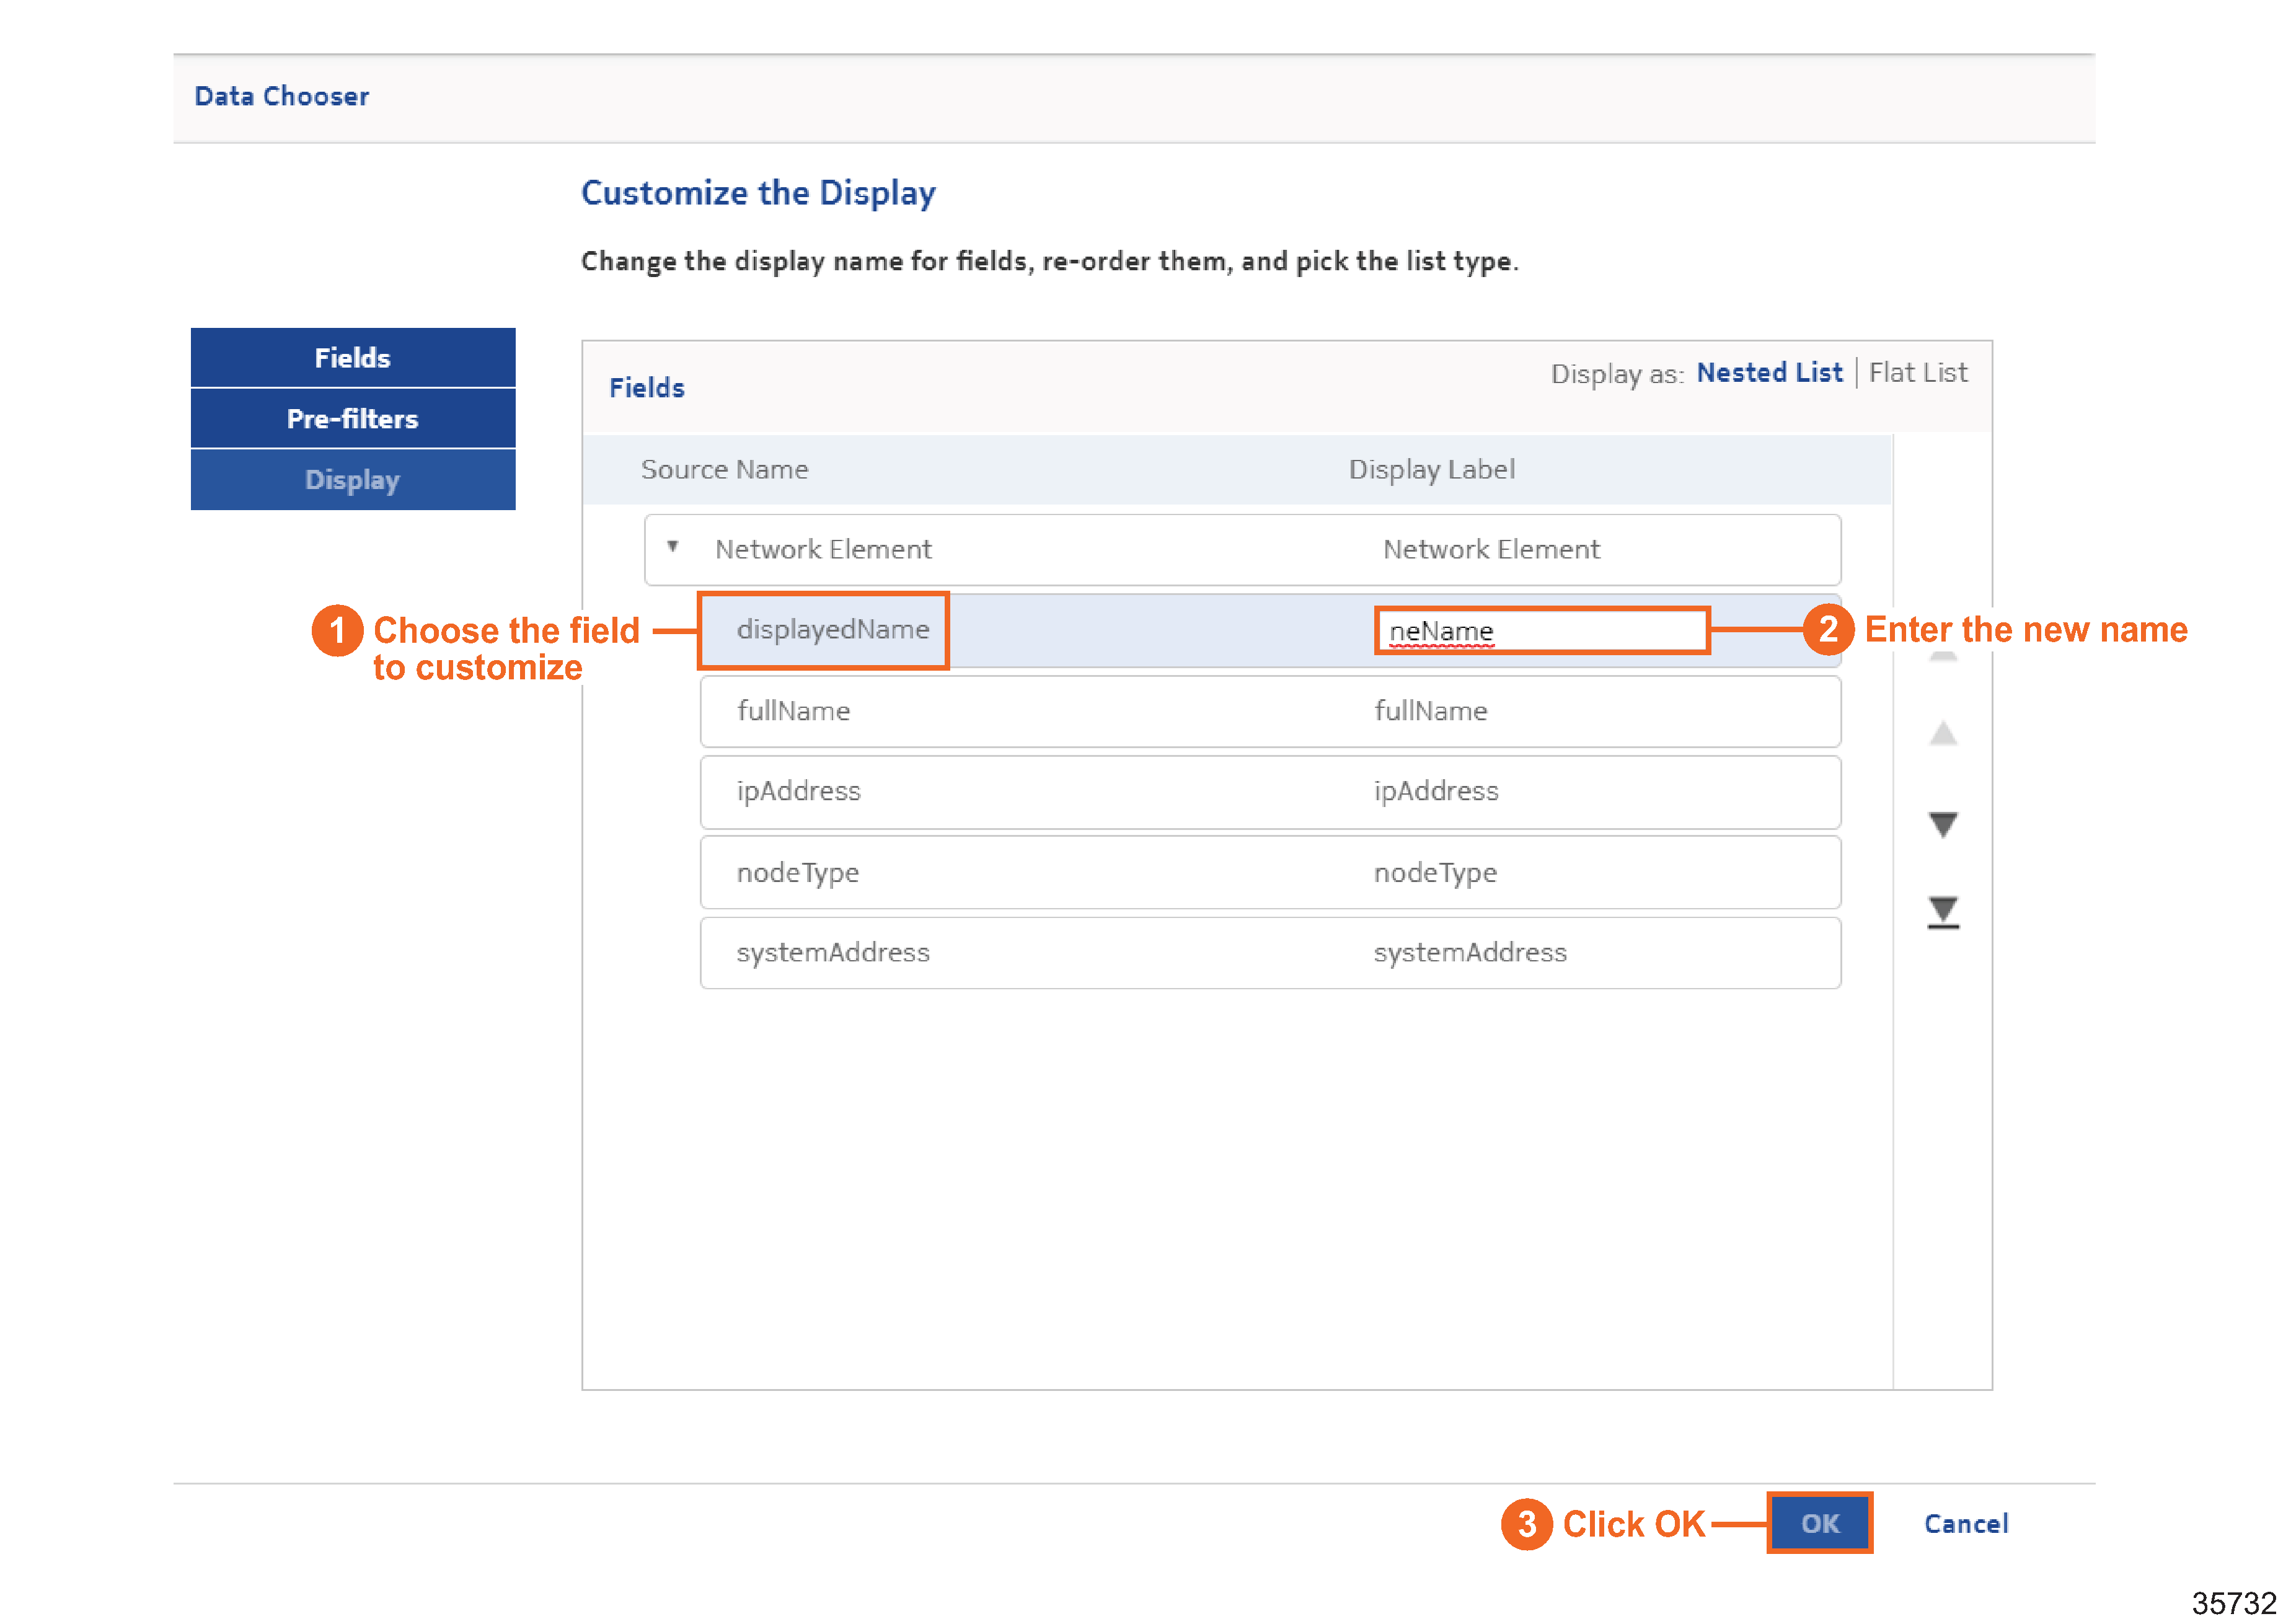
Now we’re ready to start designing the report. Our report will track ingress and egress utilization measures, and display information about the NEs and LAGs in the table fields.
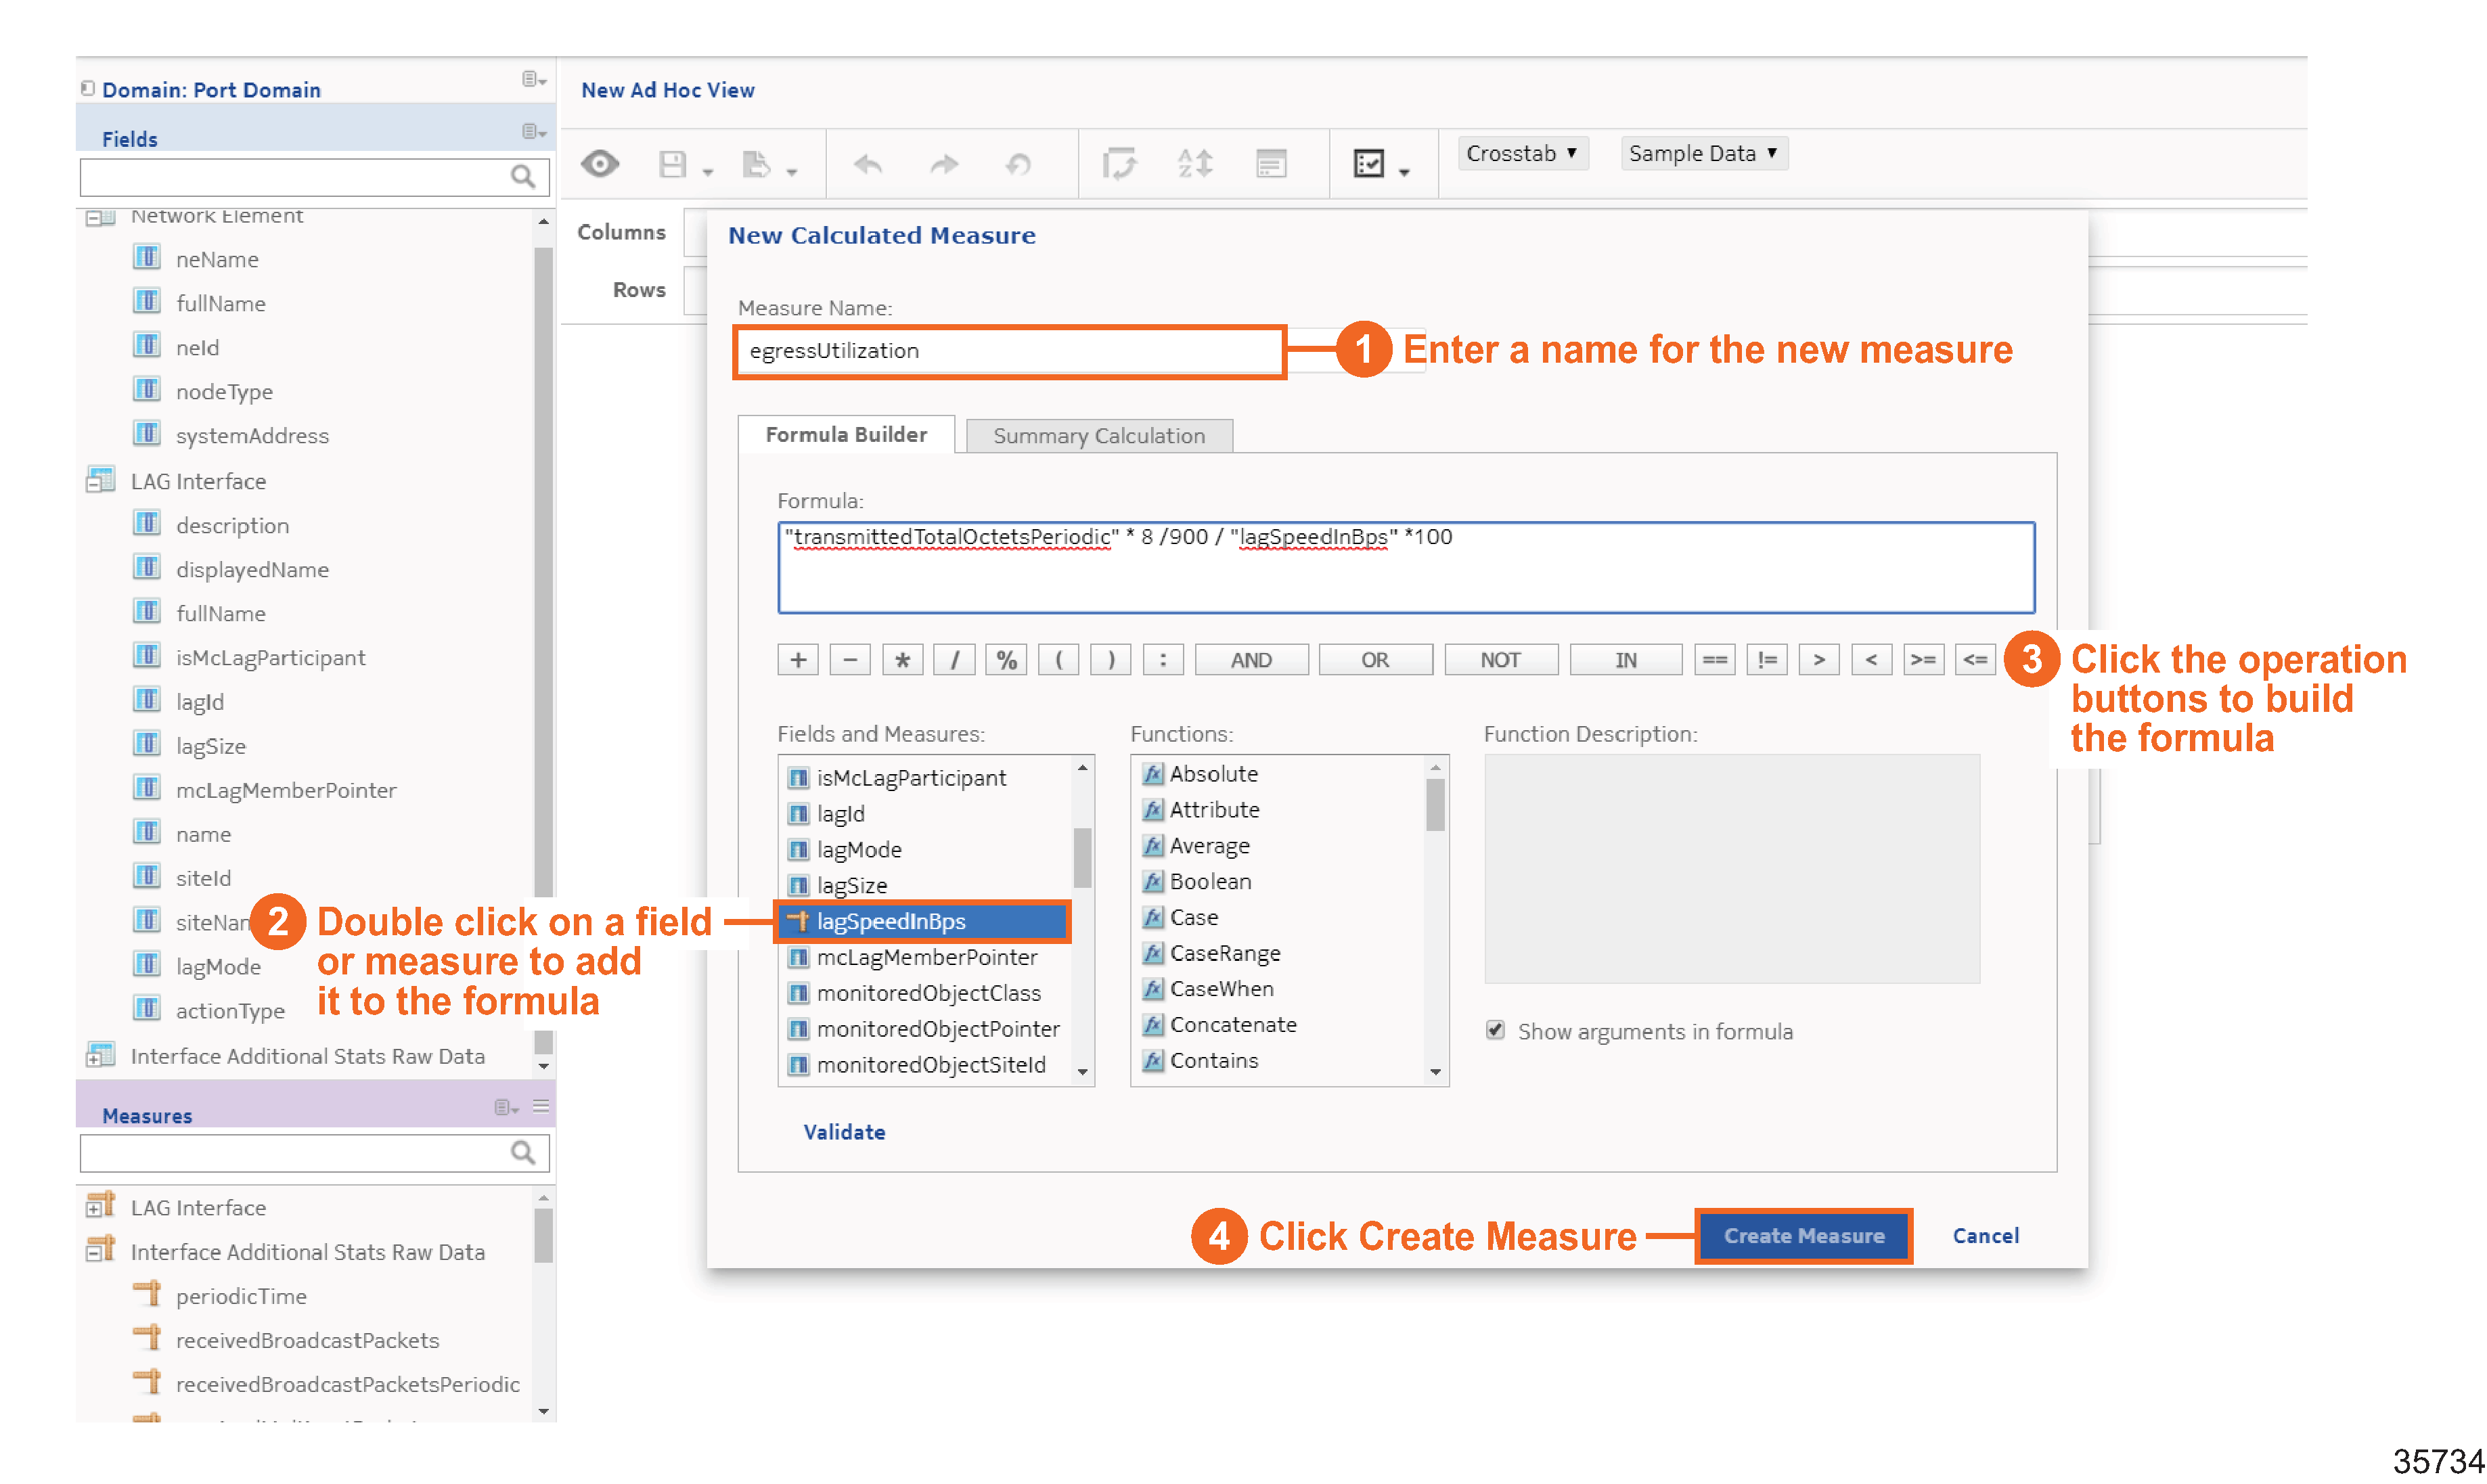
The utilization measures are calculated values, so we need to create custom measures to obtain the values.
The utilization measures are calculated using default measures, according to the following formulas:
-
ingressUtilization: “receivedTotalOctetsPeriodic” * 8 / 900 / “lagSpeedInBps” *100
-
egressUtilization: “transmittedTotalOctetsPeriodic” * 8 / 900 / “lagSpeedInBps” *100
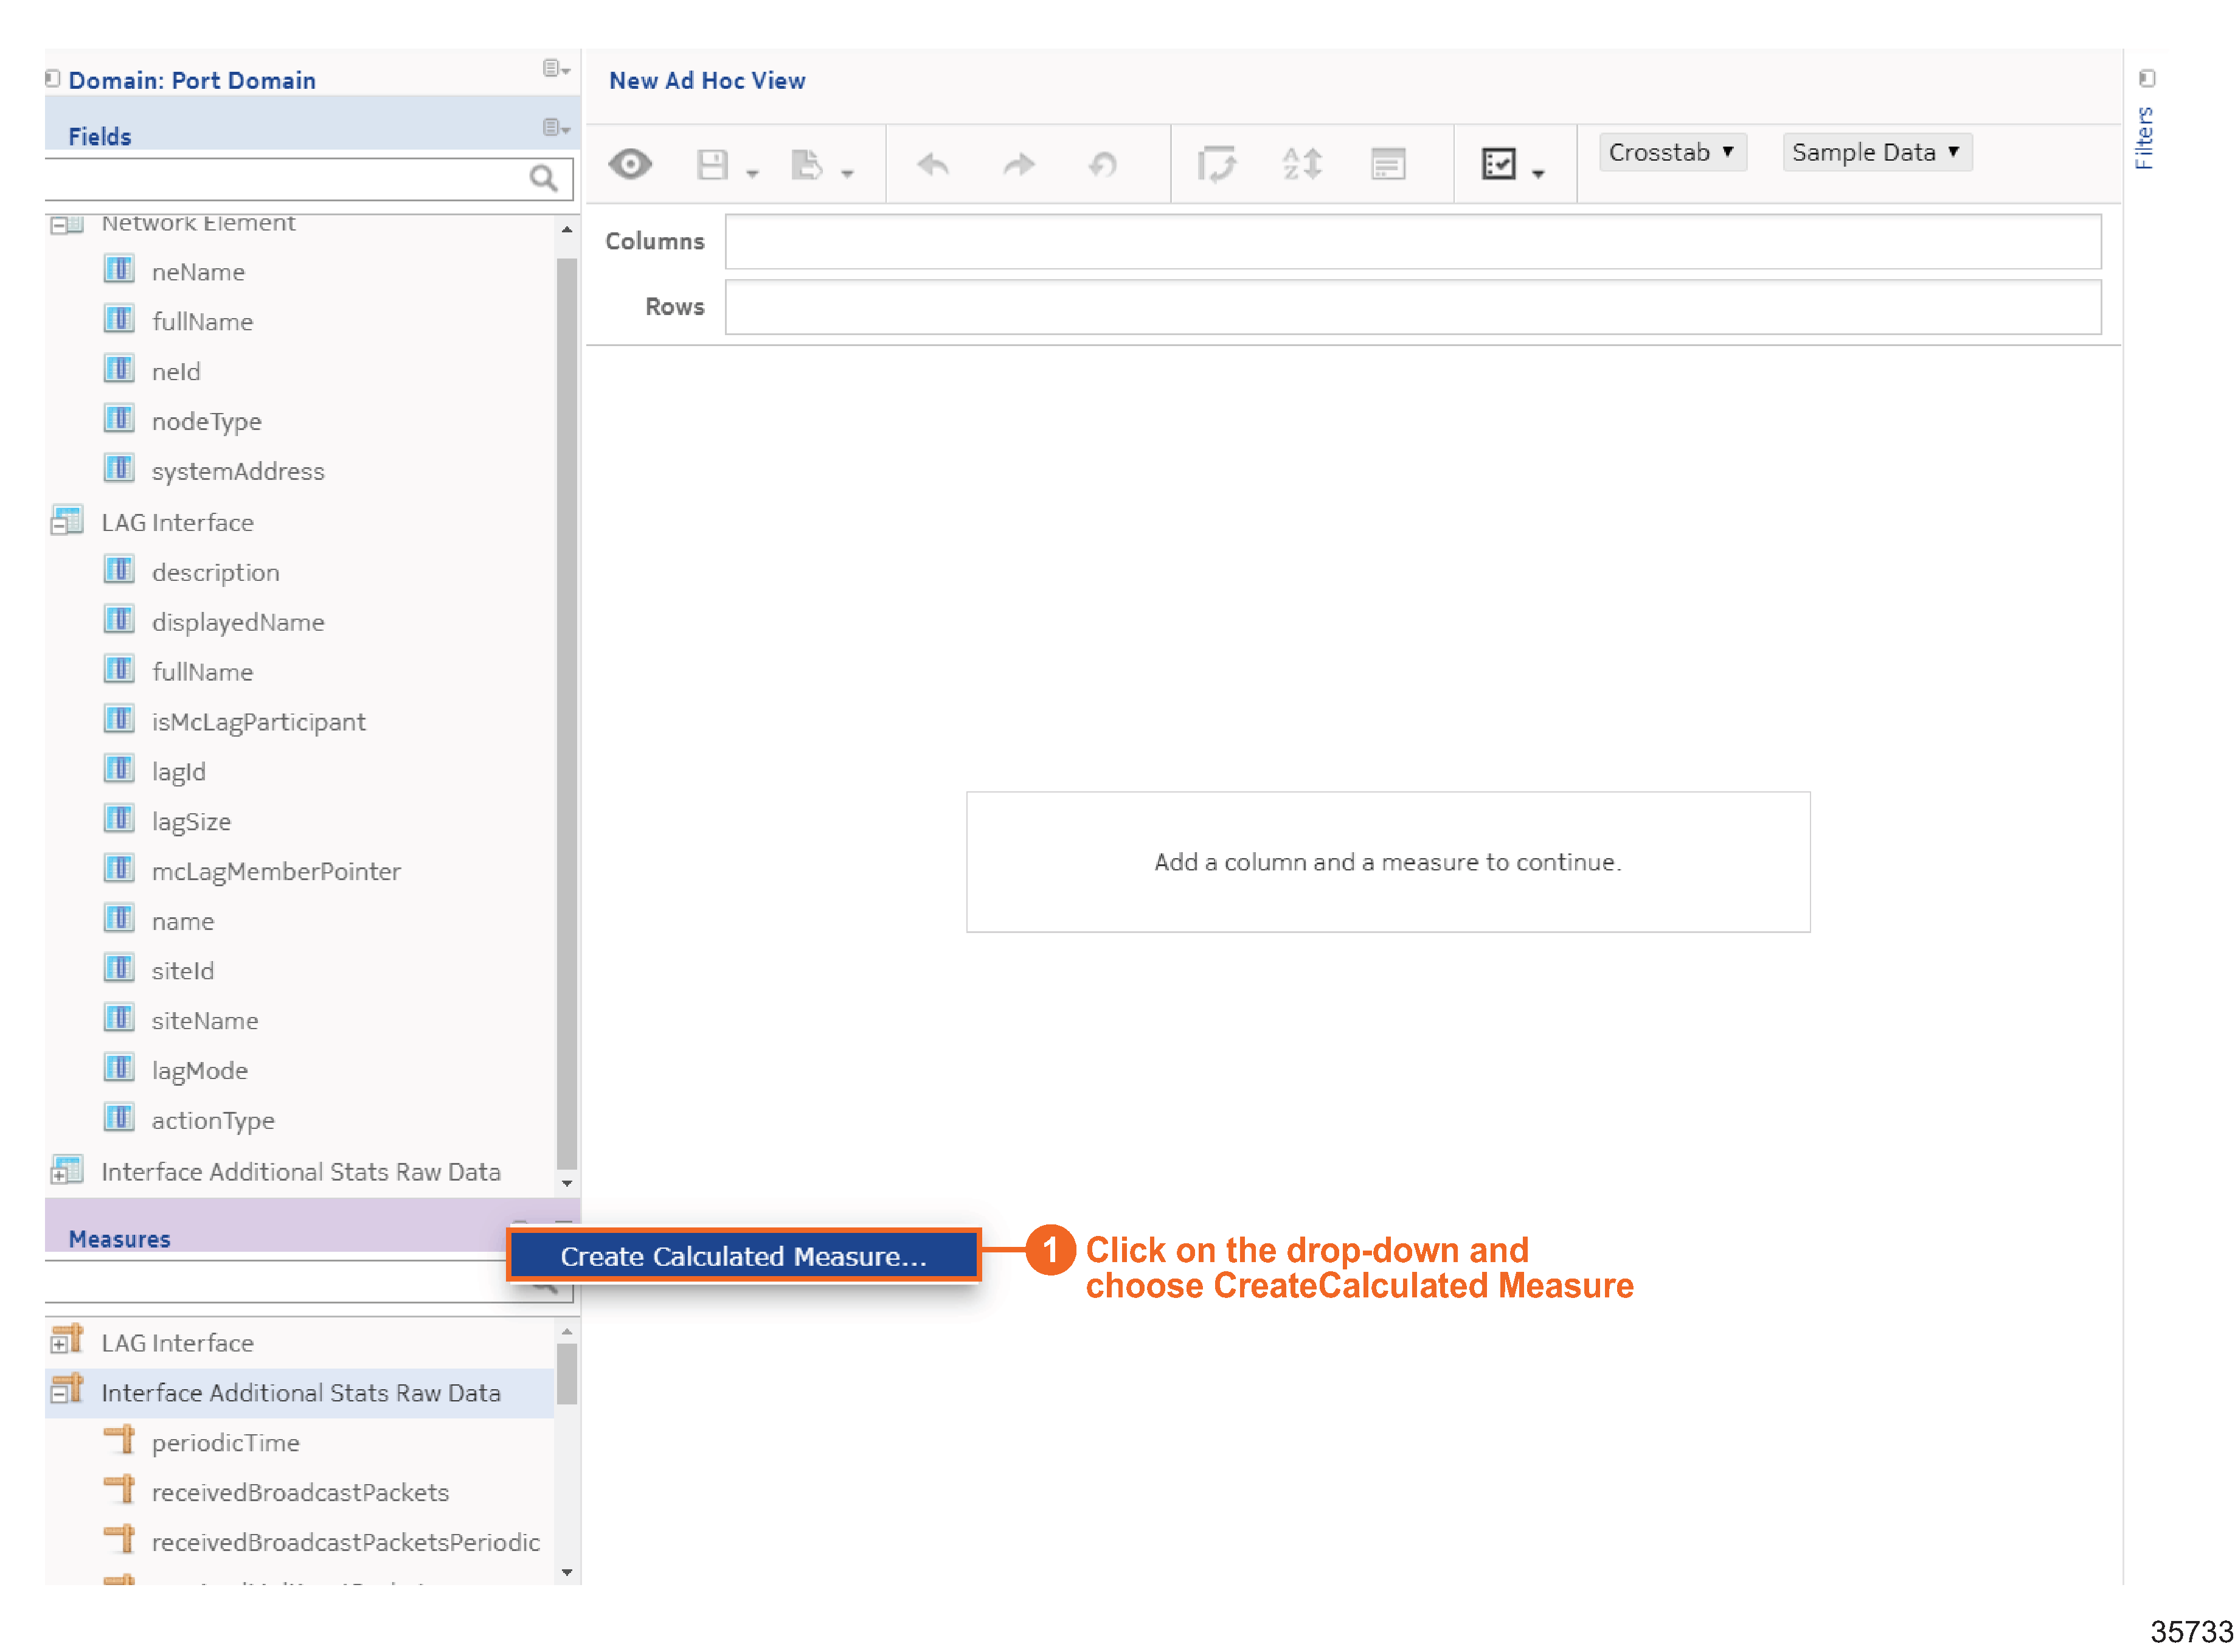
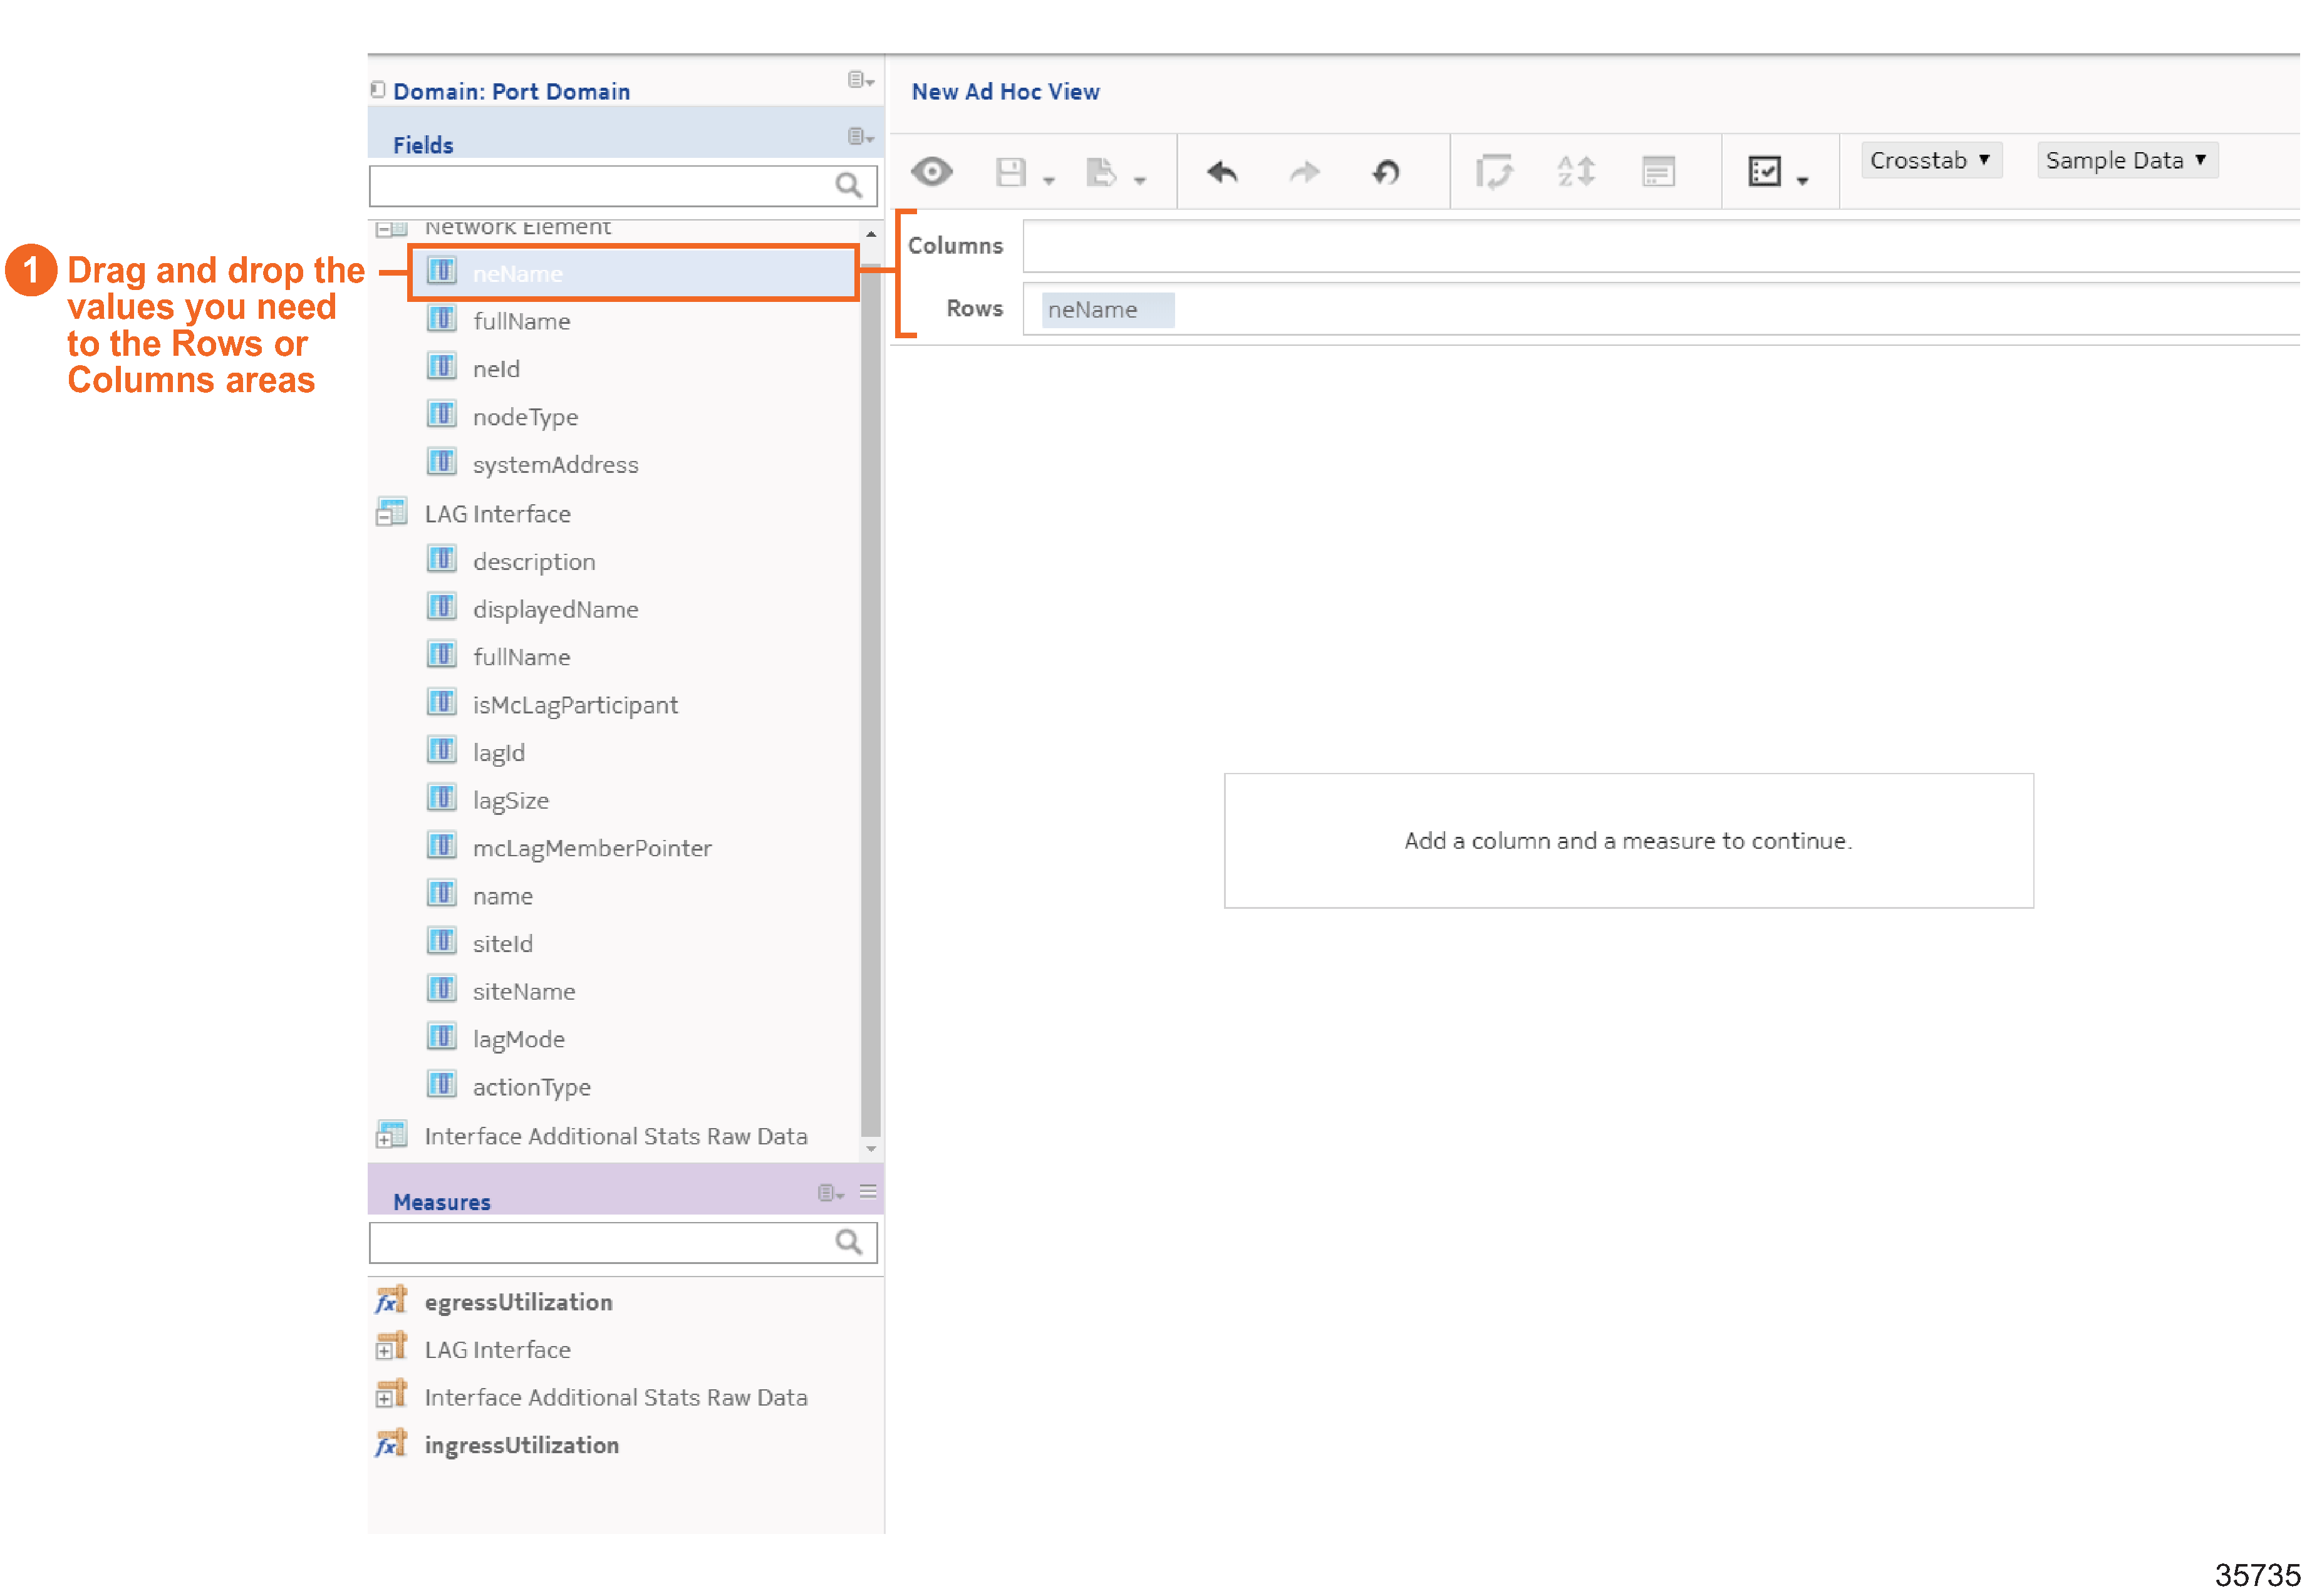
Add the values you need to the rows and columns. We’ll use the Measures as the column values and put the Fields in each row. As the report is built, the values are populated to show how the report will look.
Note: You can choose to place either Fields in the Rows area and Measures in the Columns area or vice versa, but you cannot mix fields and measures in the same area.
One of the values we want to show in the rows is the LAG speed. This value is a measure by default, so we’ll need to change it to a field.
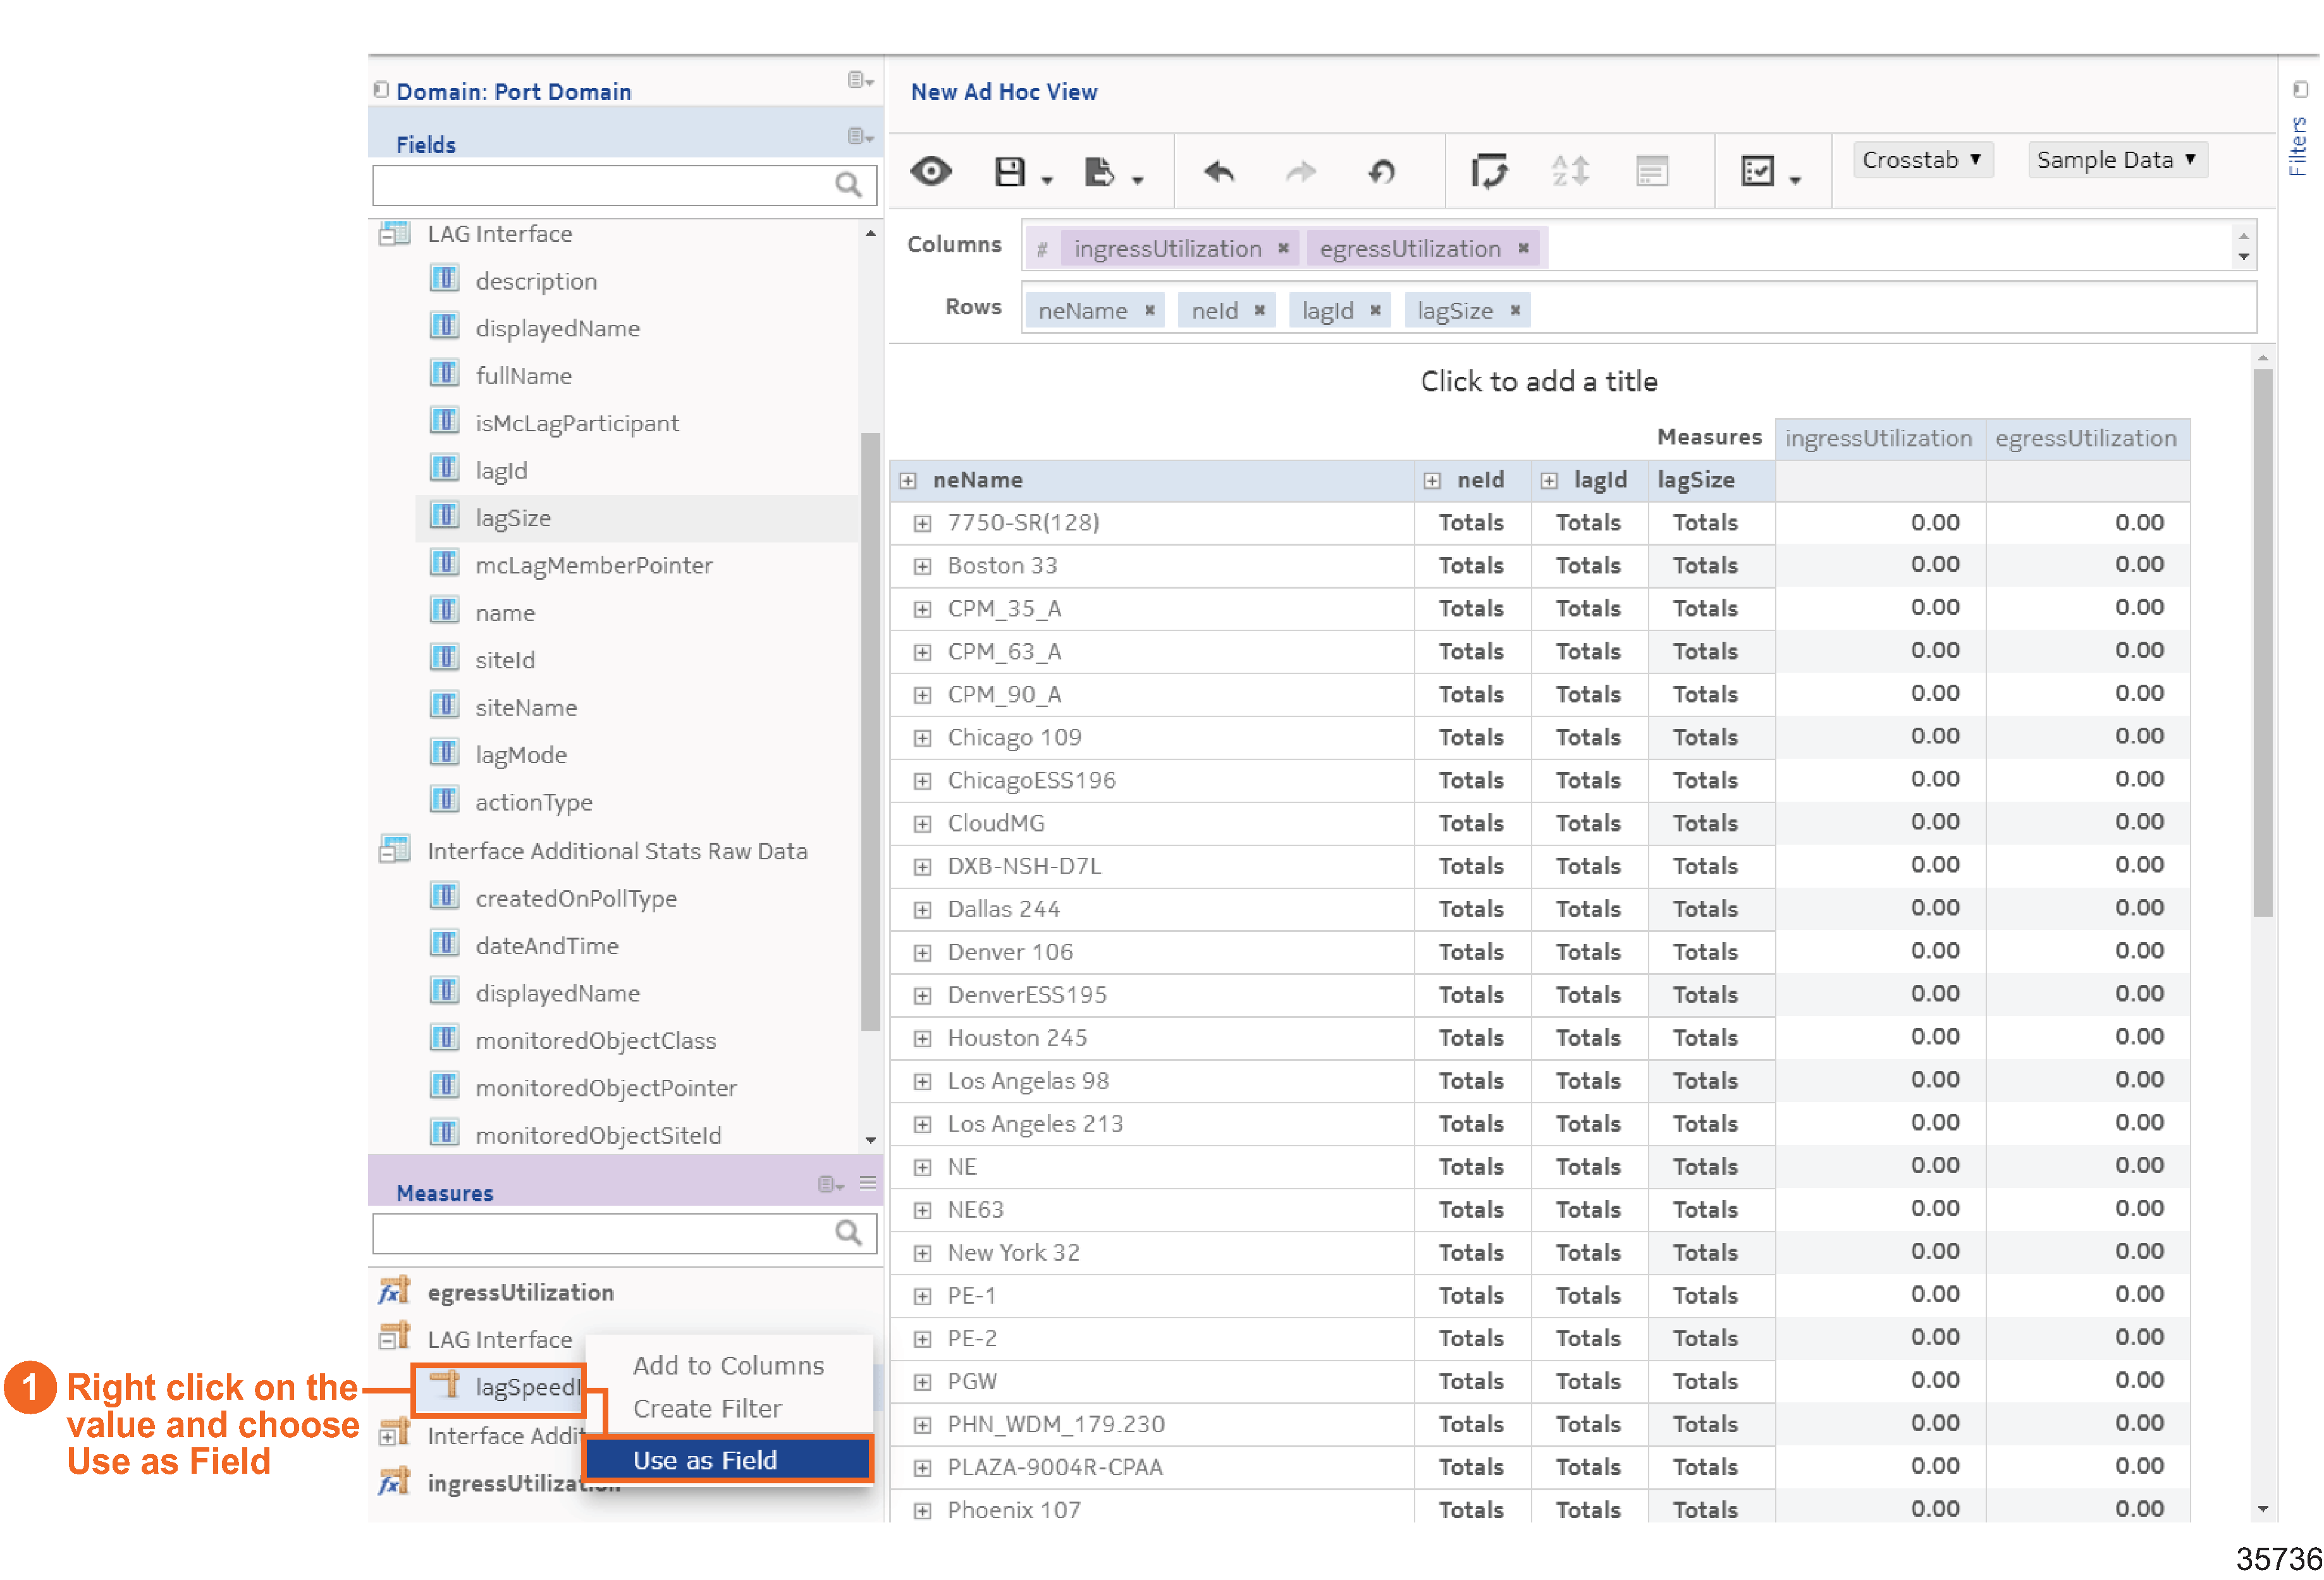
Continue adding the relevant values to the rows. The report will include descriptions about the NEs and their LAGs: NE name, NE ID, LAG ID, LAG size, LAG speed, and LAG description.
We have created a table that can be run as a report. If we saved this view and created a report from it, it would show all the available information for the selected values.
To allow the report to show a subset of data, we’ll need to create filters. The filters we create will also become inputs in the report.
We’ll filter based on the following:
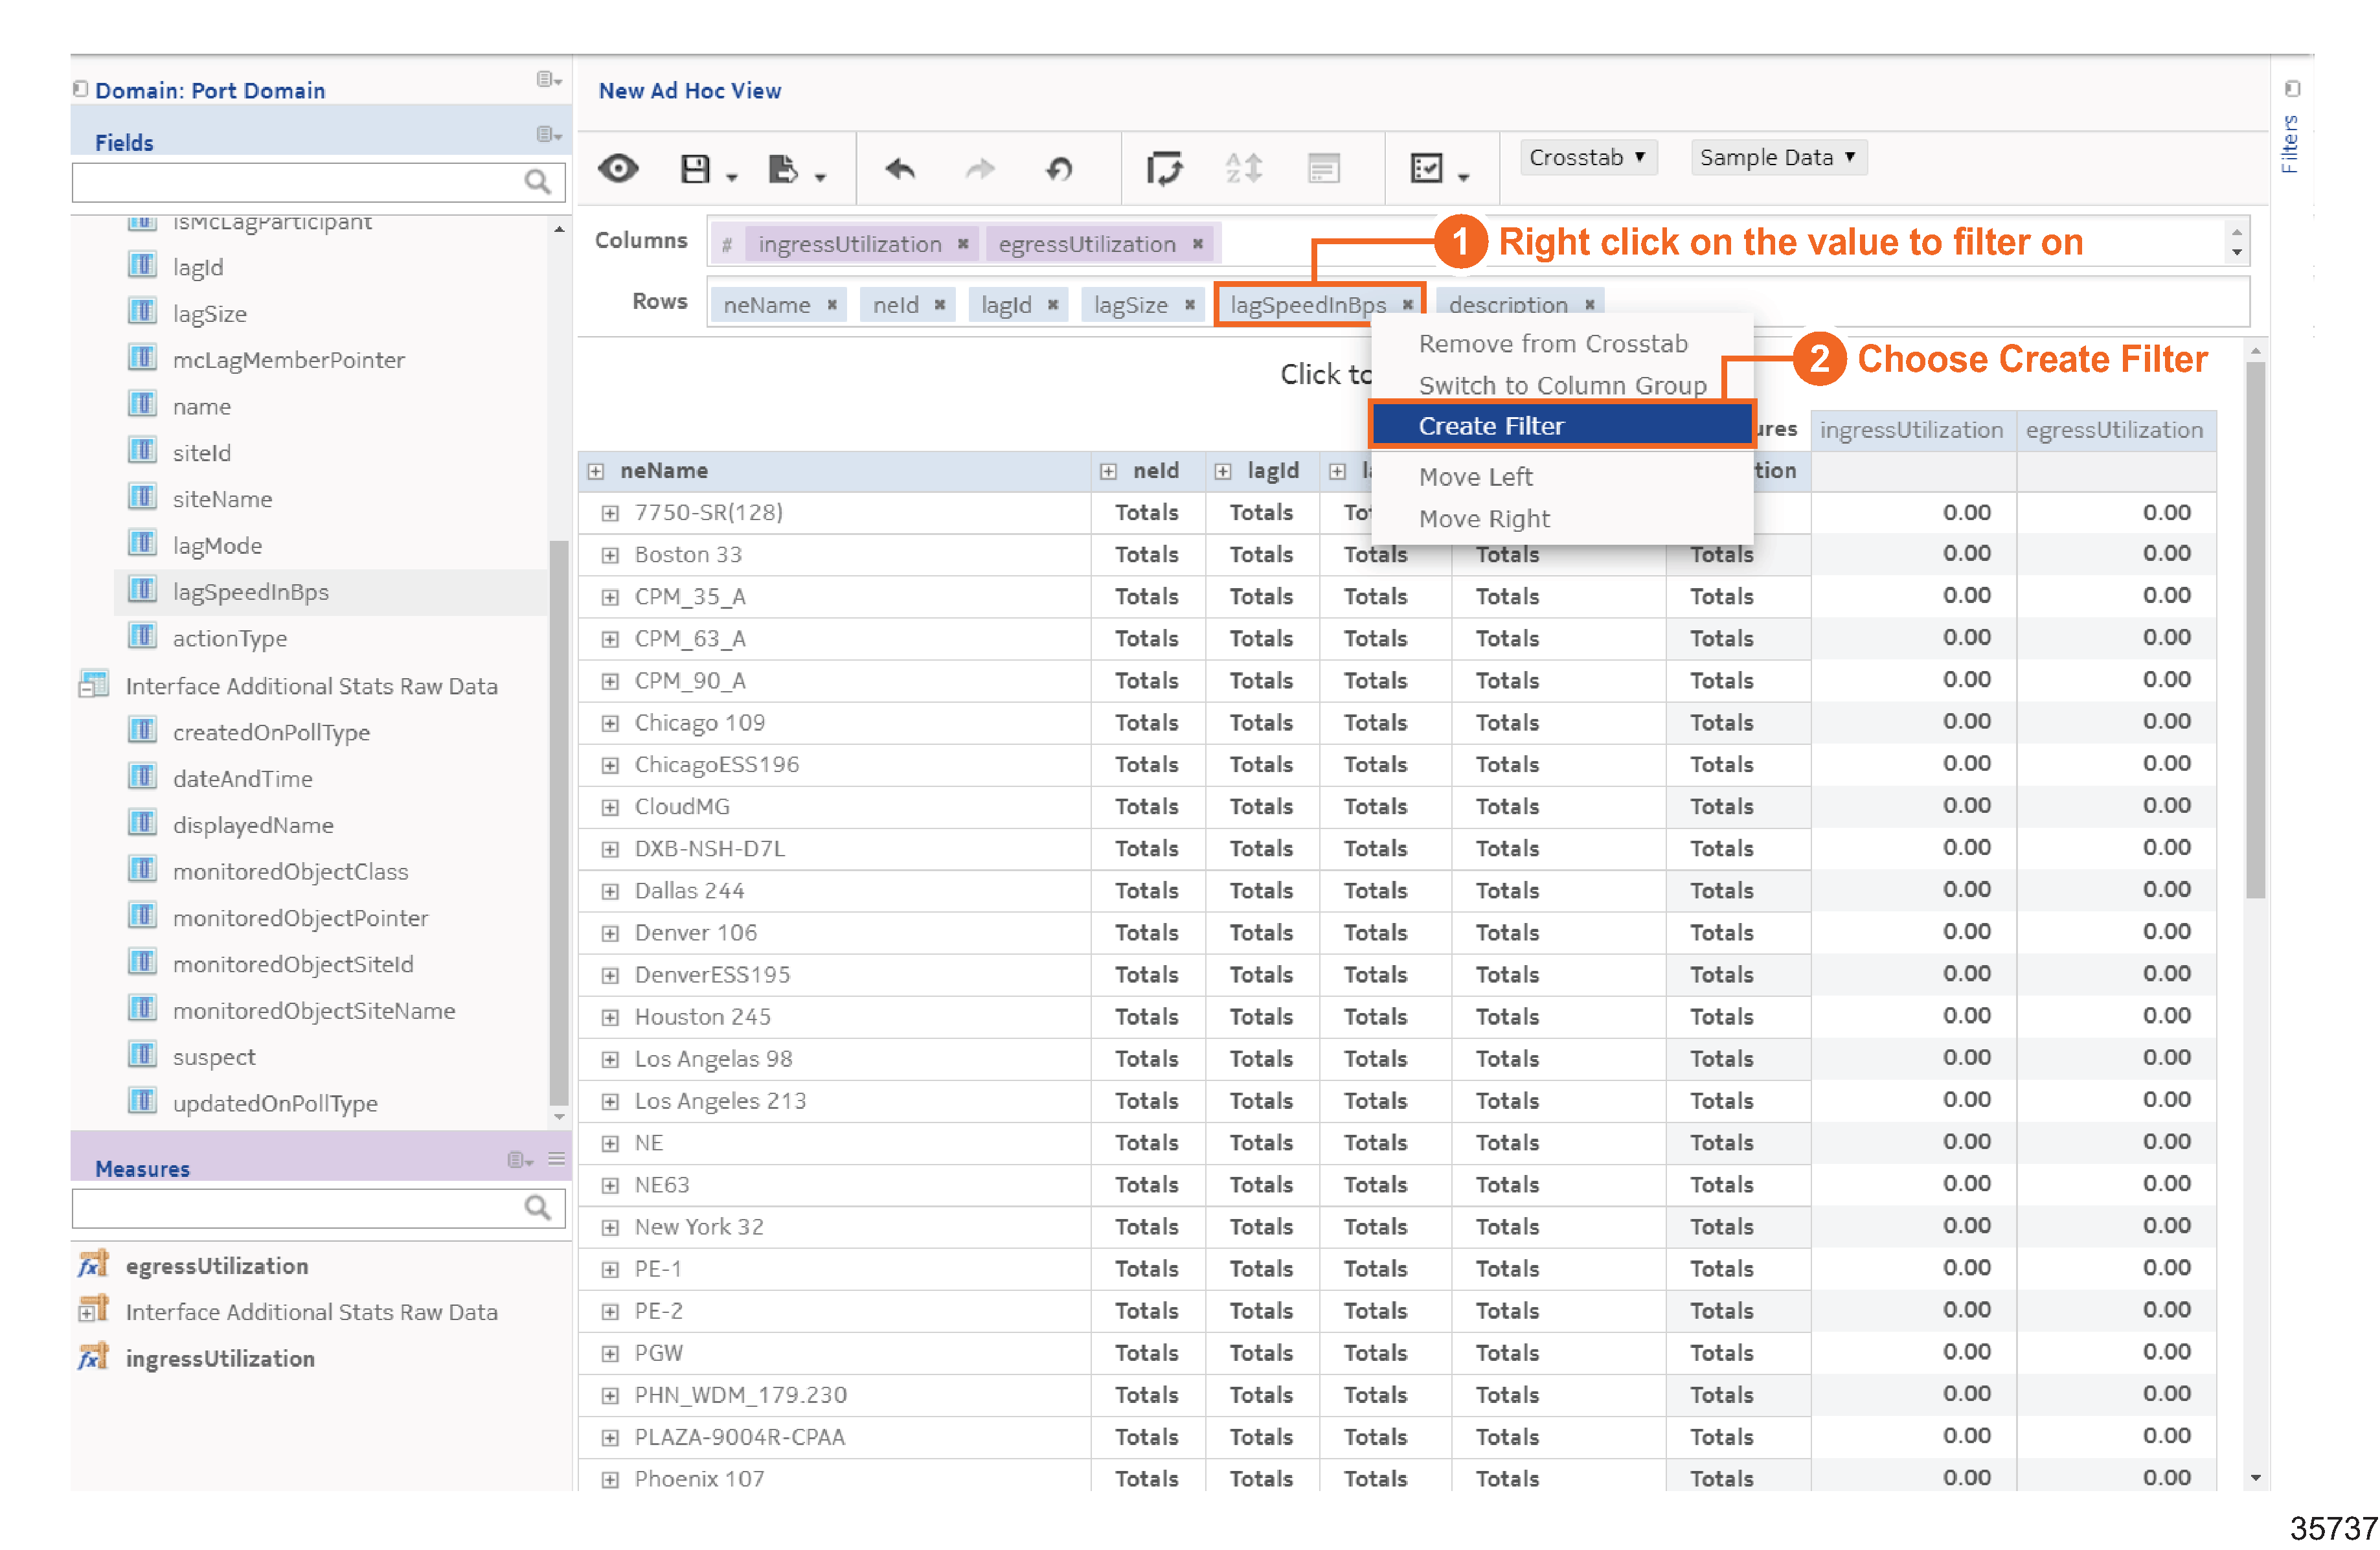
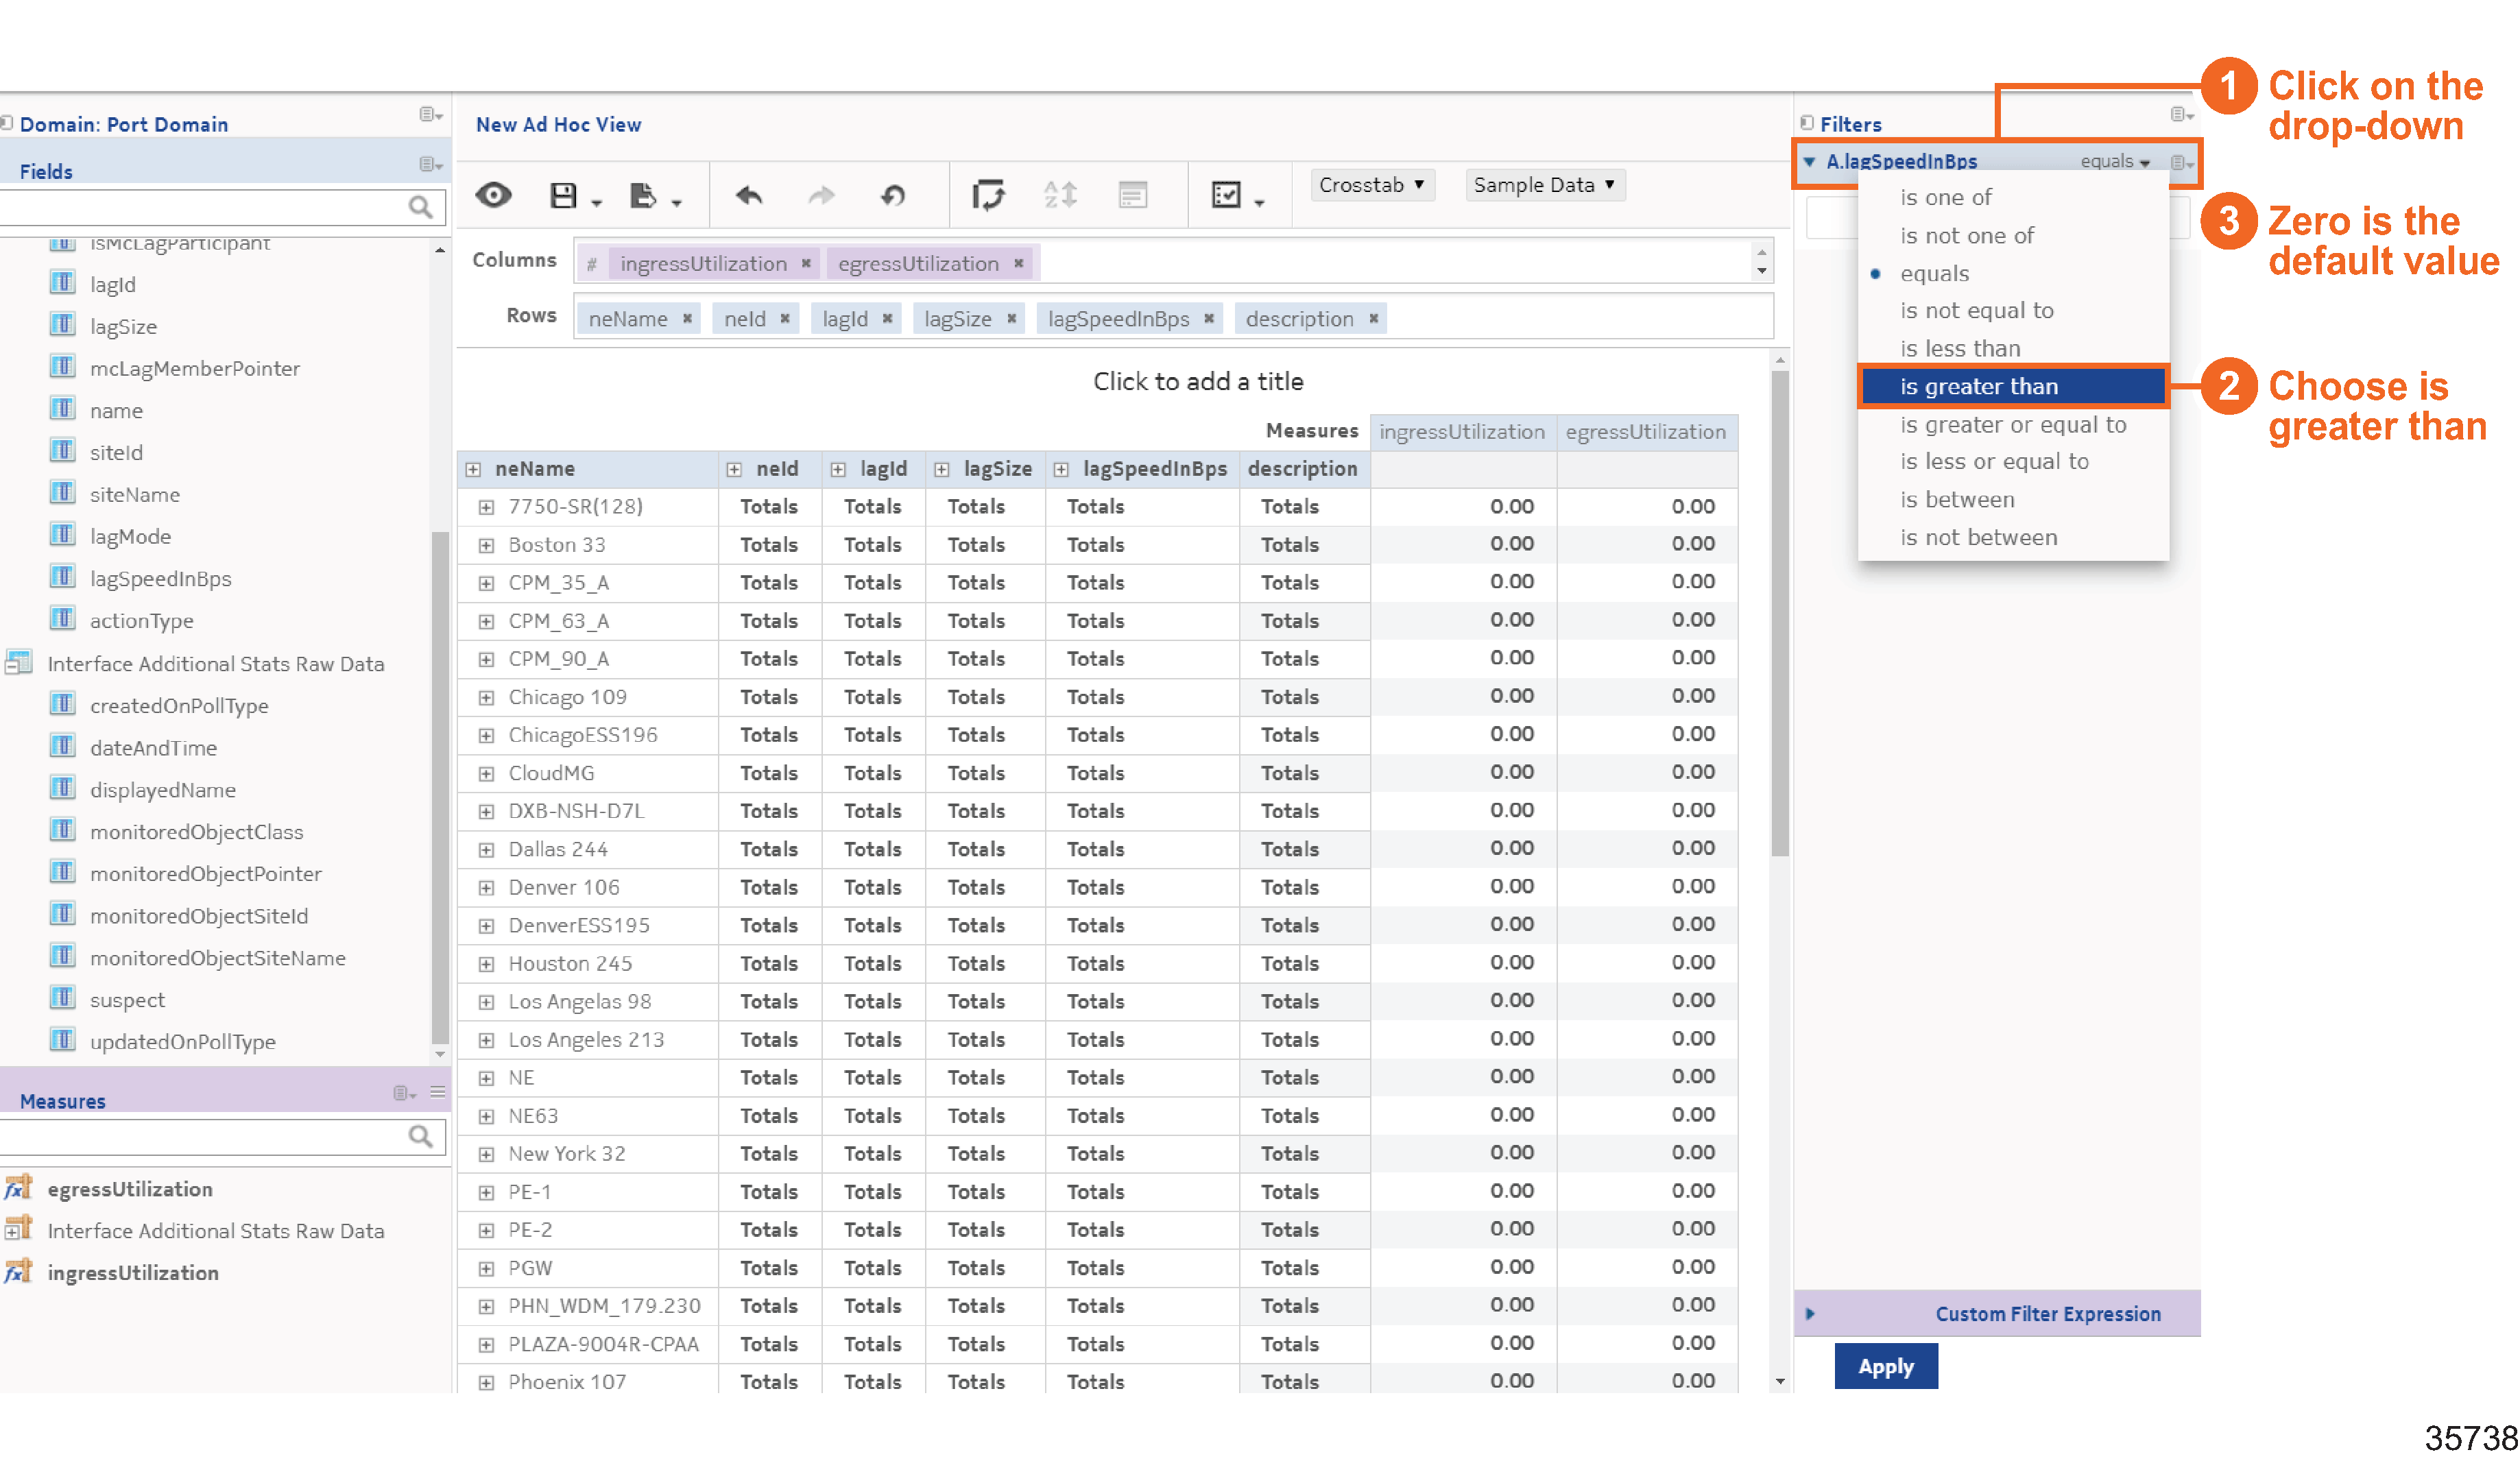
The filter appears in the Filters column. Let’s set the default filter expression to greater than zero.
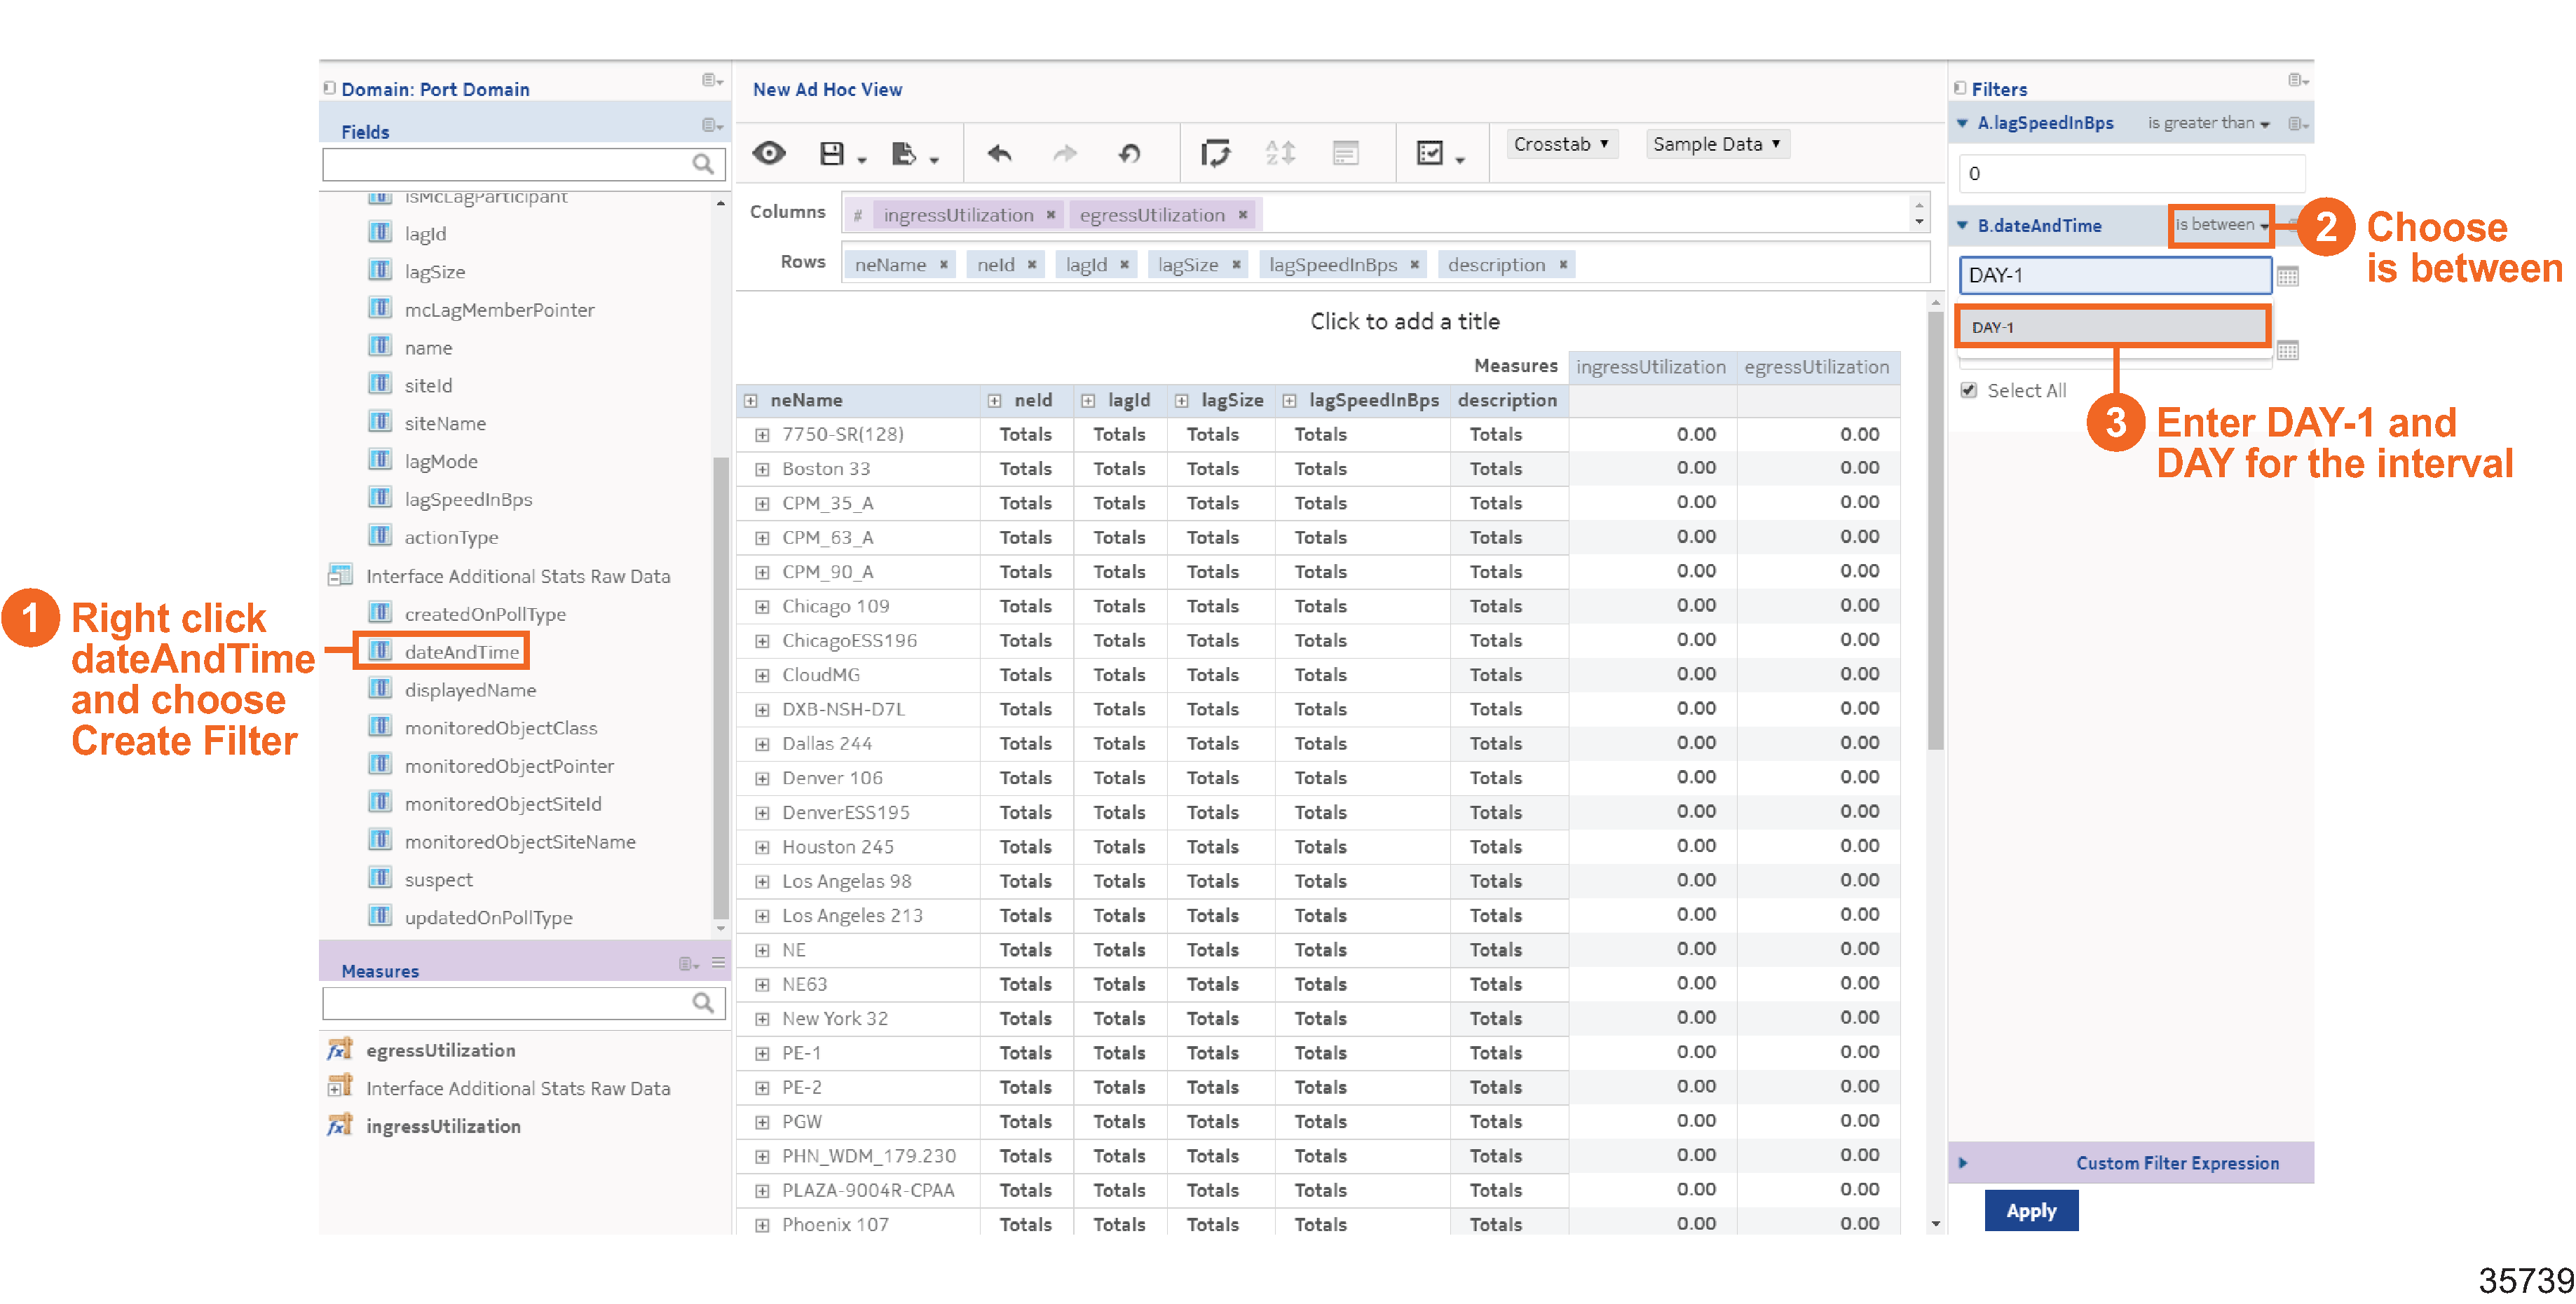
Set a second filter for date between previous day and current day.
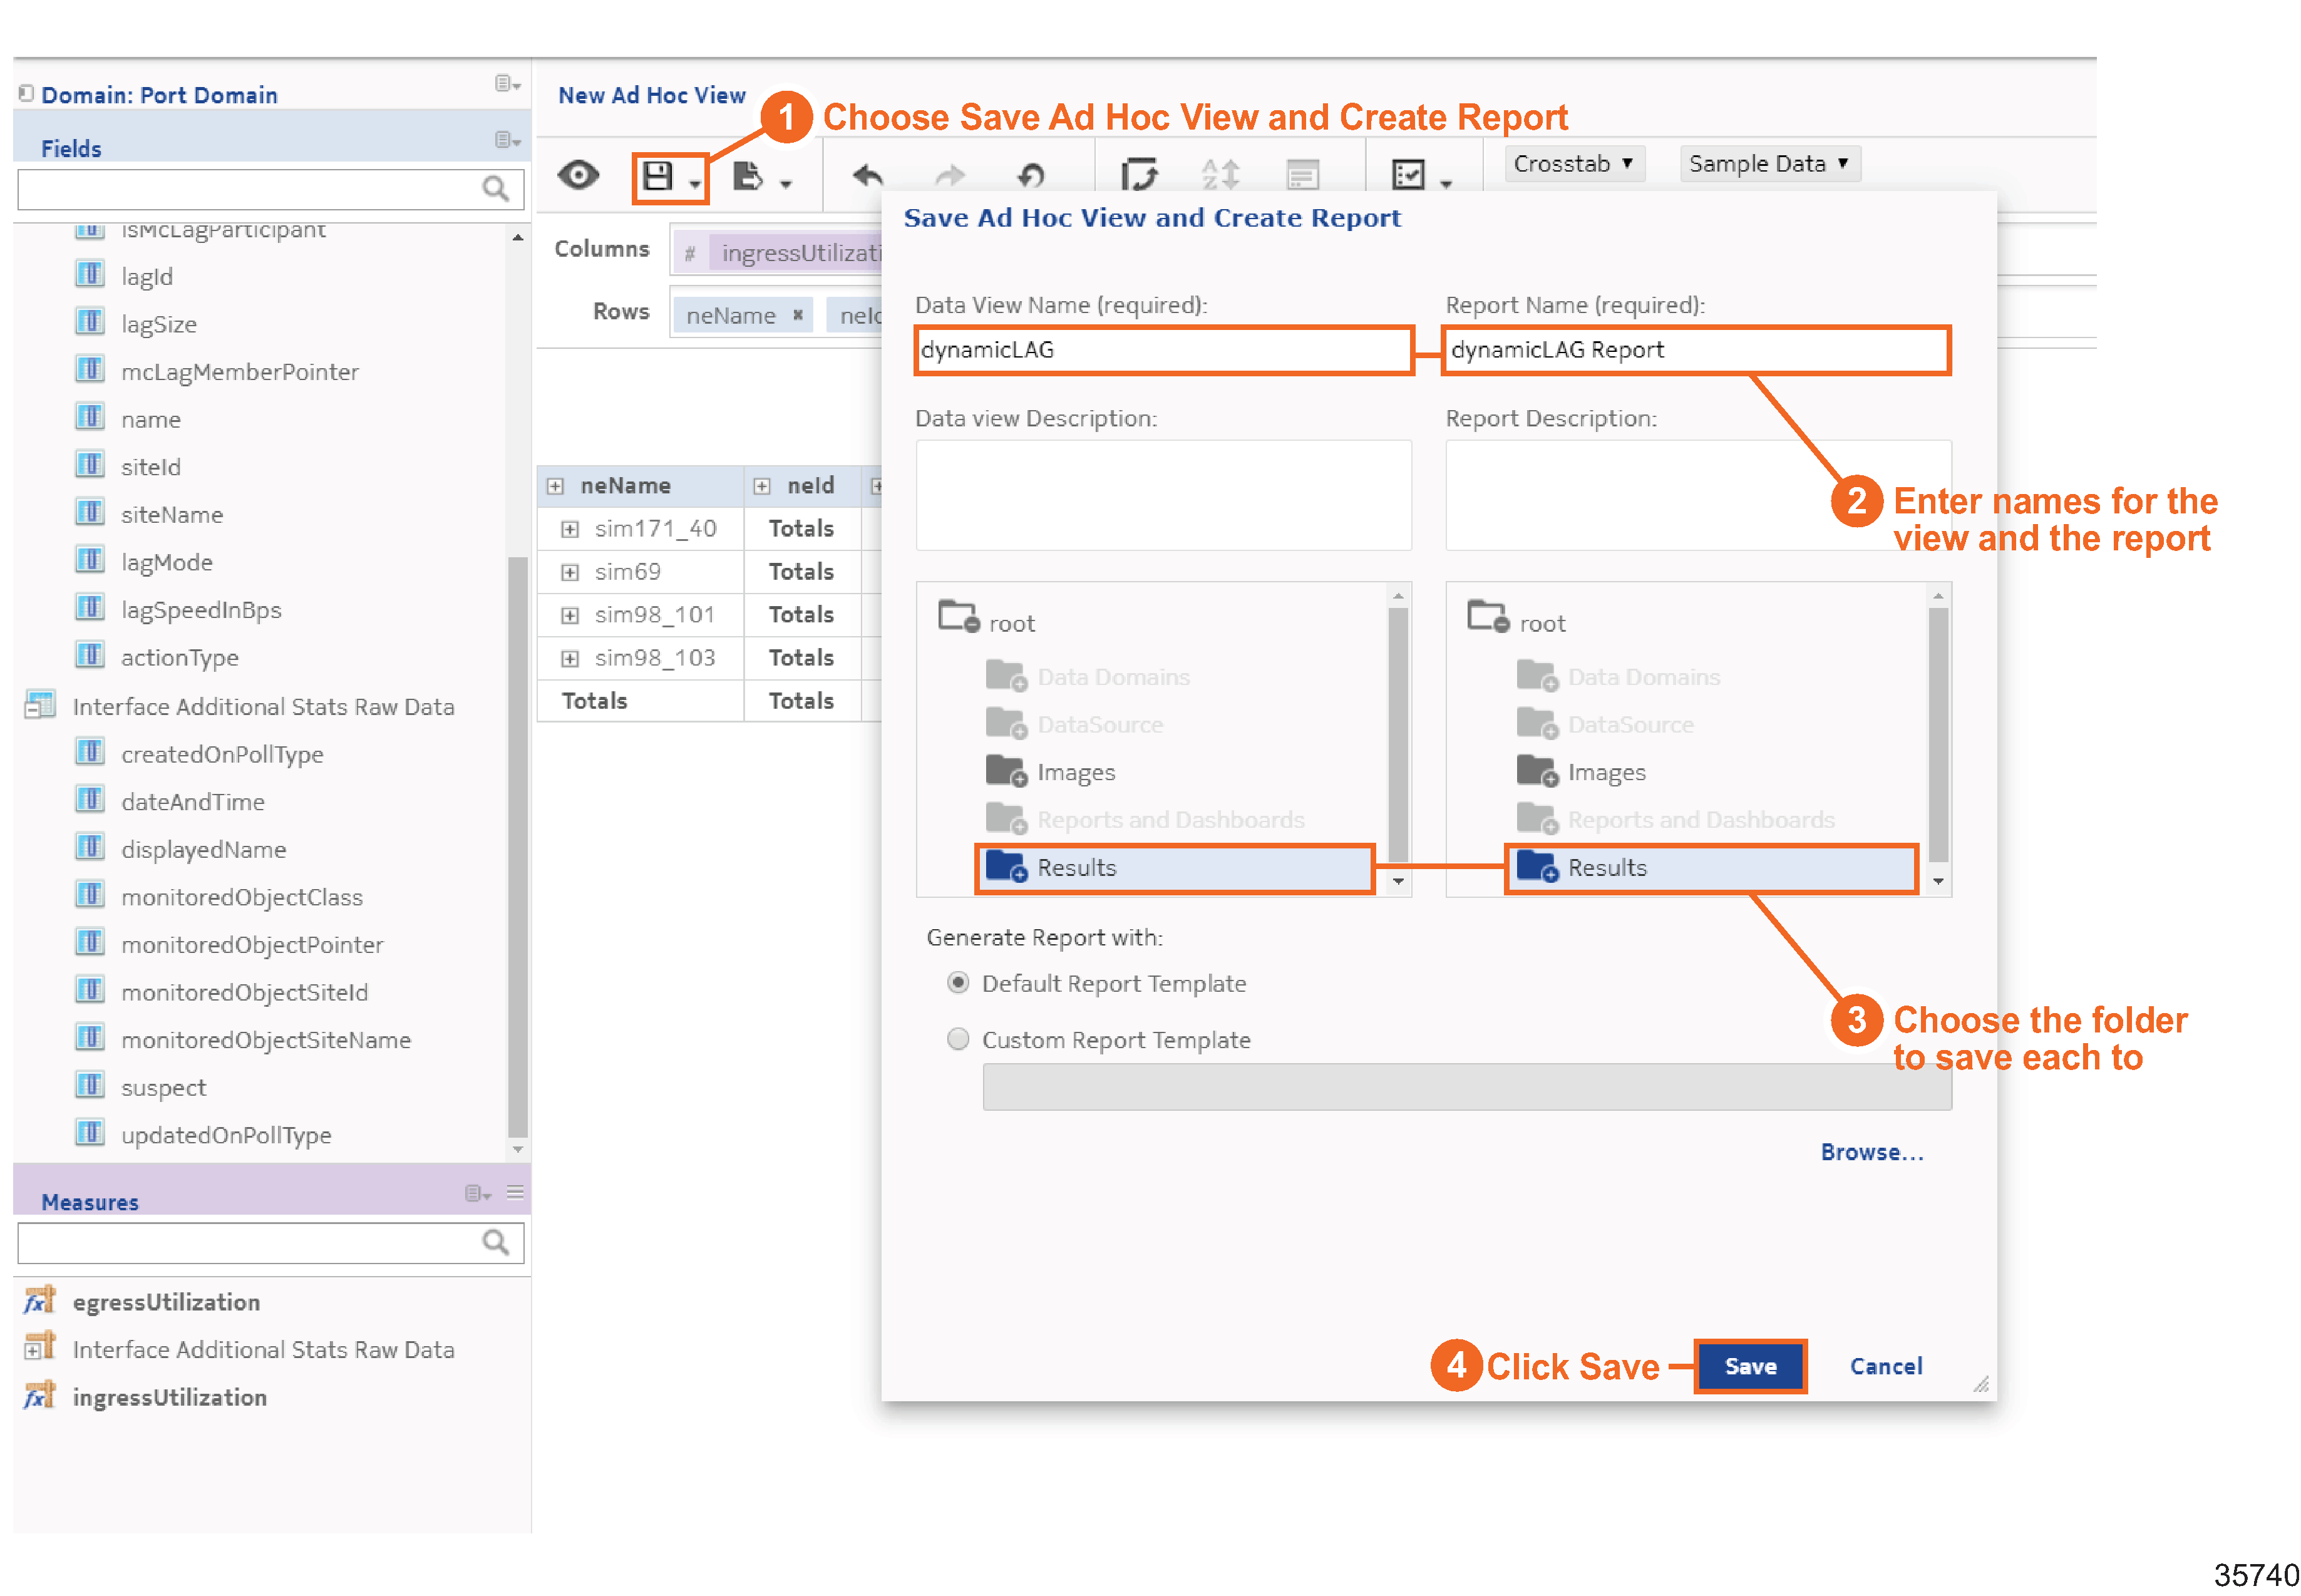
From the Save drop-down, choose Save Ad Hoc View and Create Report. Saving the Ad Hoc View will let us modify it in the future as needed. Creating the report allows us to run or schedule it.
We’re done
We have created a custom report for egress and ingress LAG utilization. From the Results folder where the report is stored, we can create a schedule to run the report periodically, and output results in the desired format. The customer can use these results to trigger updates based on LAG utilization when required.