How do I navigate a list?
Interacting with a list
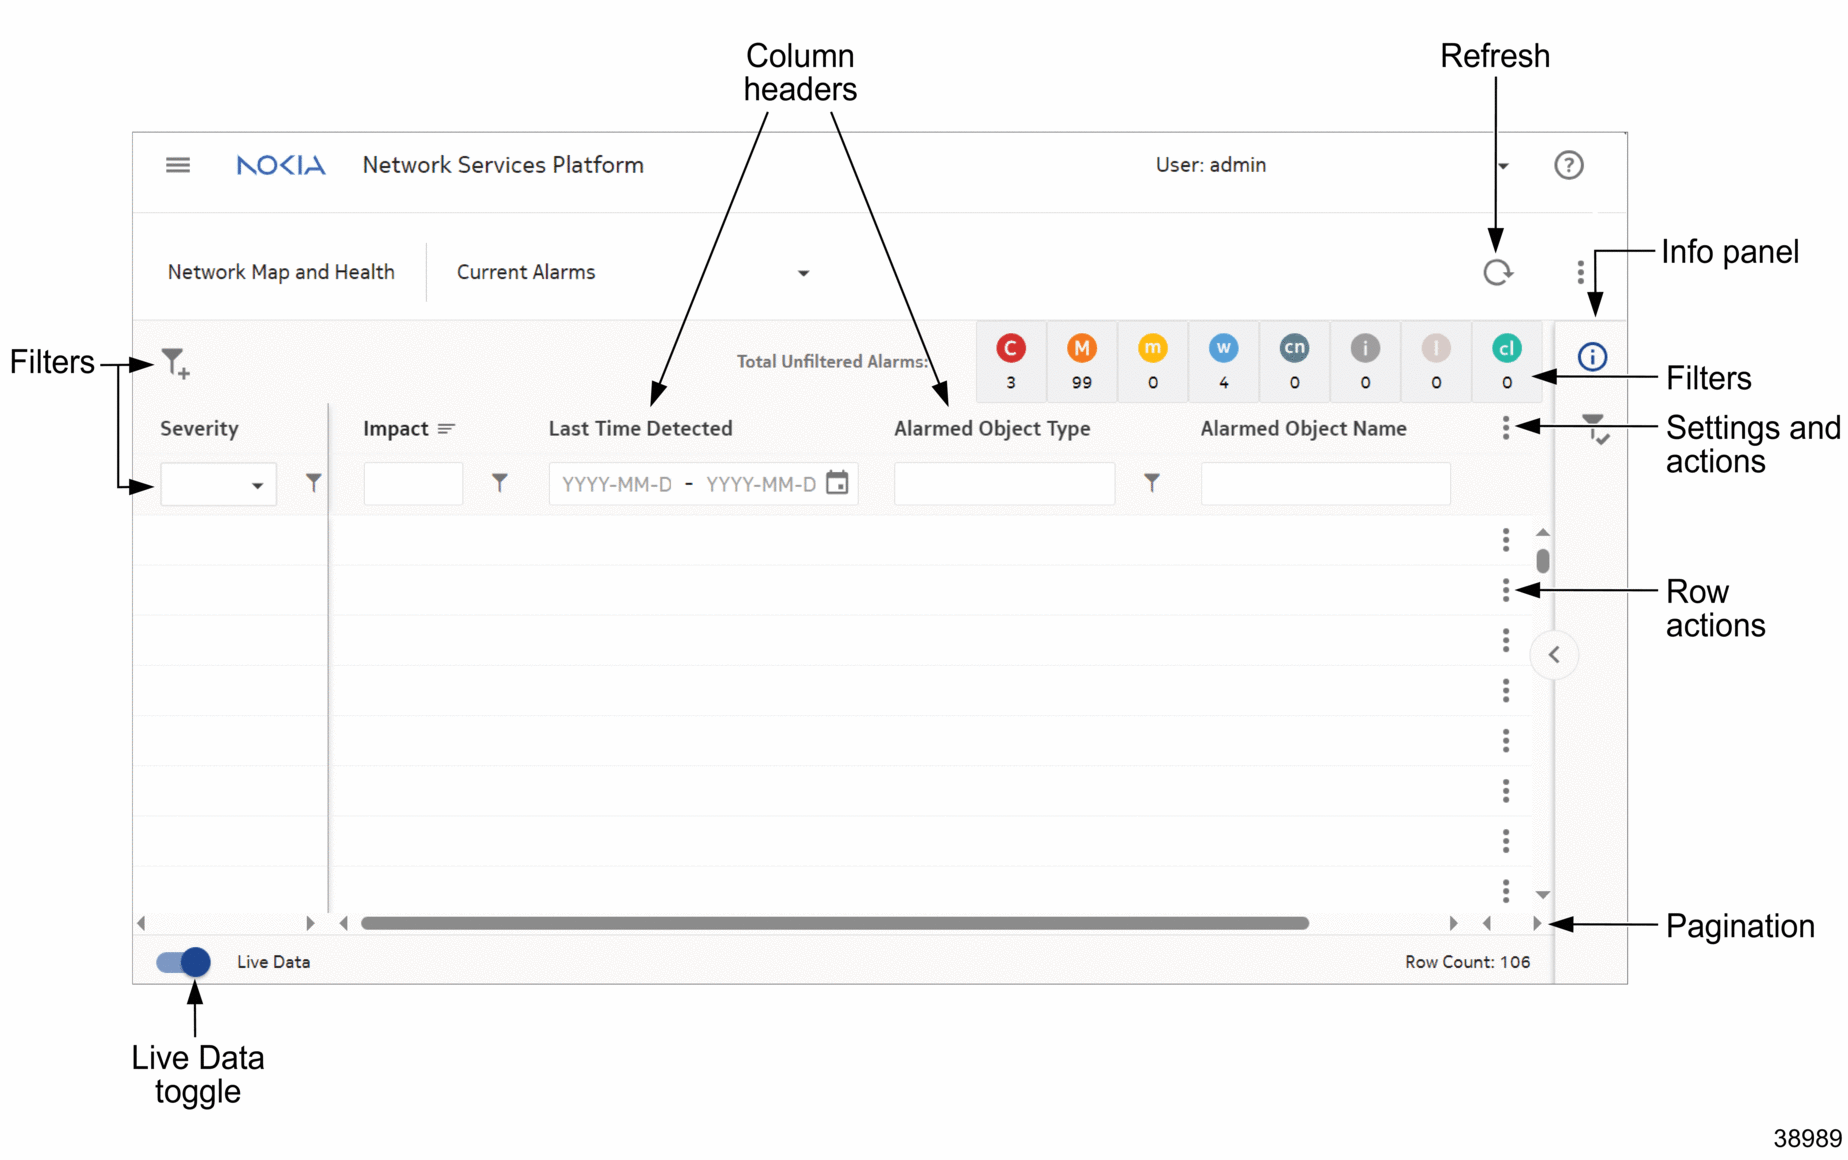
Lists share a common layout that generally comprise various components as shown in Figure 1-9, Common list layout. This may include:
-
Lists display information based on which view was selected in the view selector. Column headers group related data in each column. For example, the column header Severity groups the severity levels in Network Map and Health, Current Alarms. You can scroll the list left/right or up/down to see more of the available data, if applicable.
-
Rows contain information based on the view selected. For example, in Device Management, the Managed Network Elements view displays table rows representing individual NEs. You can right-click a row or click
 (Table row actions) for contextual menus.
 -
In
 (Table settings & actions) you can, for example clear filters or compact rows. The selection you make affects the entire list.
When needed, the lists are paginated. Use the page controls at the bottom of the screen to navigate between pages.
Note: If the total number of pages is not available from the data source, the page control shows “more” instead of the total, for example, 1/more. In this situation, entering a higher page number in the page number field displays the next page. For example, from page 1, if you enter 4, page 2 is displayed. This prevents problems caused by attempting to navigate to a page that does not exist. After the last page has been displayed, the page control shows the total number of pages and you can navigate to a specific page by number.
The list view is refreshed automatically when the optional Auto-refresh toggle is enabled at the bottom left corner of the screen. Use ![]() (Refresh) to refresh manually.
(Refresh) to refresh manually.
Figure 1-9: Common list layout

Filters
Depending on the view selected, lists can be filtered in the following ways:
-
use
 (Filter menu) to filter using an alphabetic string or use the drop-down for a timeframe.
 -
use the filtering tabs located on the right-hand side above the column headers as shown in Figure 1-9, Common list layout. Alarms can be sorted by severity. For example, “C” filters objects with critical severity only; “M” filters those with major severity; and so on.
Individual dashlets can be filtered by timeframe. For example, in Network Map and Health, Overview, some dashlets show the default time range “Last Hour.” This can be adjusted by choosing a different value from the drop-down options.
To configure the way information is displayed in lists, see How do I manage the display of listed information?.