How do I navigate a graph?
Interacting with a graph
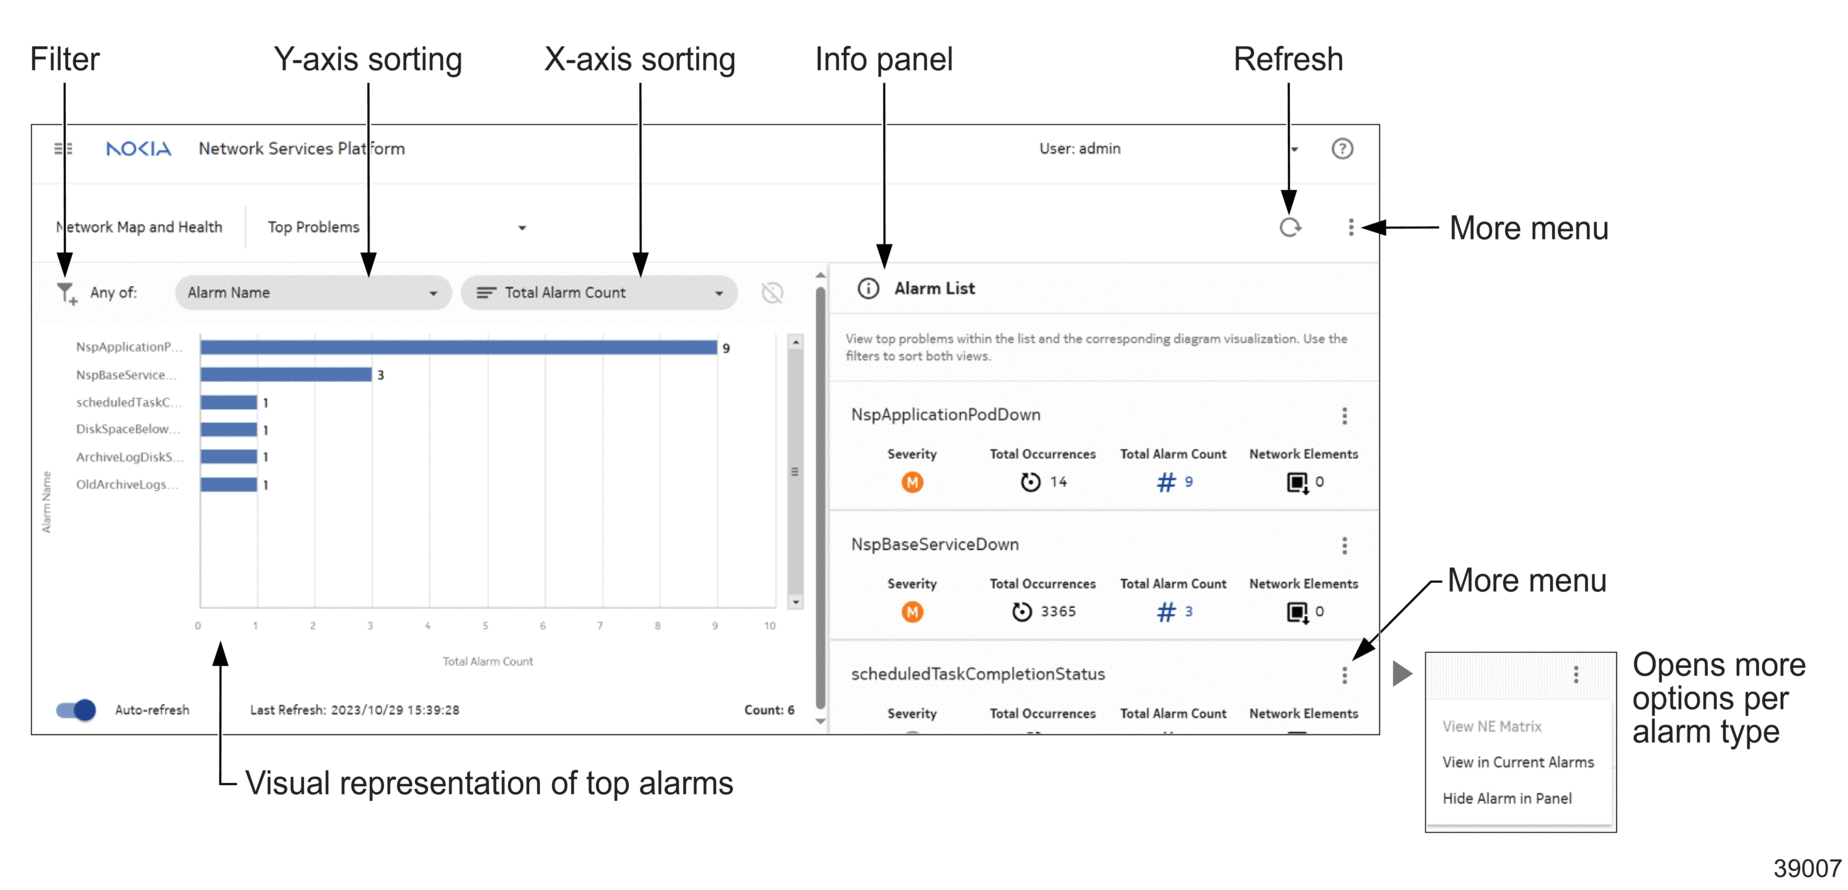
Graphs are visual representations of statistical information based on the view chosen. For example, Network Map and Health, Top Problems describes the total number of times an alarm appears within the network.
Graphs can be filtered and sometimes sorted based on x- and y-axes. See for example Network Map and Health, Top Problems in Figure 1-10, Common graph layout.
![]() , (More Menu), Settings provides access to Fault Management and Network Assurance settings.
, (More Menu), Settings provides access to Fault Management and Network Assurance settings.
The graph view is refreshed automatically when the Auto-refresh toggle at the bottom left corner is enabled. Use ![]() (Refresh) to manually refresh.
(Refresh) to manually refresh.
The info panel lists each item of the diagram visualization in more detail. For example, the Network Map and Health, Top Problems info panel shows a detailed alarm list with more menu options.
Figure 1-10: Common graph layout
