How do I navigate a dashboard?
Interacting with a dashboard
A dashboard is a summary of a functional area within NSP. For example, the Network Map and Health dashboard summarizes information about the network, including KPI trending information as shown in Figure 1-1, Banner bar. See the NSP Network and Service Assurance Guide for detailed descriptions of KPI trending indicators and how to check KPI trending.
The Object Troubleshooting dashboard summarizes information about specific objects which may include NEs, services, ports, links, and so on.
Contextual actions in a dashboard may include linking to other areas of NSP, filtering information, or adding an object to a watchlist.
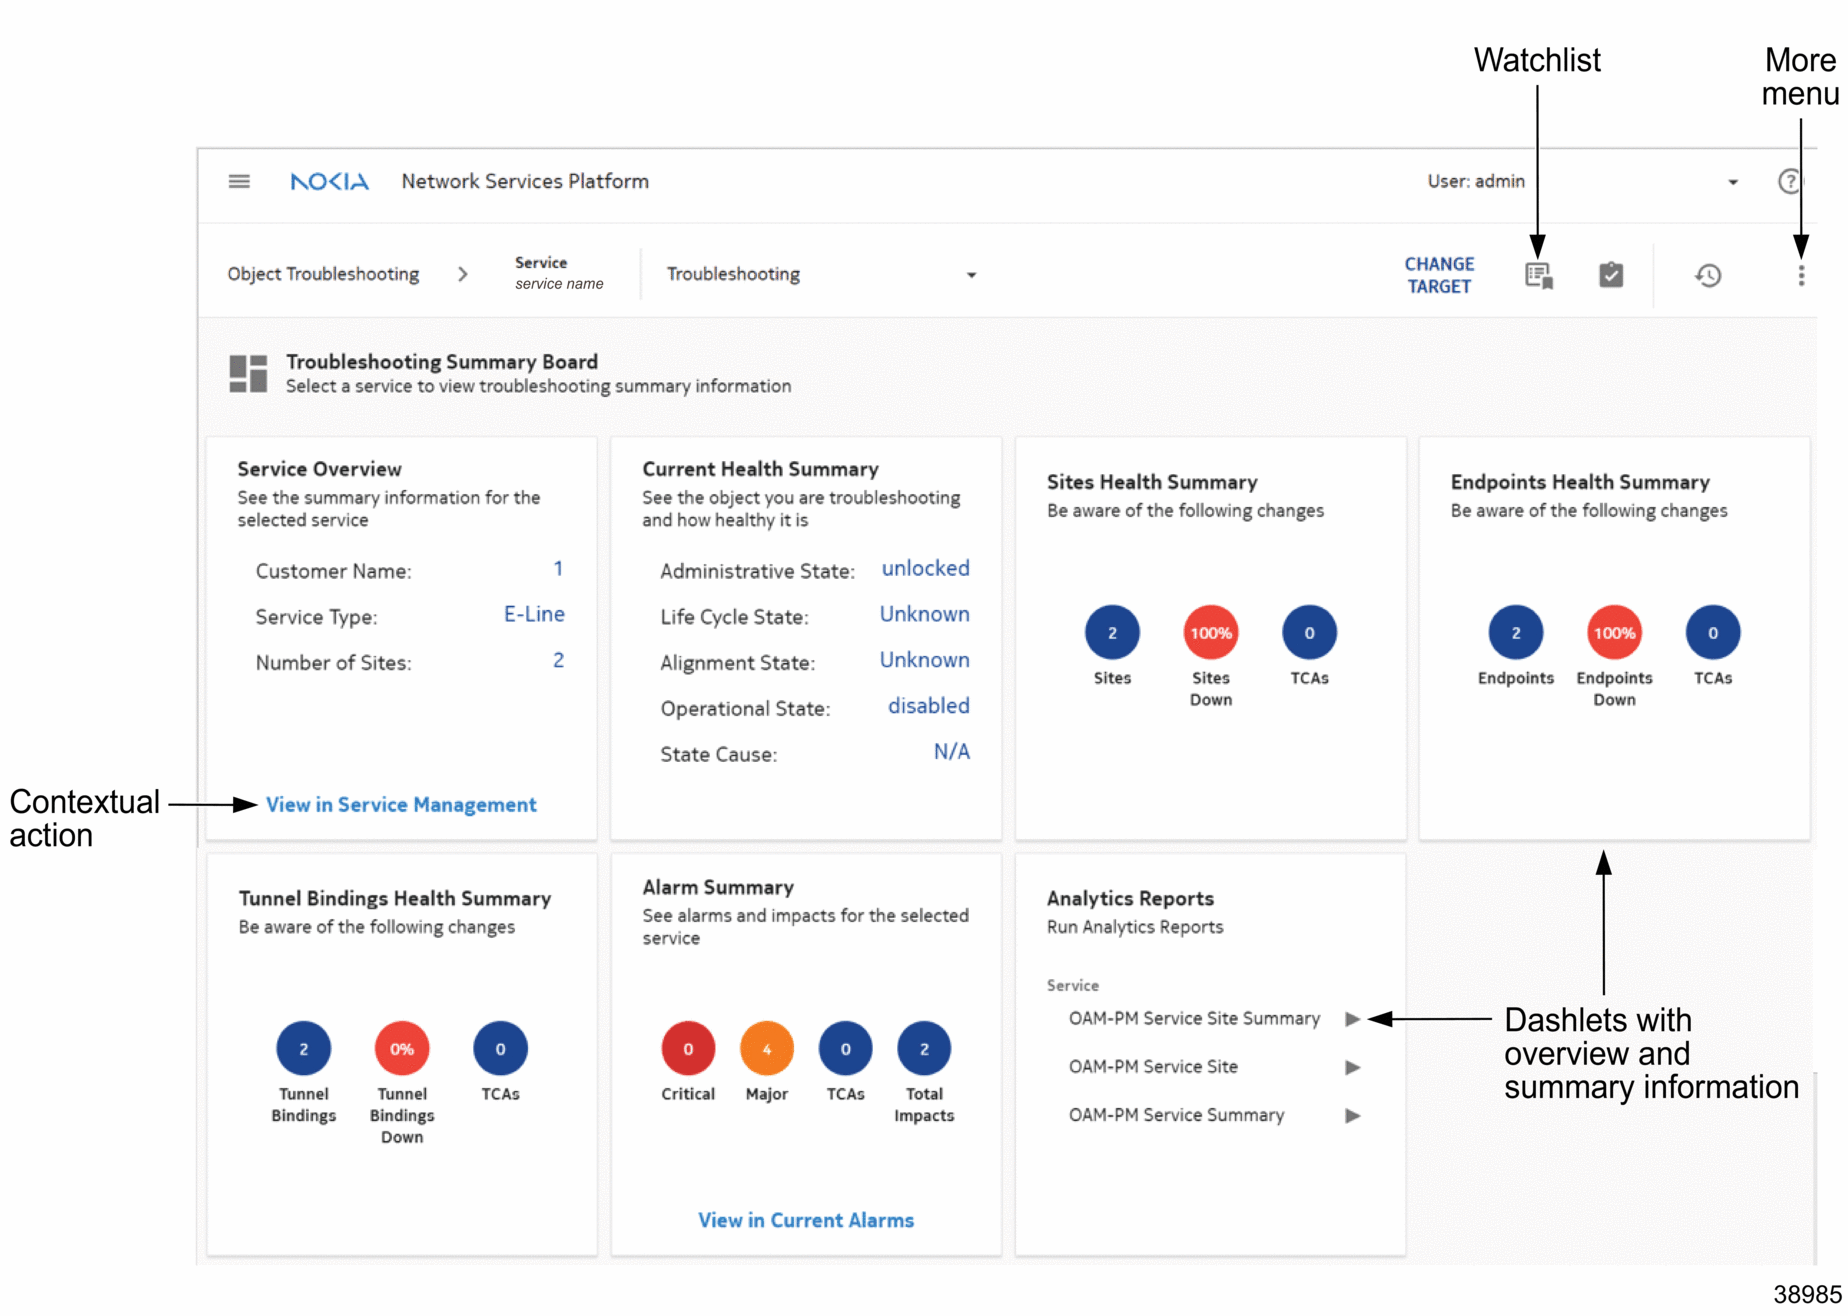
Figure 1-5, Dashboard overview shows some of the elements a dashboard may contain.
Figure 1-5: Dashboard overview
