Evaluating failed or slow workflow executions
Purpose
This article shows you how to evaluate failed or slow workflow executions and troubleshoot the source of workflow errors.
Parent workflows and sub-workflows
Workflows may call other workflows as part of their execution. Both the parent workflow and the sub-workflow appear in the Workflow Execution list.
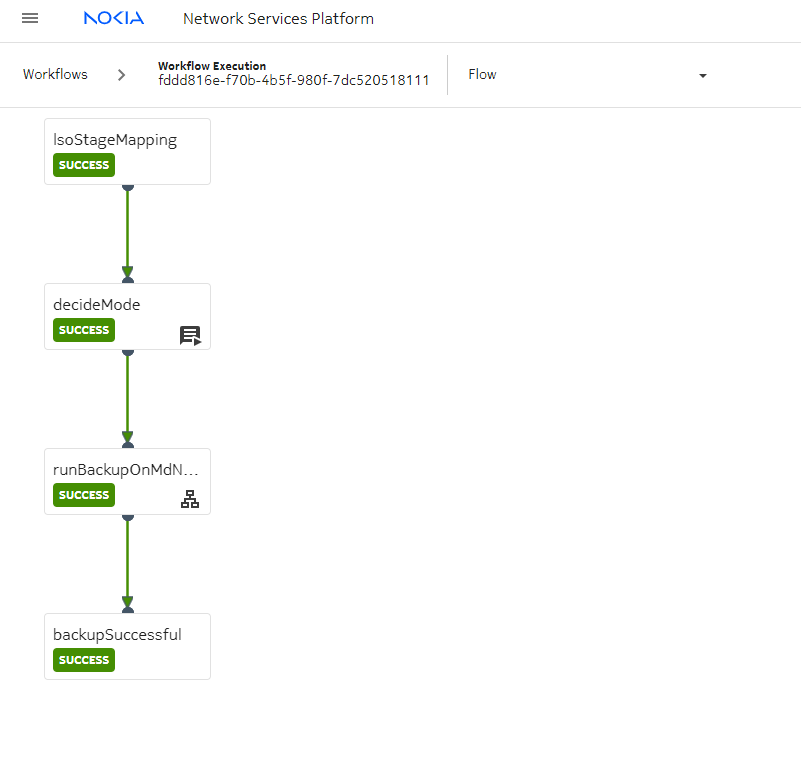
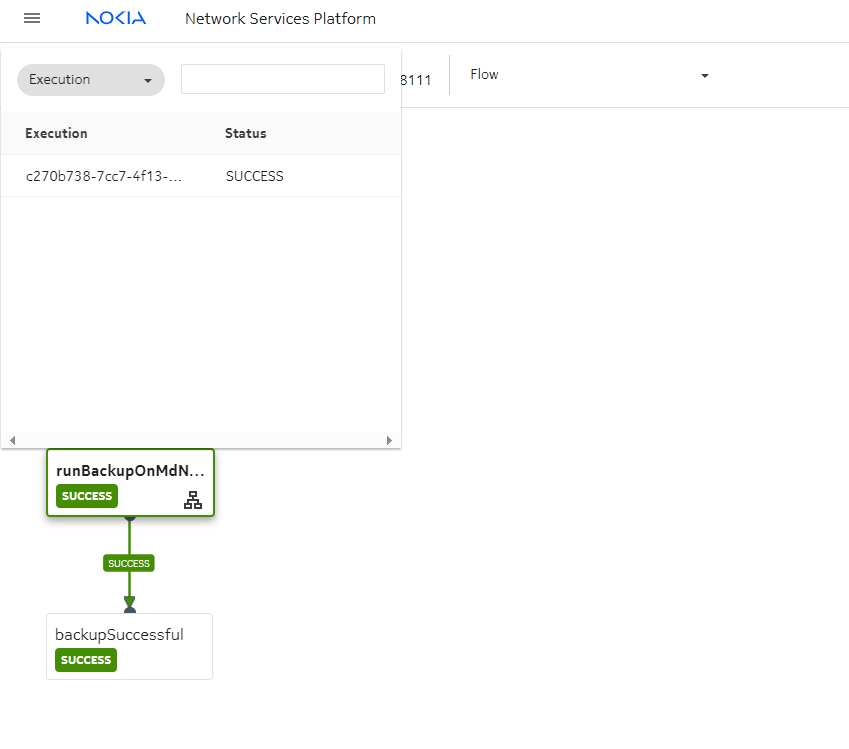
If a workflow execution’s Executed by parameter is blank, the workflow was executed by another workflow, as shown in the following figure.
Note the Created field for these example executions. The LSO_7x50_Backup_MD_Mixed sub-workflow execution was created at the same time as the LSO_7x50_Backup workflow execution. The LSO_7x50_Backup may be the parent workflow that created this failed execution.
Start your troubleshooting with a parent workflow to ensure that you see all the relevant information.
Check the information page of a successful execution
If you have an example of a successful execution of the workflow, it can help you narrow your search for the source of issues with slow or failing workflows.
Check the process of a slow workflow
1 |
Double-click on a workflow execution, and select Tasks from the Info drop-down. The Tasks list shows the time stamps when each task was created, and each task’s run time. The Created column shows the time since the task was created. Hover over a time in the Created column to see the precise time of creation. |
2 |
Check for delays in the sequence of tasks. For example, if one task was created at midnight and had a run time of 2 seconds, the following task should be created at 2 seconds after midnight. |
3 |
If there are delays, NSP is experiencing slowness due to memory usage. When database usage is high, it takes longer than expected to query the database for the next action. If you are experiencing these delays, your cleanup policy may need to be adjusted. For more information, see the NSP Network Automation Guide. End of steps |
Check concurrency
If a workflow is experiencing slowdowns or API errors, check for tasks with loops and ensure the concurrency is set correctly. If NSP is creating too many actions at one time, the workflow database could be impacted, causing slowdowns, or APIs could be overwhelmed with too many simultaneous calls.
1 |
From the Workflows page, double click on a workflow to open the Info page. Choose Definition from the Info drop-down. |
2 |
In the YAML panel, search for a task with a with-item statement. The with-item statement provides the number of times the task will initiate the action. |
3 |
Verify that any task with a with-item statement also has a concurrency property set. The concurrency property sets a limit on the number of times the task will create the action concurrently. For example, if the concurrency is set to 1, the task will create the action once and wait for it to complete before executing it again. |
4 |
Ensure that the concurrency value and the size of the with-items loop are appropriate for the task. For example, if the task is an API call, ensure that the concurrency is low enough to prevent the resource from being overwhelmed with simultaneous API calls. Remember that this workflow may not be the only entity calling the API at the time you execute it. End of steps |
Check task output
If a workflow is experiencing slowdowns or getting stuck in a Running state, resource usage may be impacted by large amounts of output.
1 |
From the Workflows page, double click on a workflow to open the Info page. Choose Definition from the Info drop-down. |
2 |
In the YAML panel, search for the output statements for the tasks and the workflow itself, as applicable. |
3 |
Ensure that output for all tasks is as minimal as possible. This minimizes the database usage of each task execution and helps to prevent resource overload. For more information; see the Mistral documentation and the Best Practices section in the Network Automation tutorial on the Network Developer Portal. End of steps |
Heartbeat errors
A Heartbeat not received error occurs when a workflow attempts to contact an API or NSP and no response is received within ten minutes. Check logs to verify the source of the error.
1 |
Check the logs for the Mistral executor to see whether responses were received from the other entity. |
2 |
Check logs for the RabbitMQ messaging bus to see whether there was an interruption to monitoring, which may have caused Mistral to miss a response. End of steps |


