End-to-end port troubleshooting scenario

Purpose

This process shows you how to use NSP in troubleshooting issues on ports.

In this scenario, a service has been affected or an alarm has come up. Investigation will show that the problem is due to a port issue.

View the Object Troubleshooting dashboard

Viewing a target in the Object Troubleshooting dashboard can help you see where else you can look to investigate a problem.


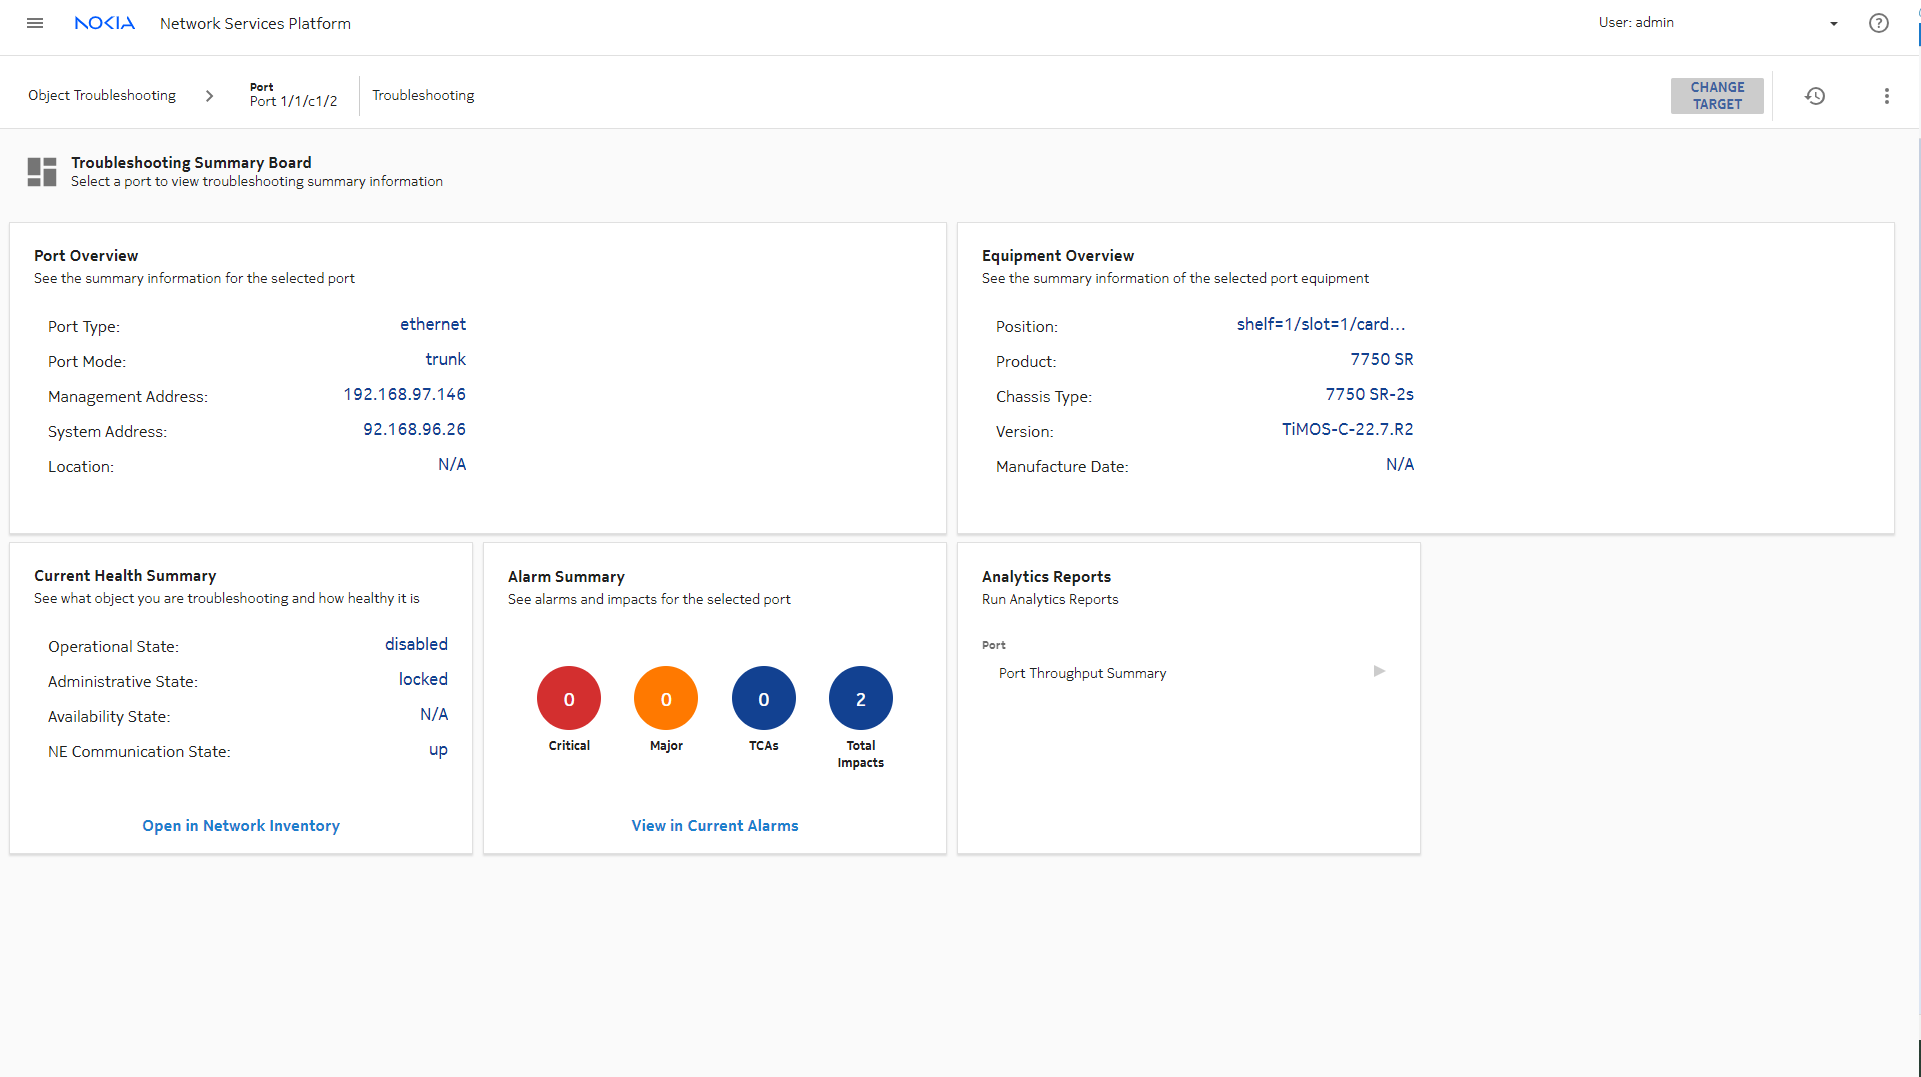
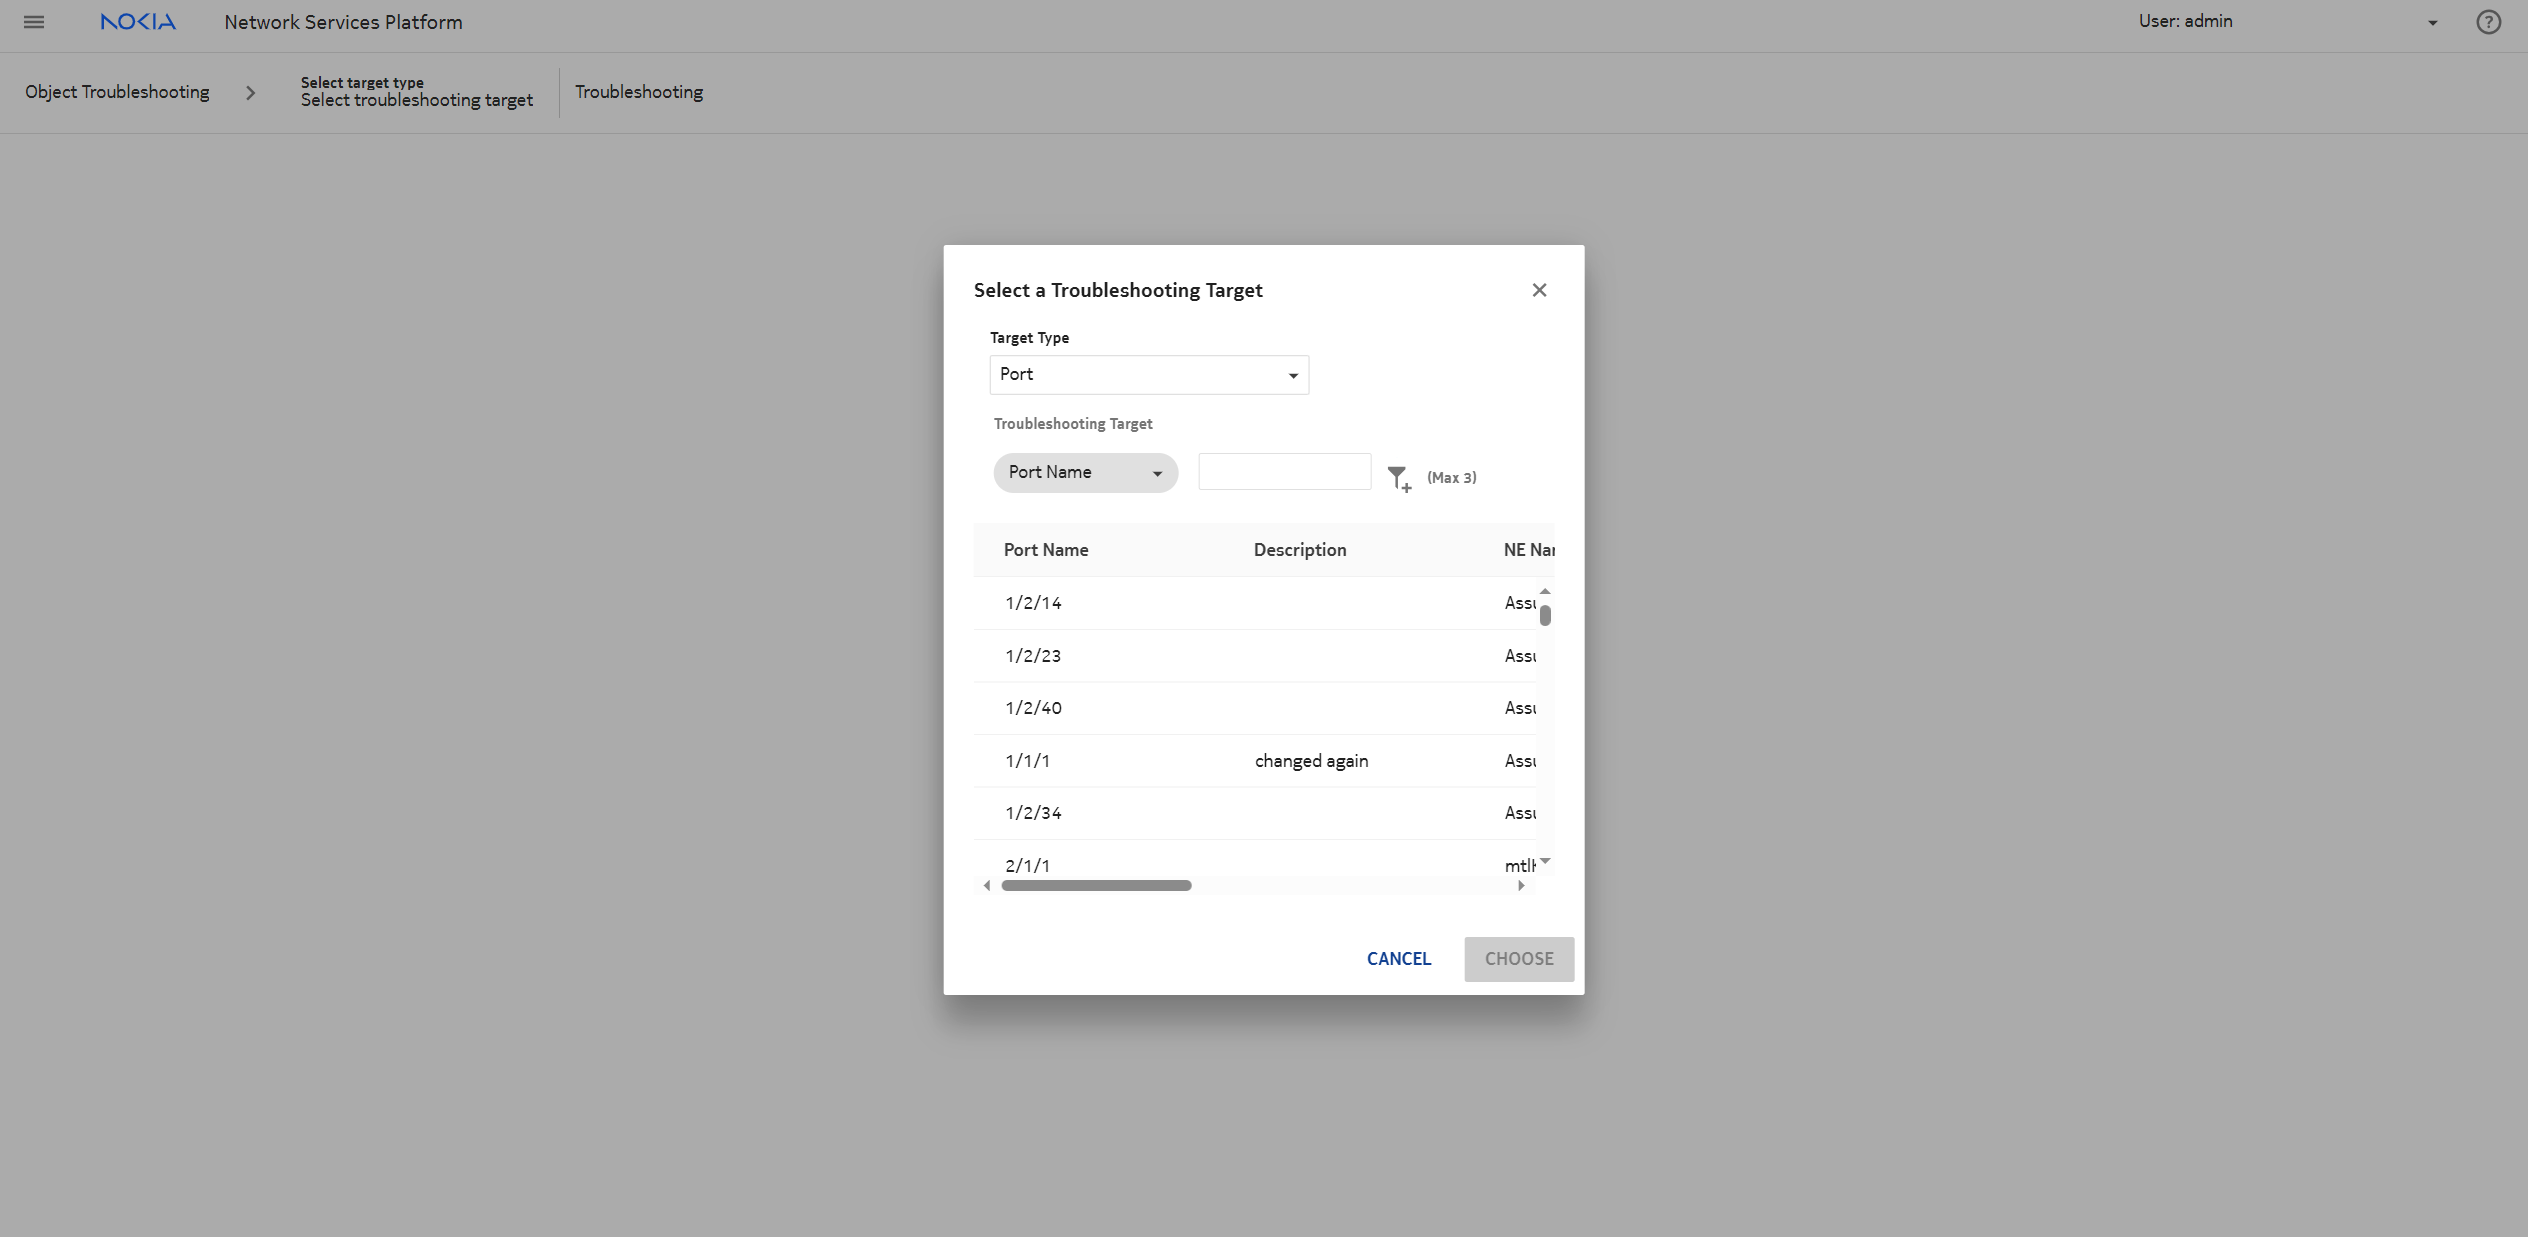
Start from the Object Troubleshooting dashboard, select Port for Target Type, and then select the target port of interest.


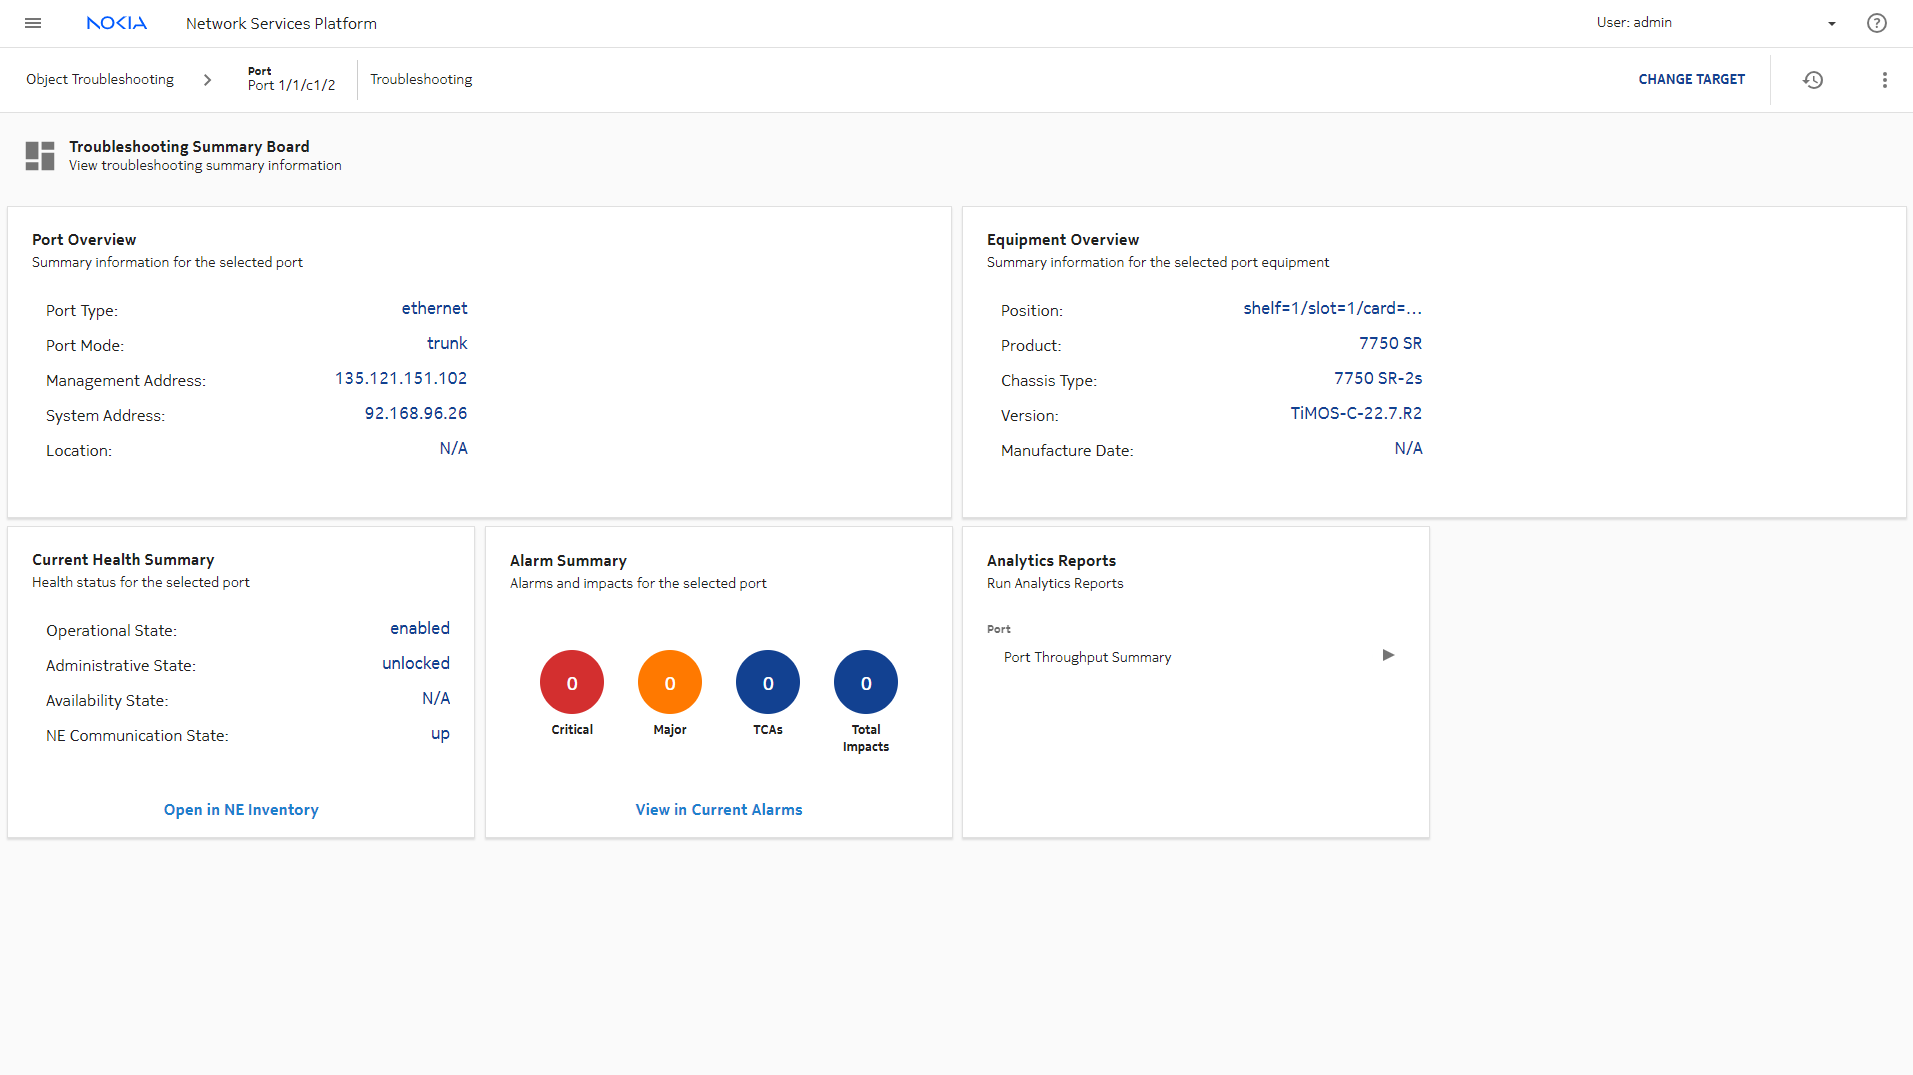
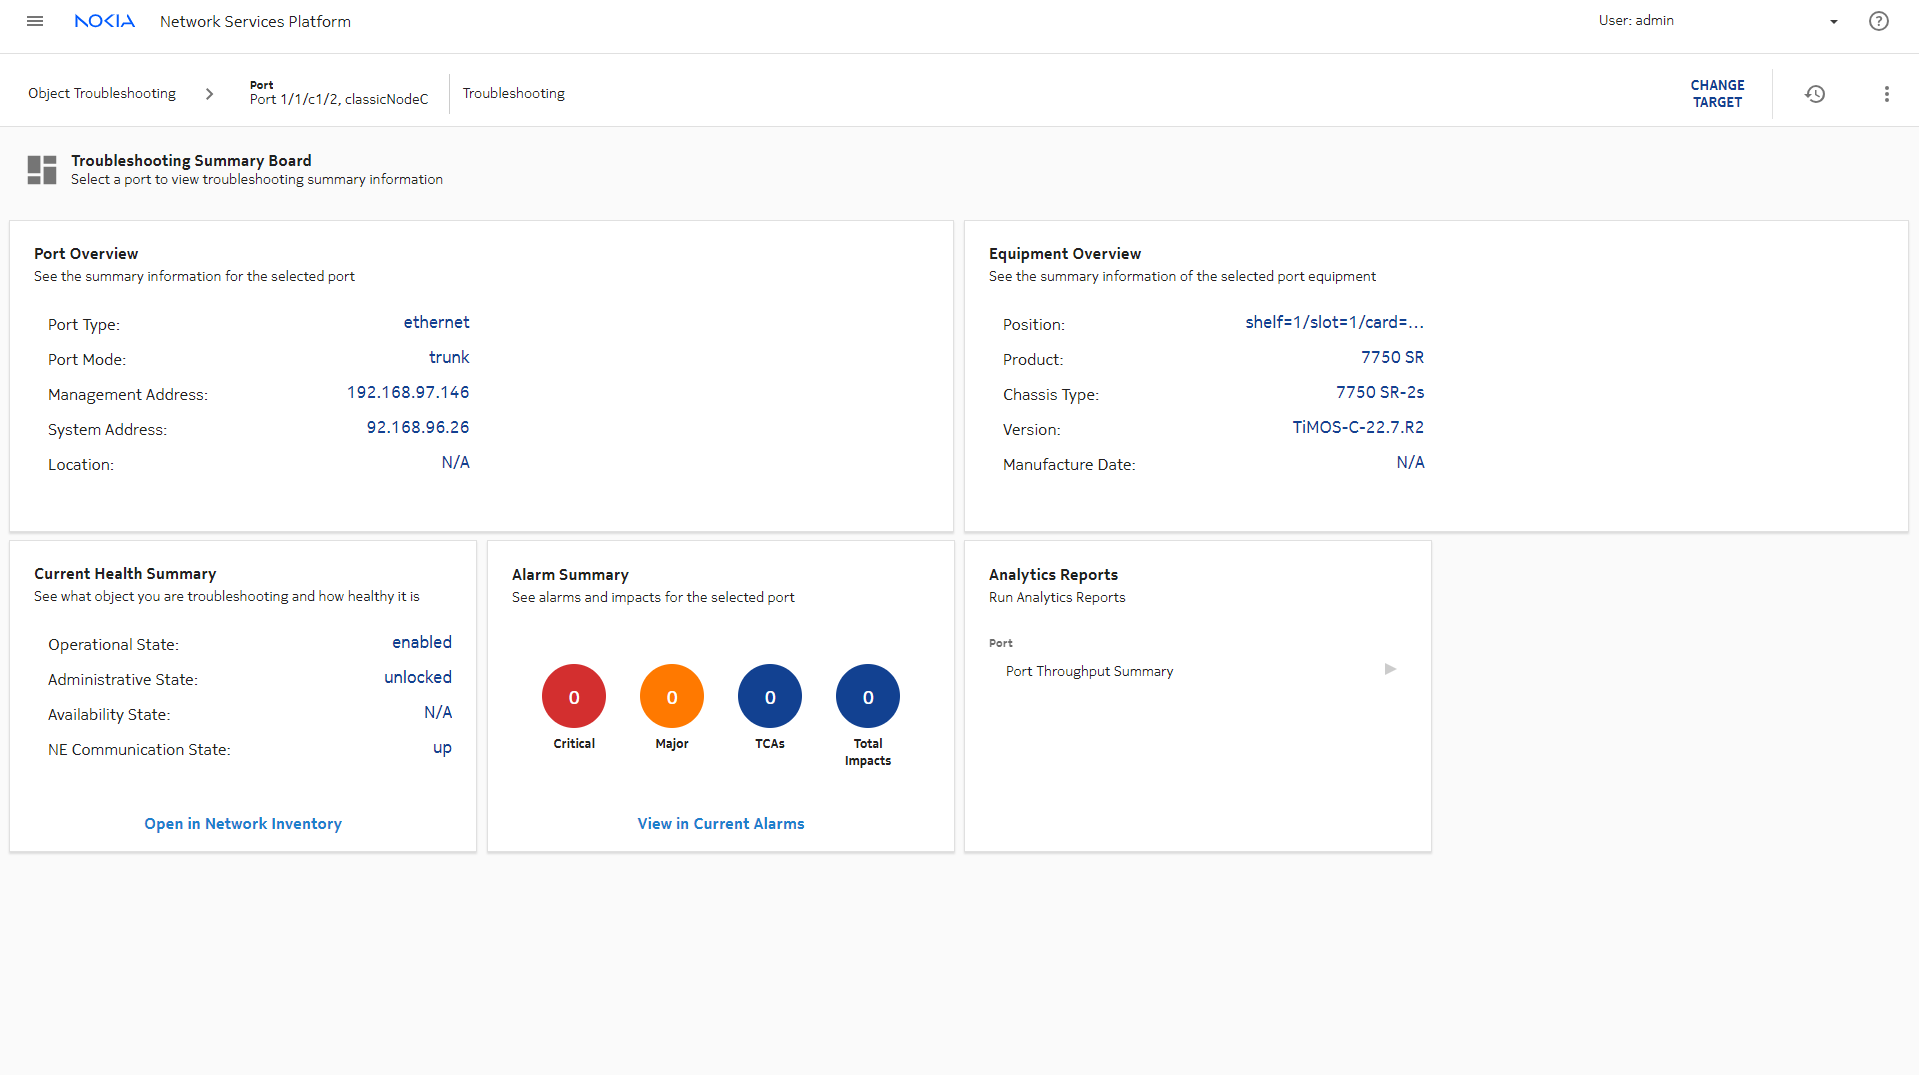
The Object Troubleshooting dashboard displays summaries of information about the port. The Alarm Summary shows that an alarm is present, and the Current Health Summary shows the operational and administrative states.


Use CHANGE TARGET if the wrong port is selected or if you wish to troubleshoot a different port.


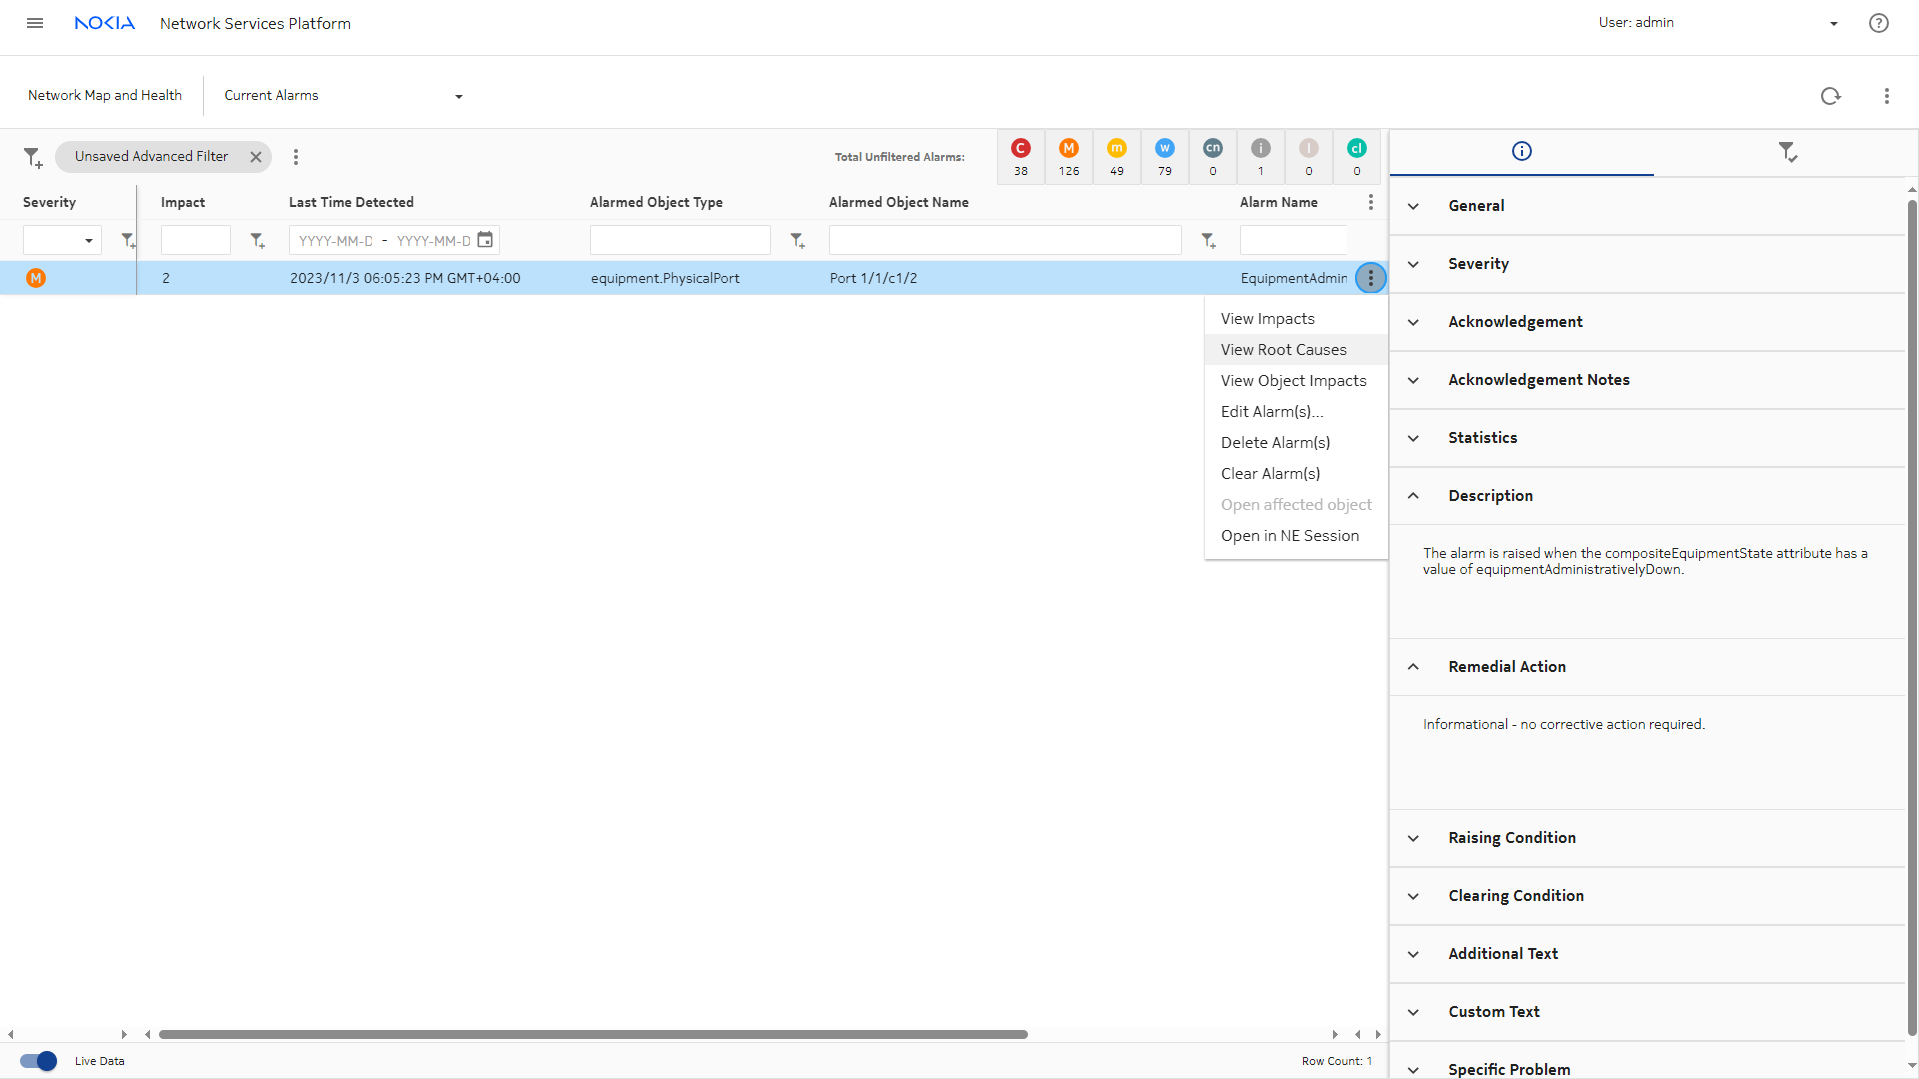
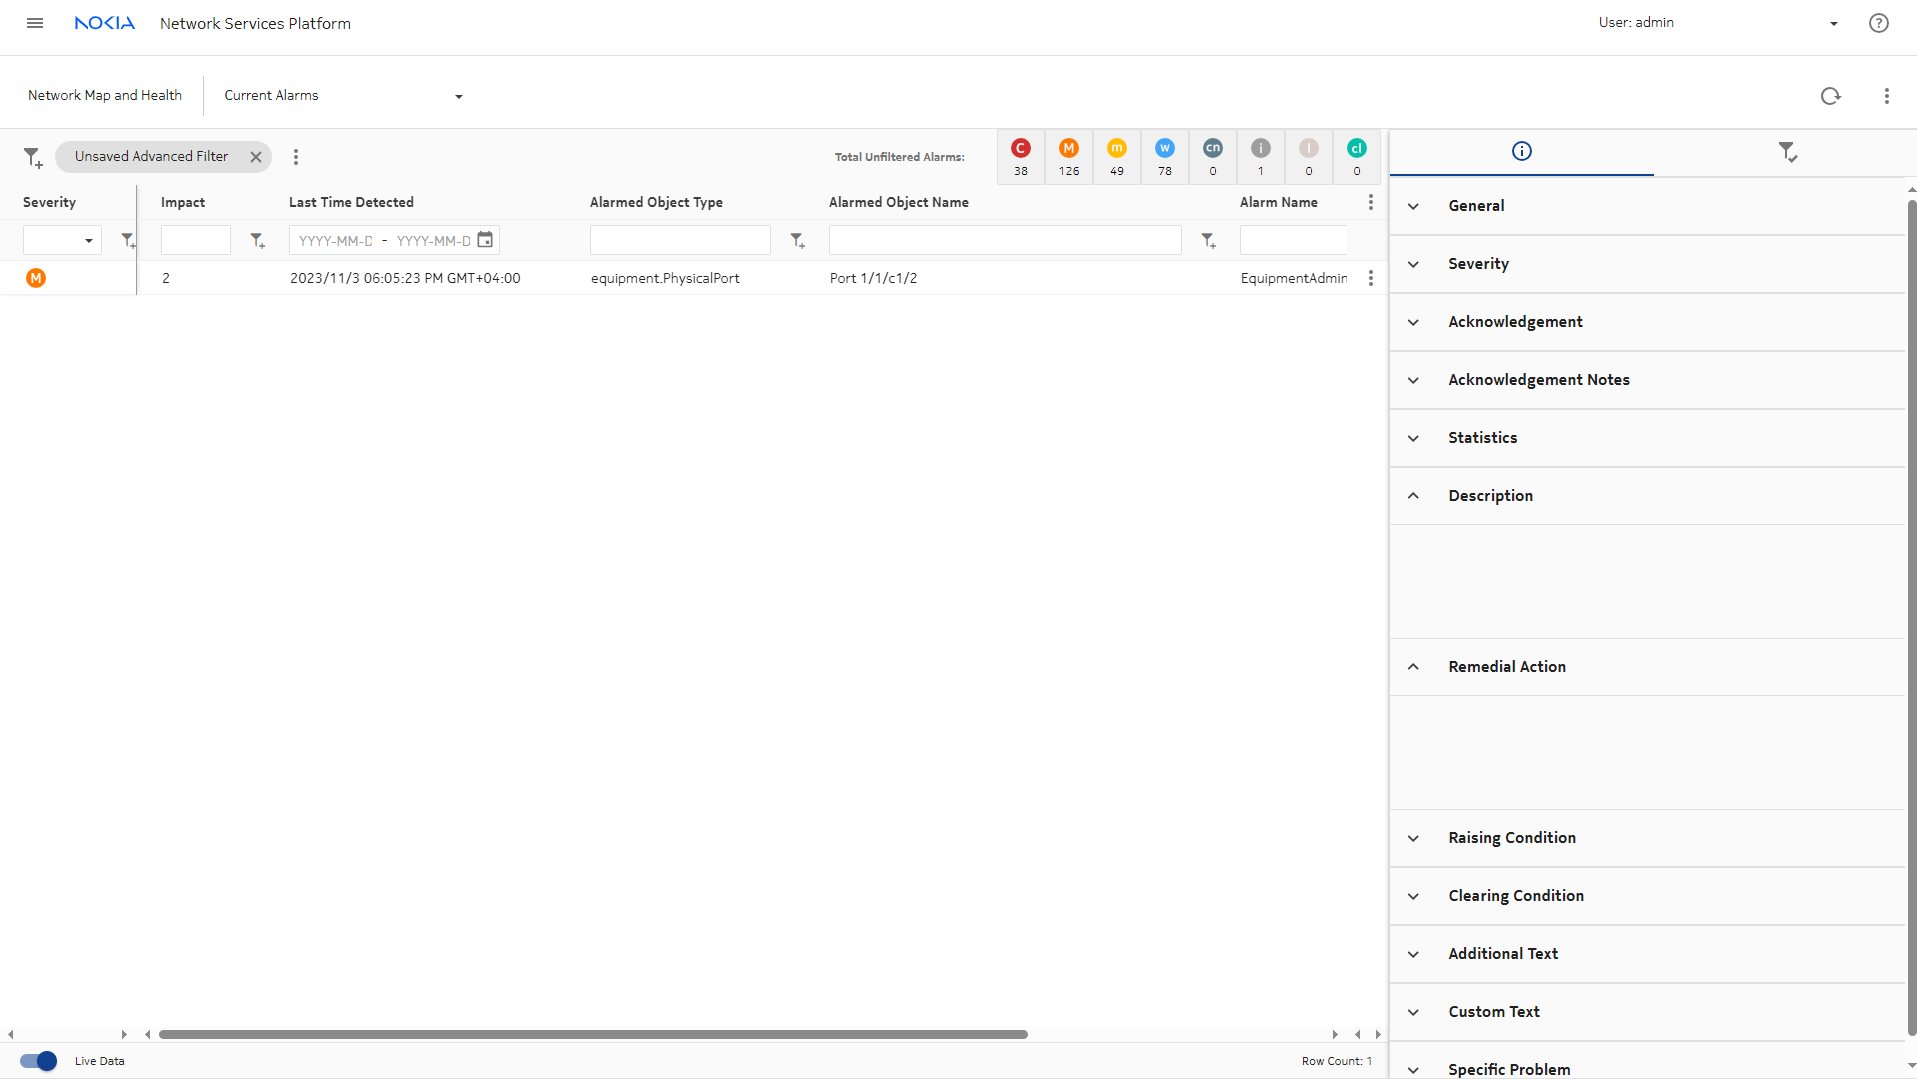
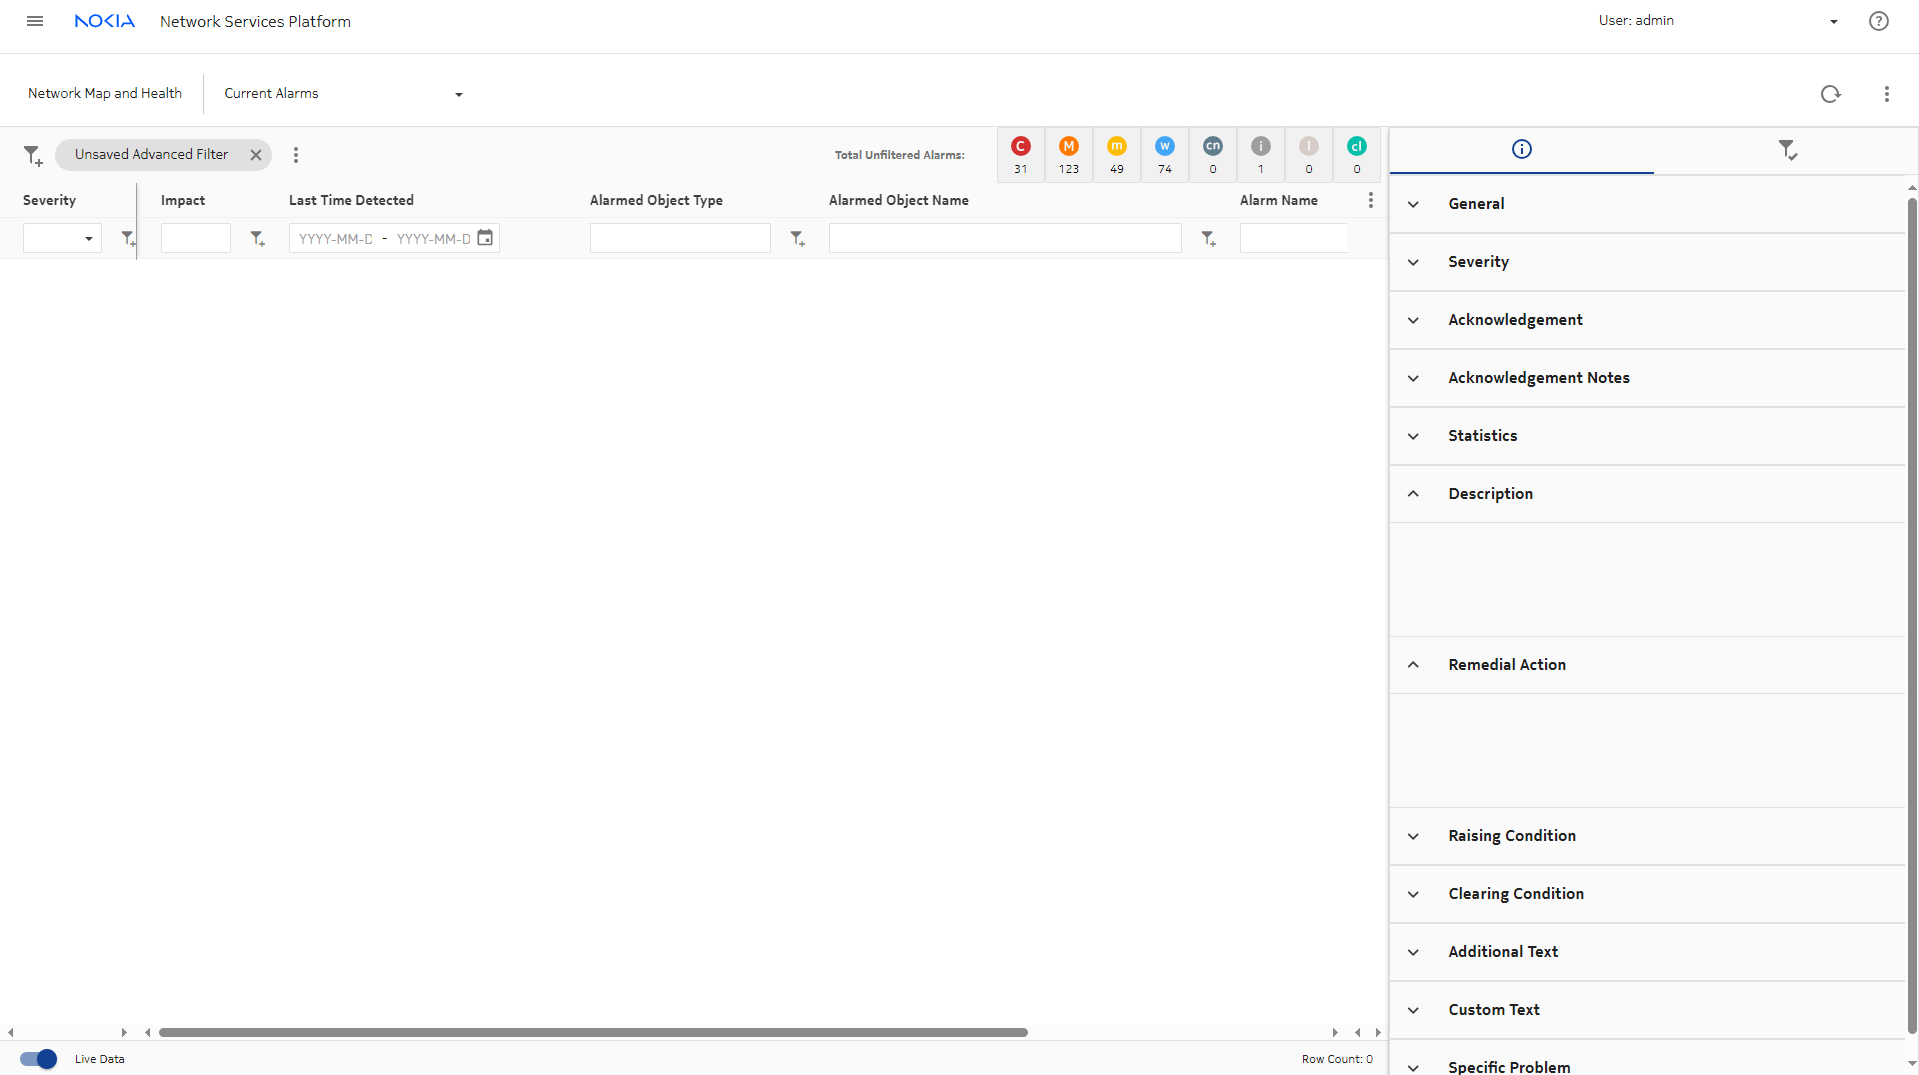
Click the Major alarm circle in the Object Troubleshooting dashboard to launch Current Alarms, with that pertinent alarm filtered.


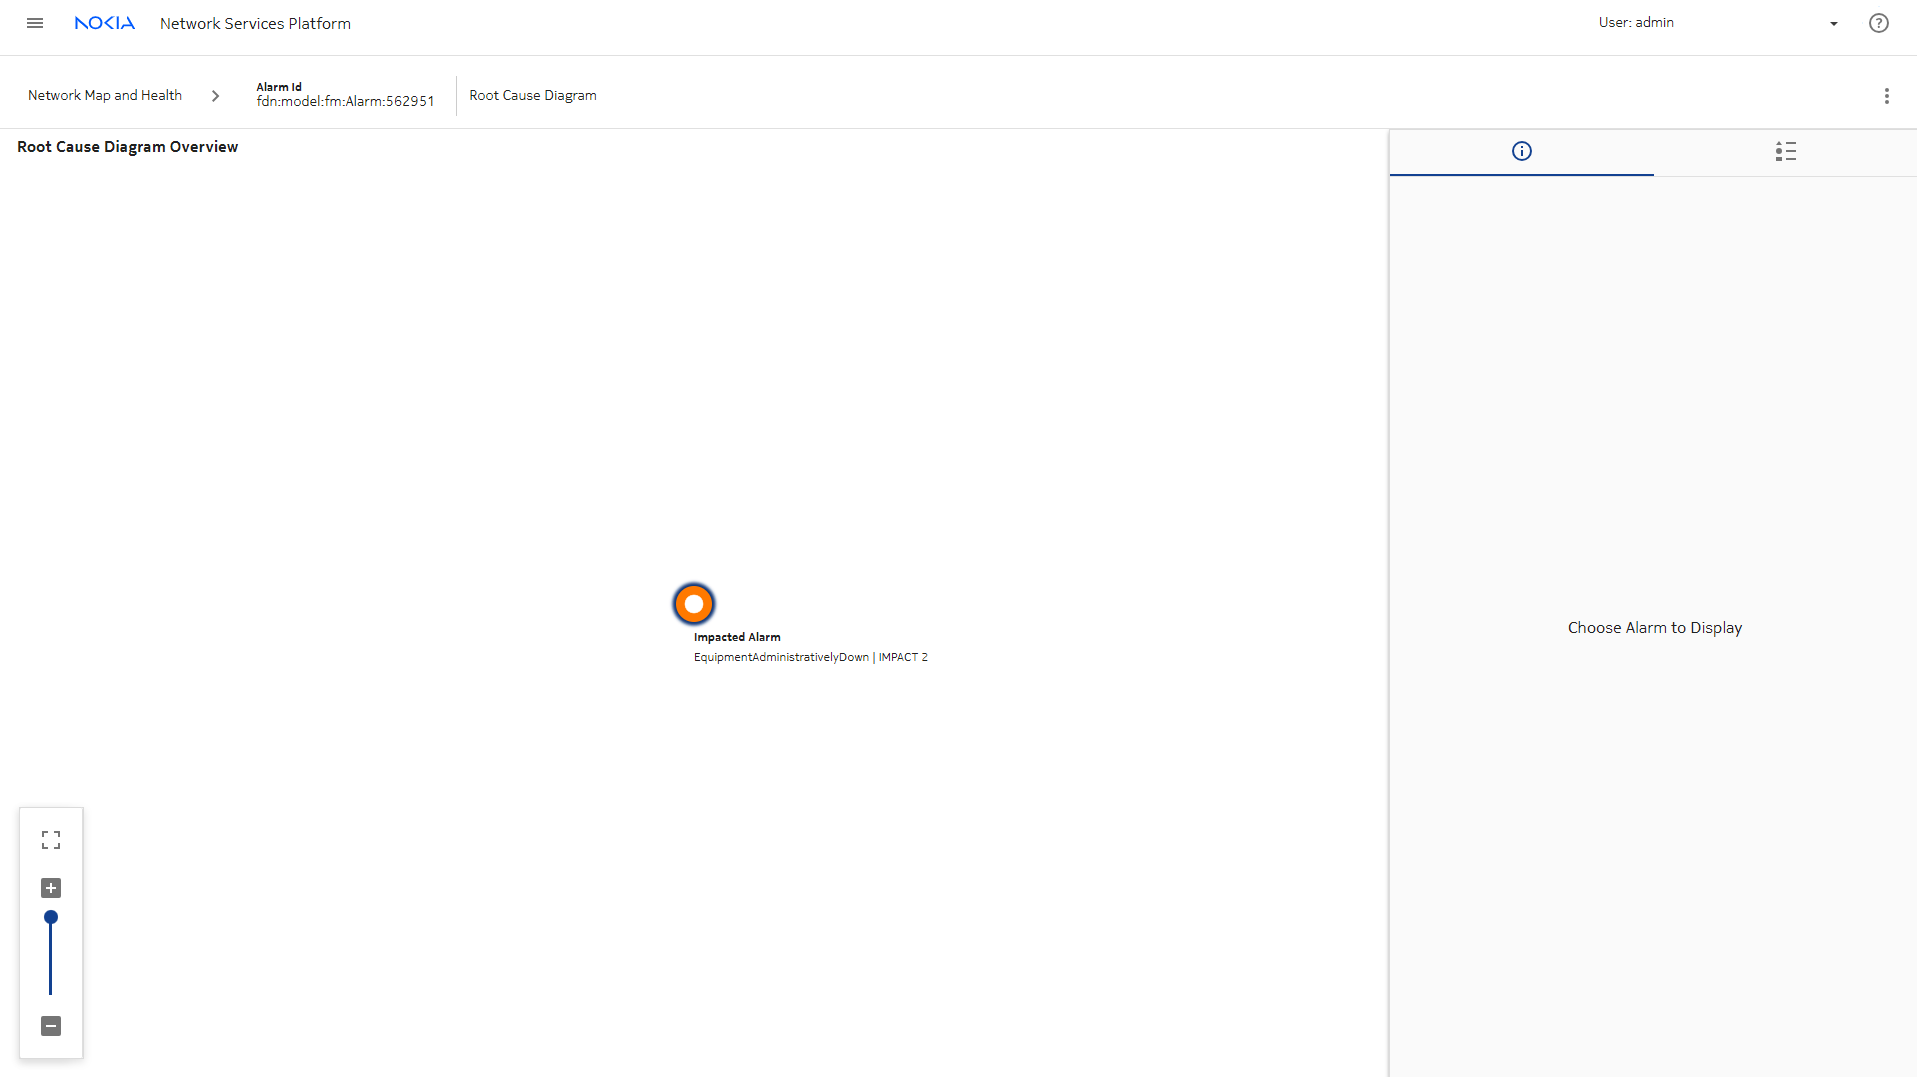
In Current Alarms, view the Root Causes for the alarm.

Current Alarms shows that there is no root cause for this particular alarm as it is a root cause alarm.


Another option is to switch to the Unhealthy NEs or Top Problems view in the Network Map and Health dashboard to see what other alarms are present on the NE, and to see what other issues the network is experiencing.

View the News Feed

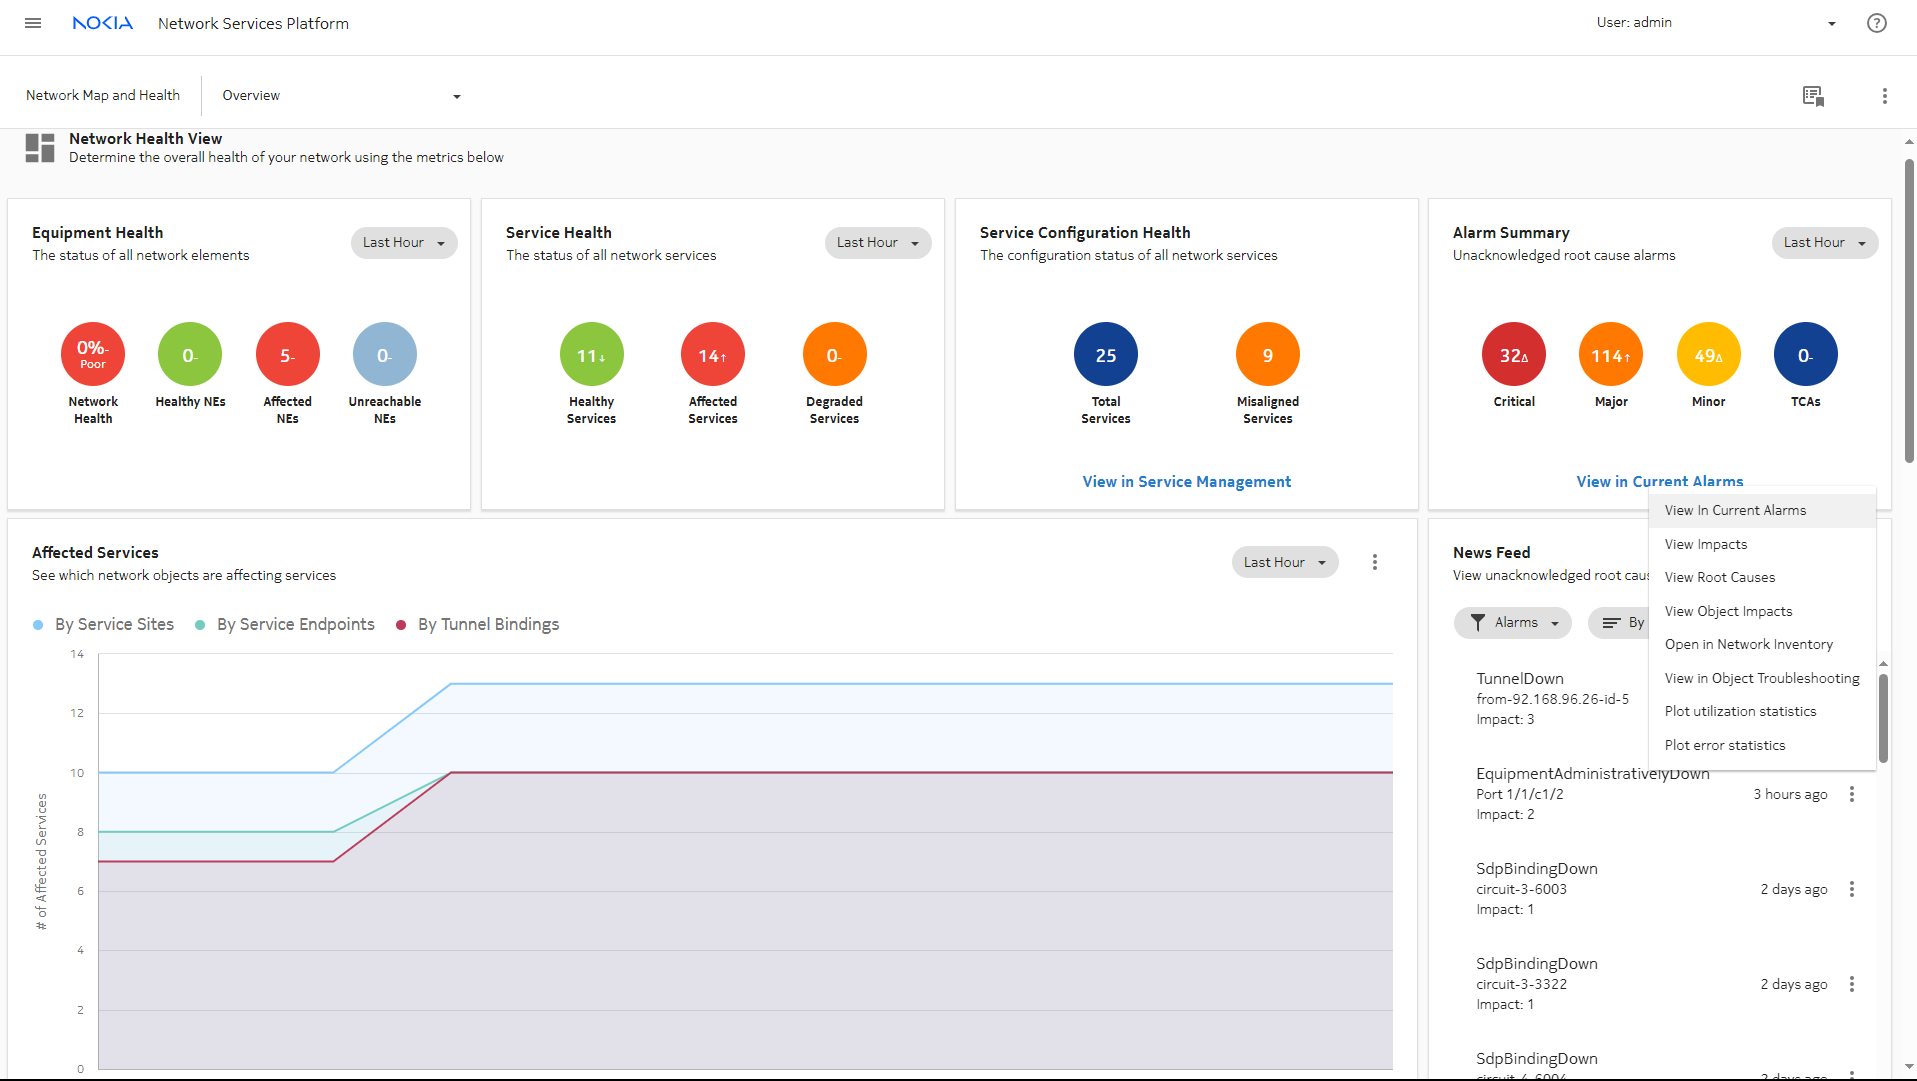
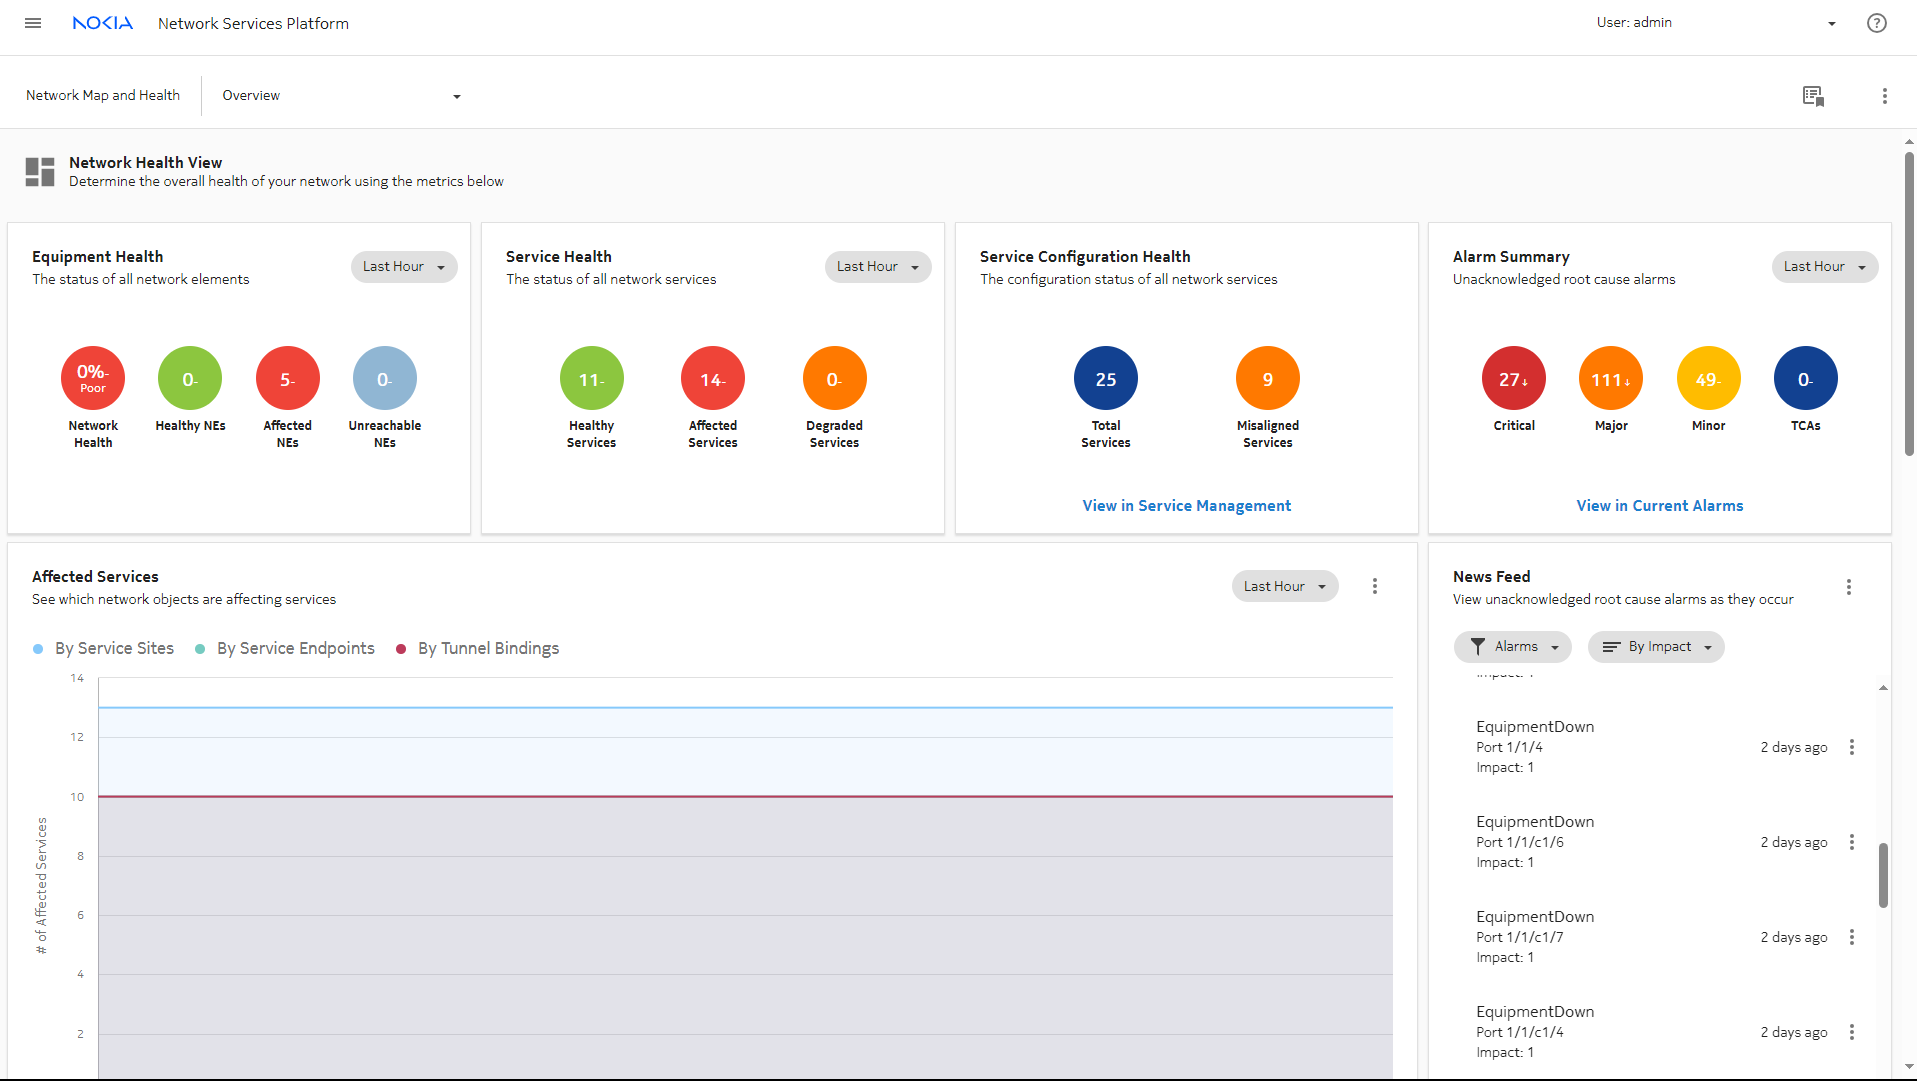
Another starting point could be the News Feed in the Network Map and Health dashboard. The News Feed provides a live feed of unacknowledged root cause alarms as they occur in real time. Alarm severity and number of impacts are displayed, and cross launch is available depending on the alarm.


The News Feed shows a Equipment Down alarm on a port. Select the alarm and choose View in Current Alarms from the More menu.

Current Alarms opens, showing the current alarm.

Investigate from the Ports data page

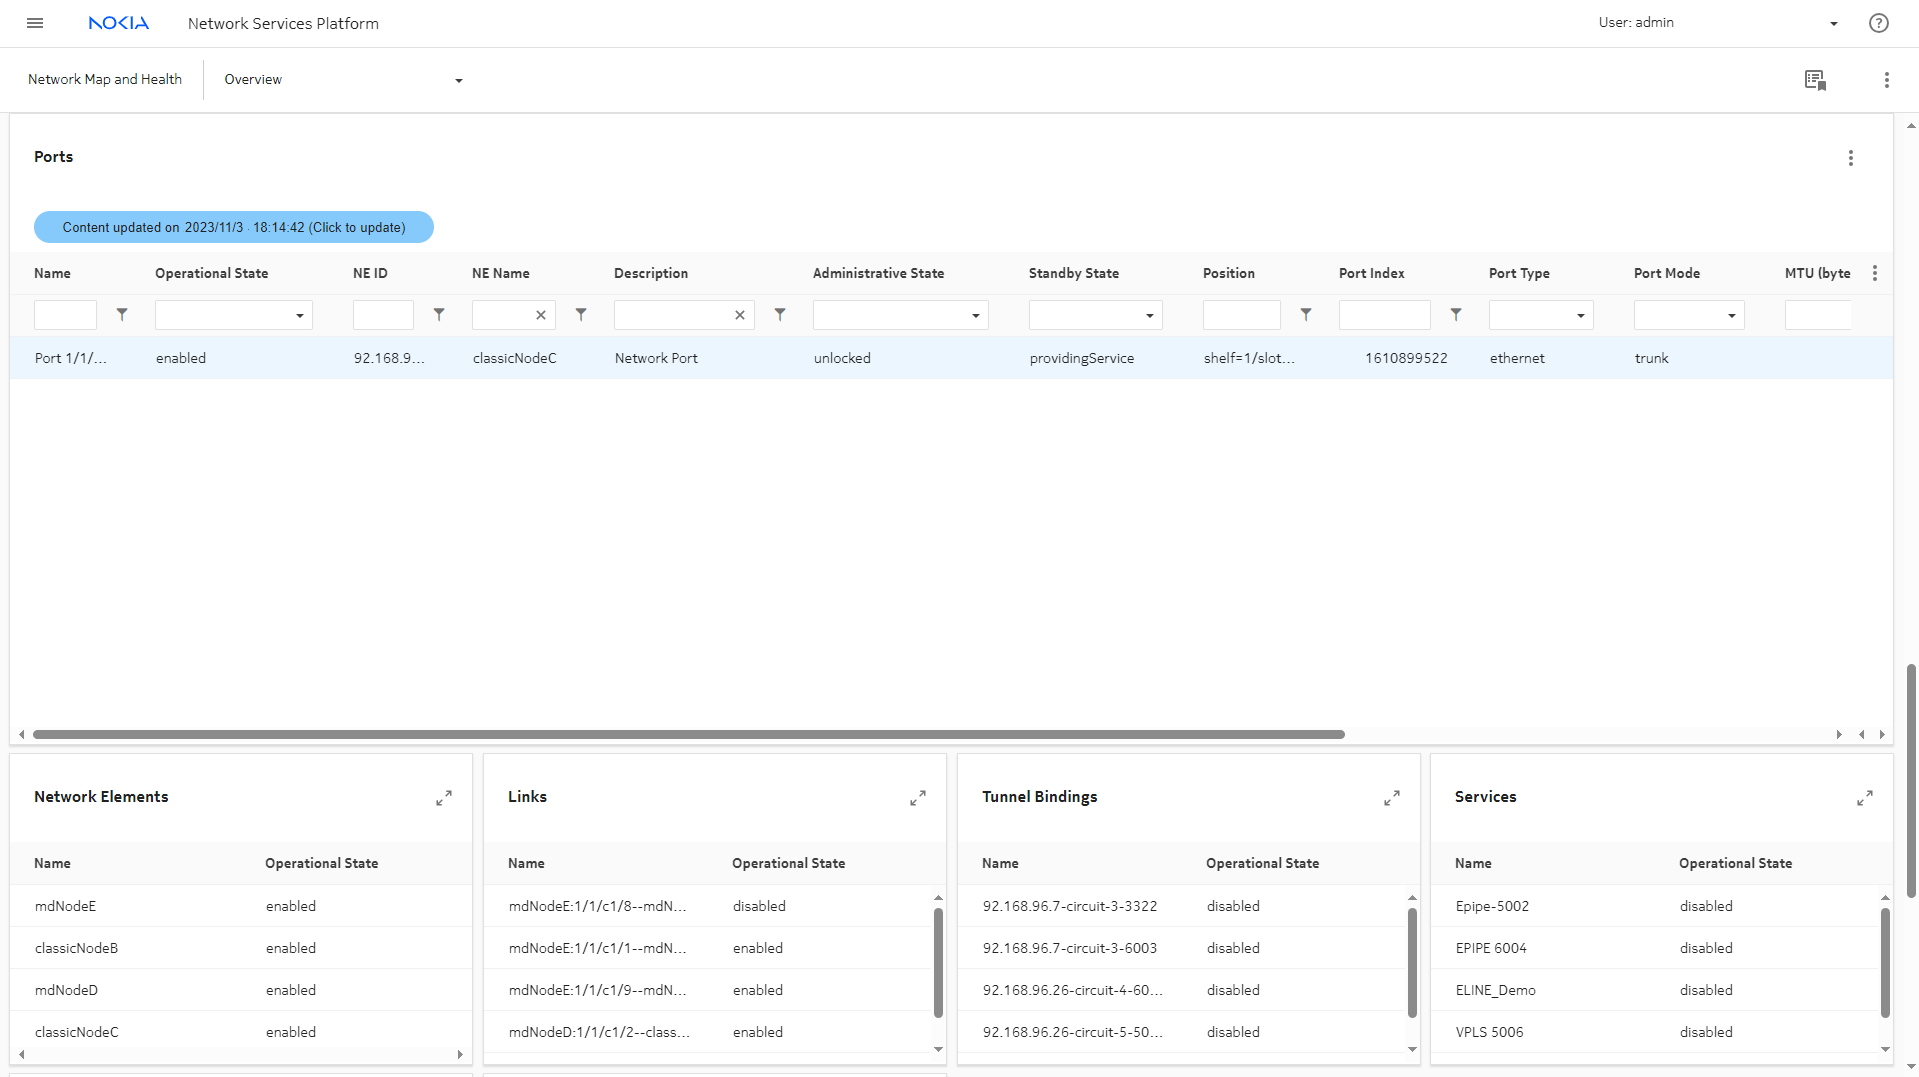
Viewing the port in the Ports list on the Network Map and Health dashboard will show us some configuration and state details.
 

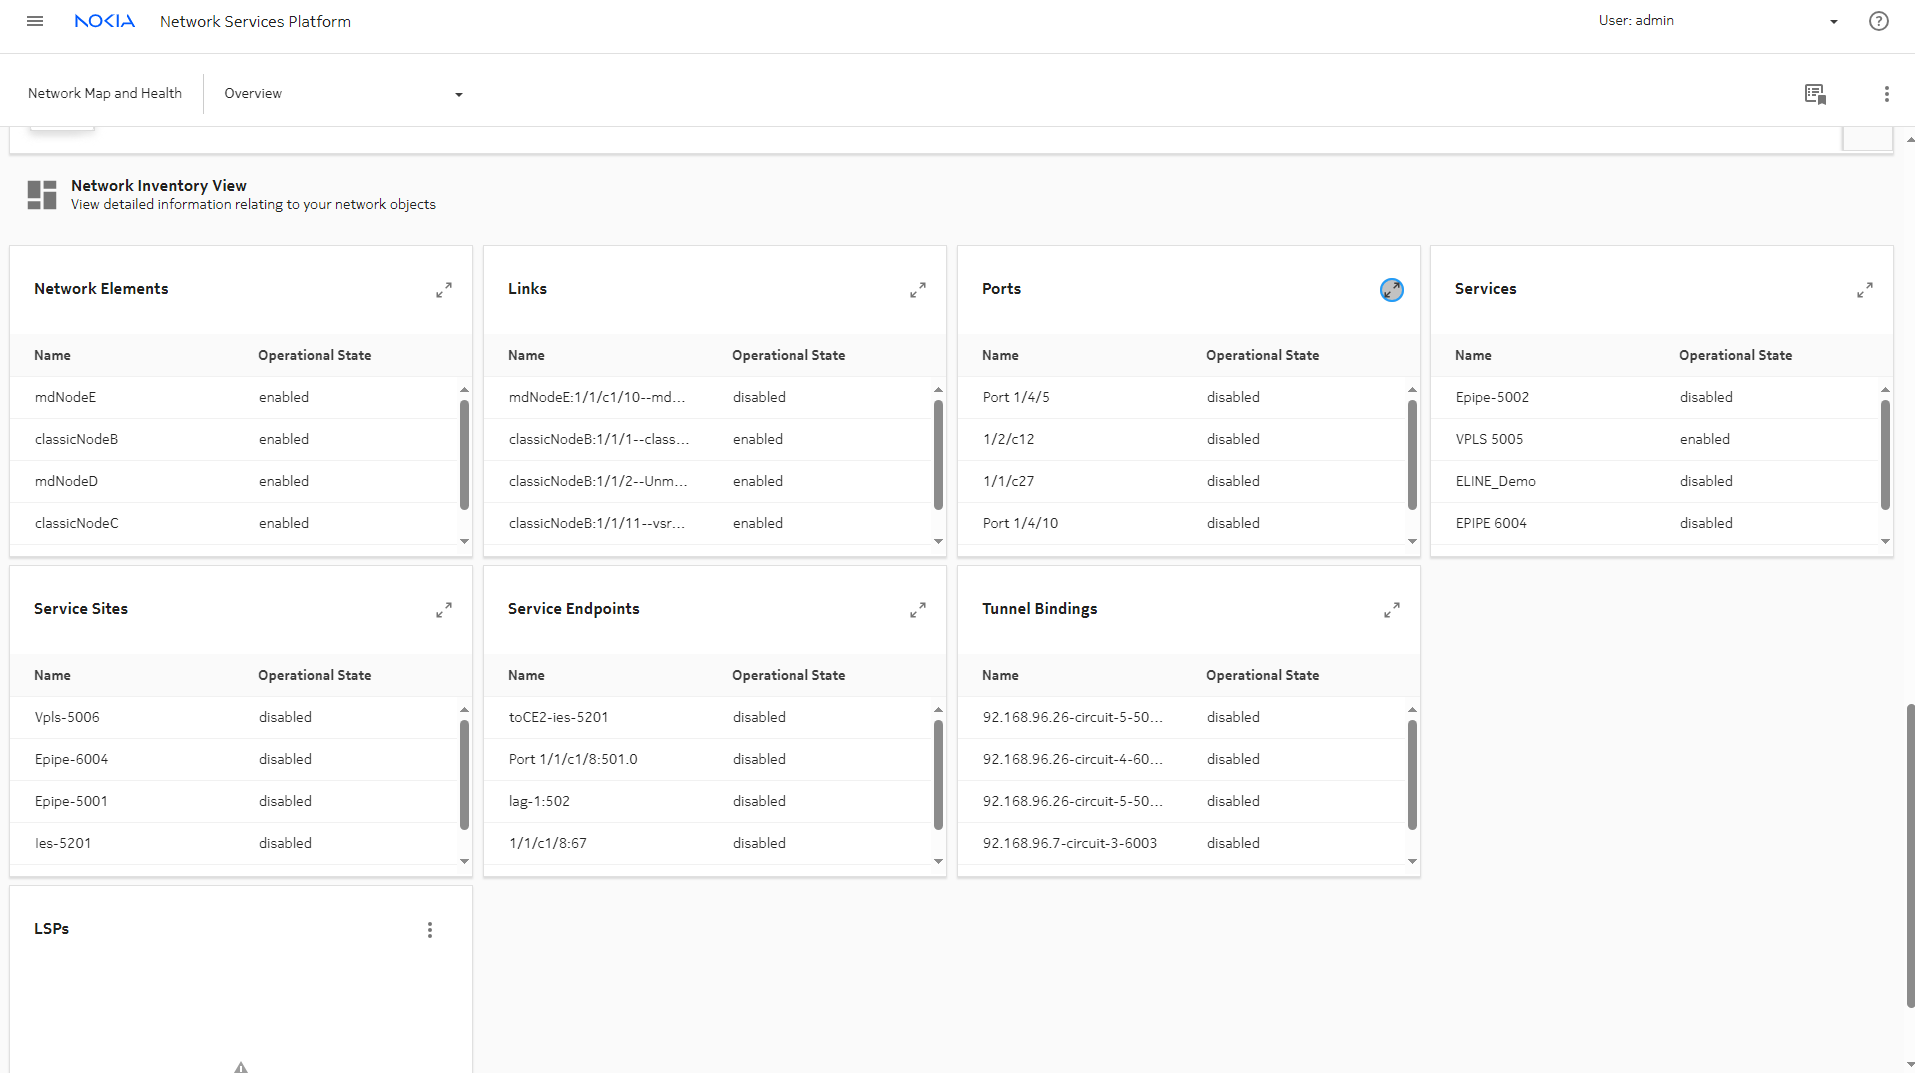
From Overview in the Network Map and Health dashboard, scroll down and expand the Ports dashlet and filter on the port being investigated.


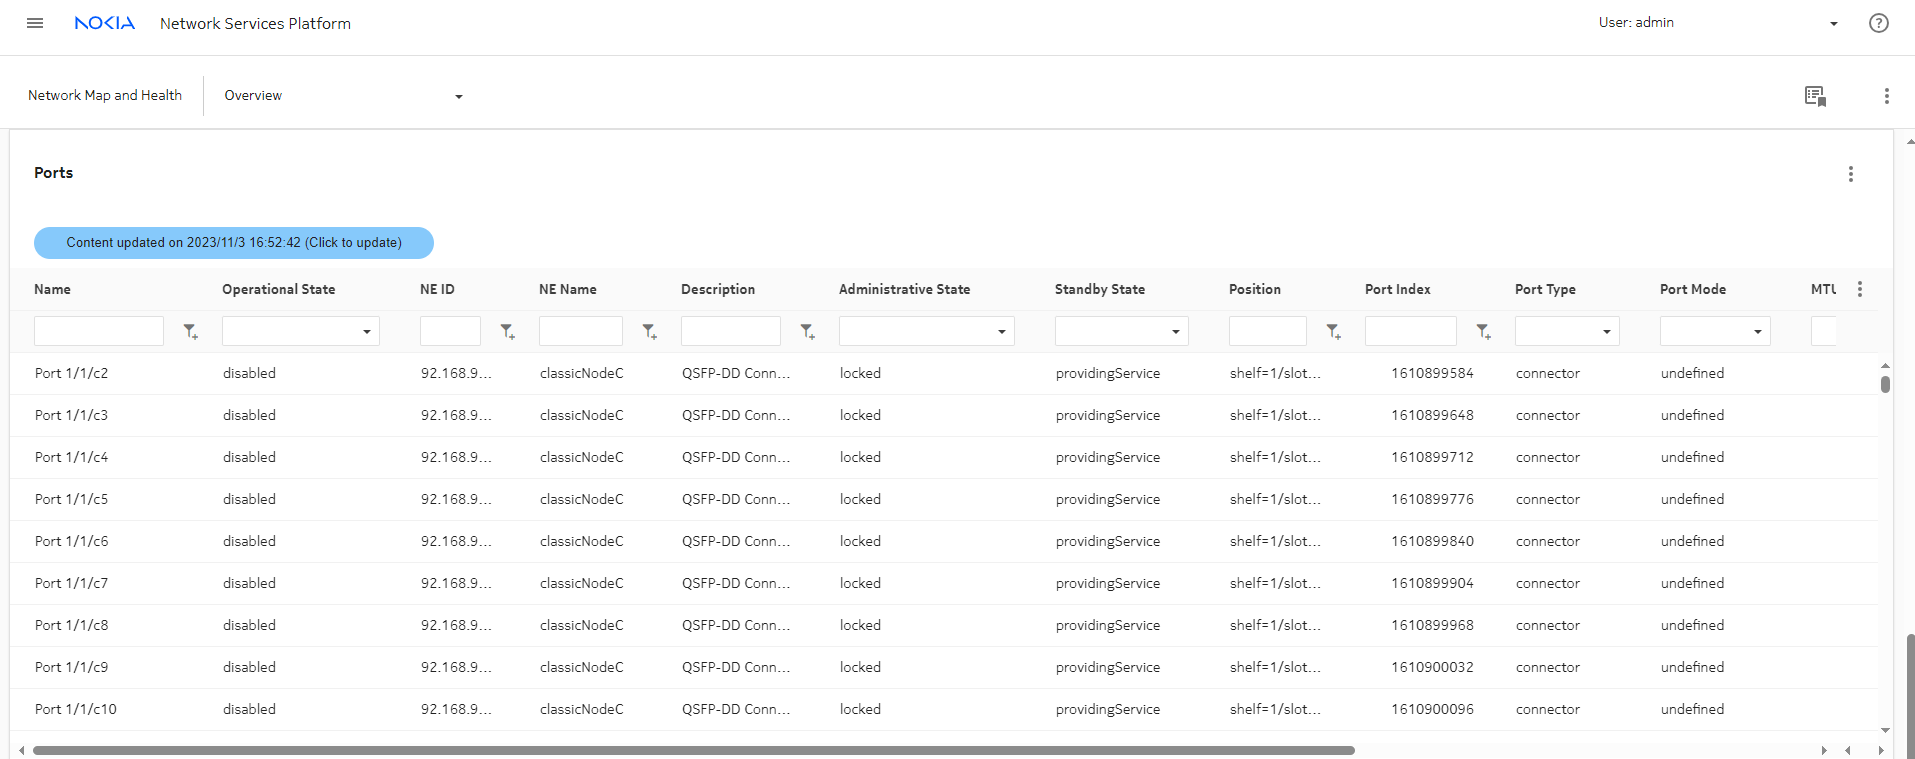
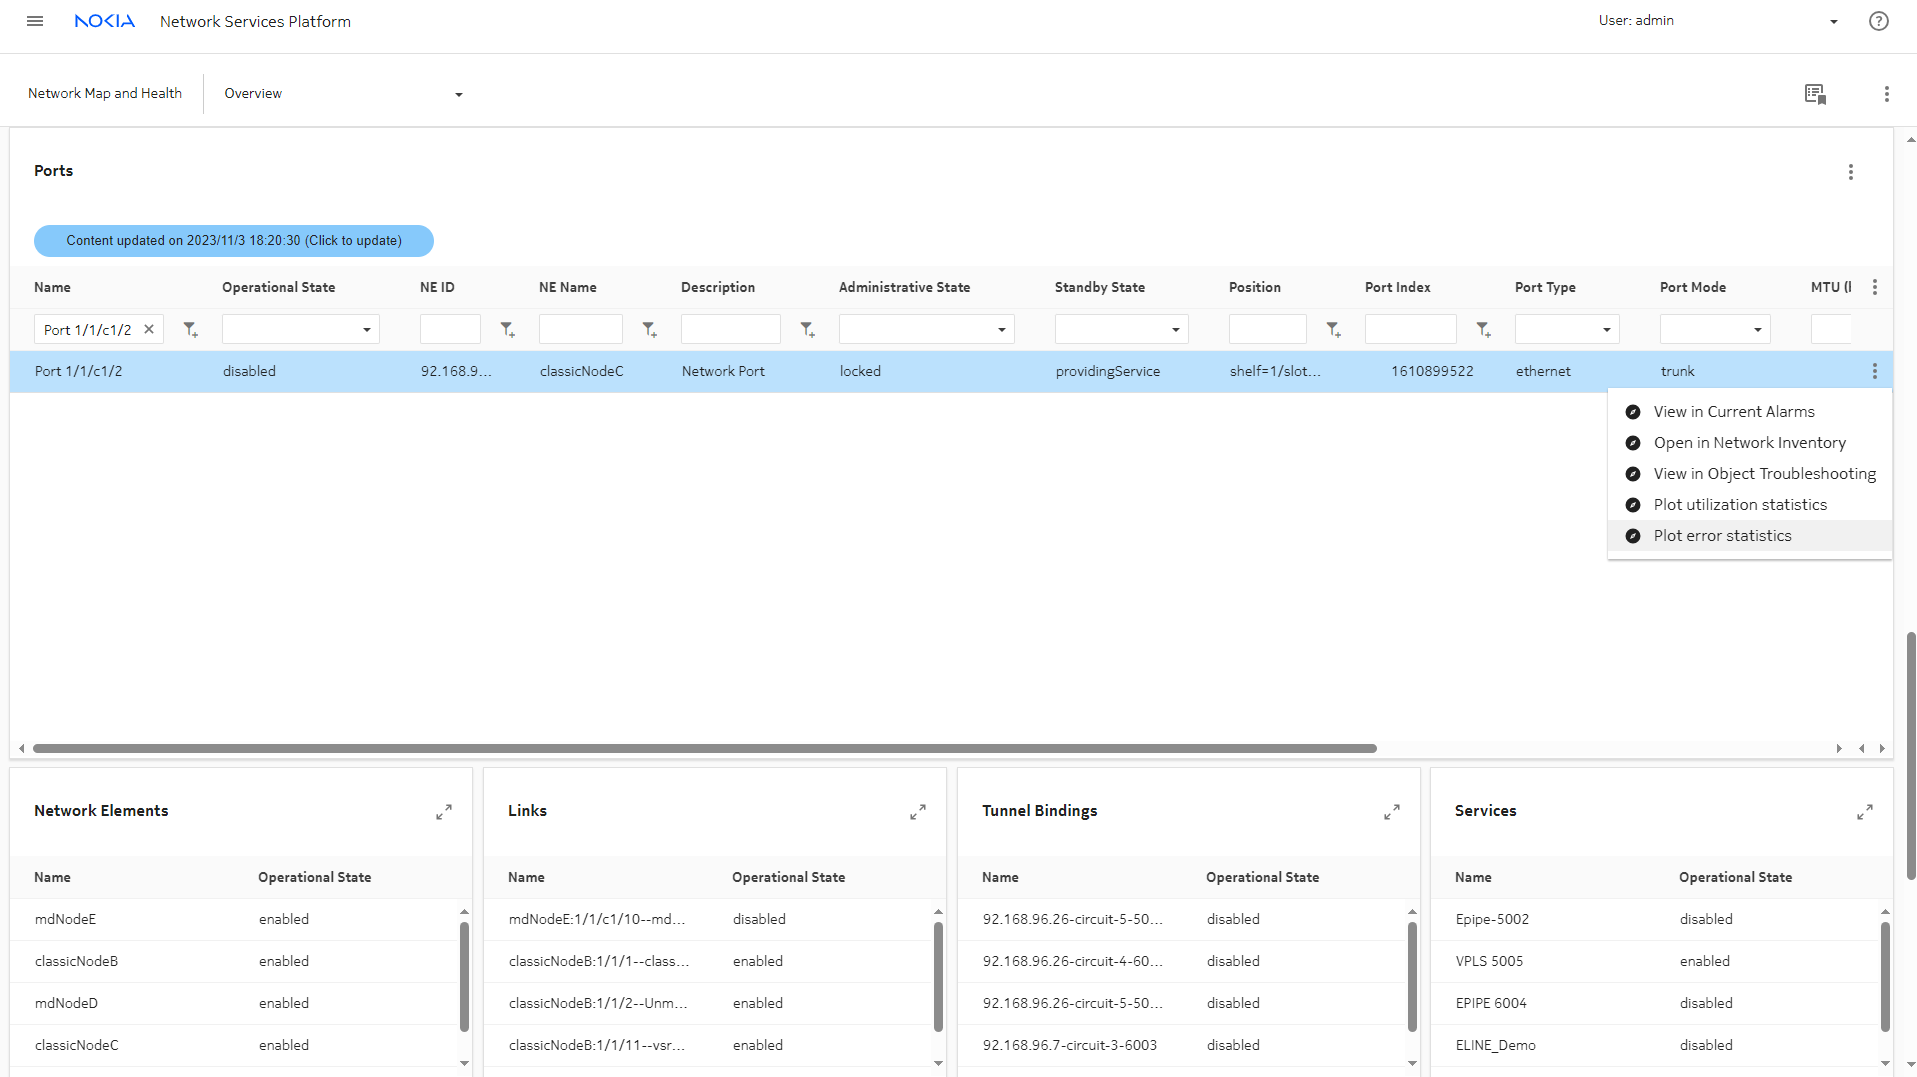
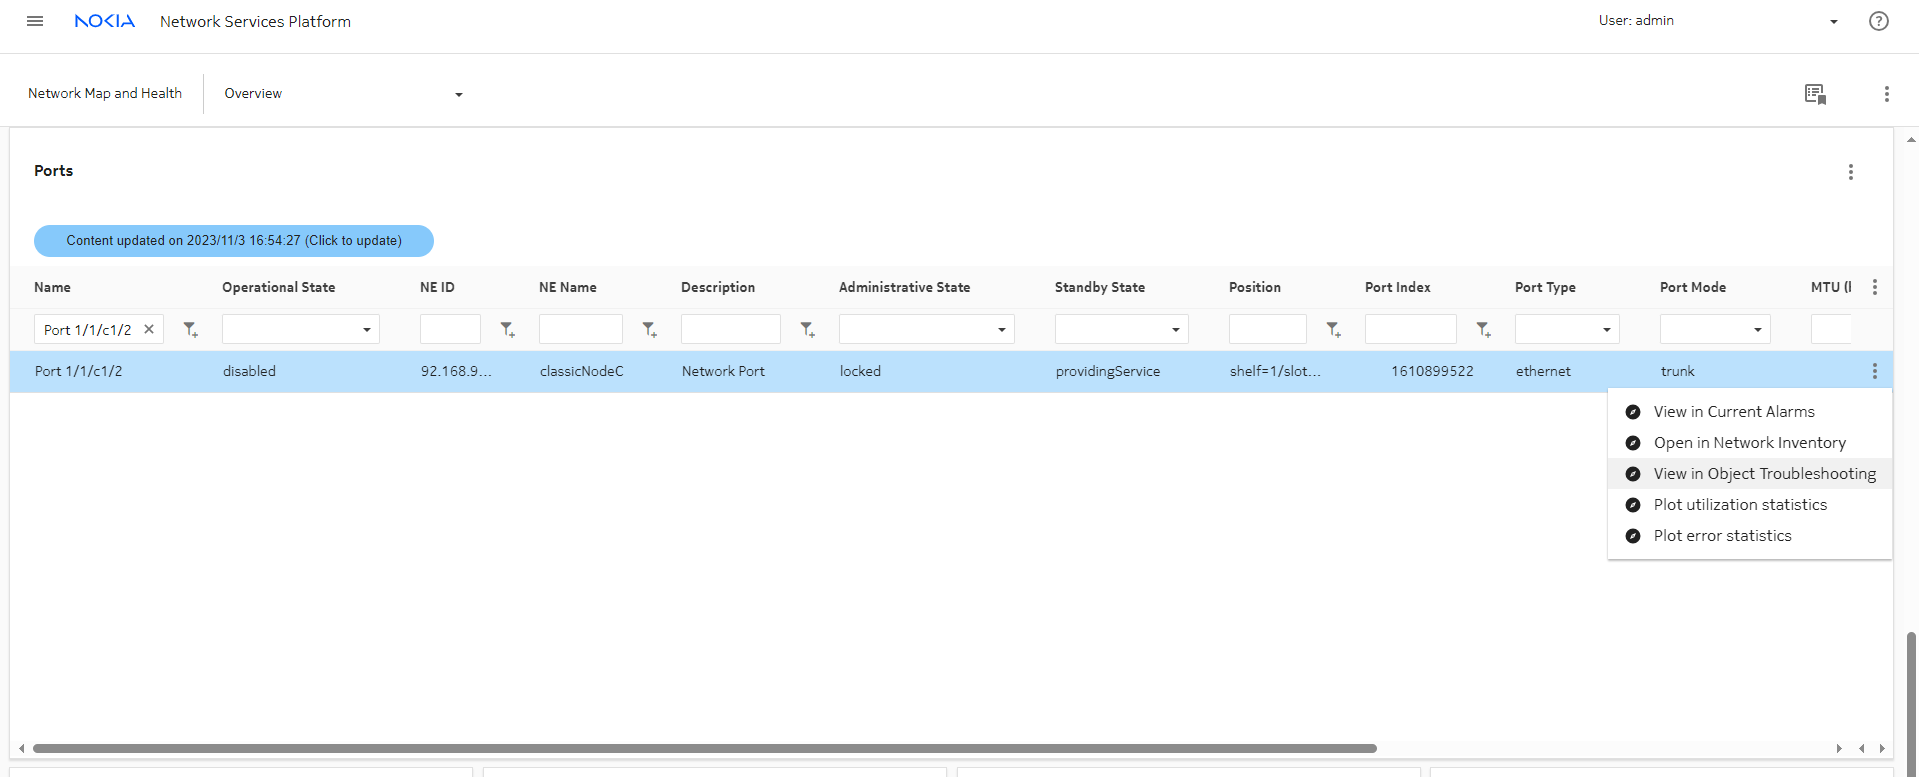
From the Ports list, filter on the port name in the Name column, and the NE in the NE Name column. The dashboard shows that the Operational State of the port is disabled and the Administrative State is locked.


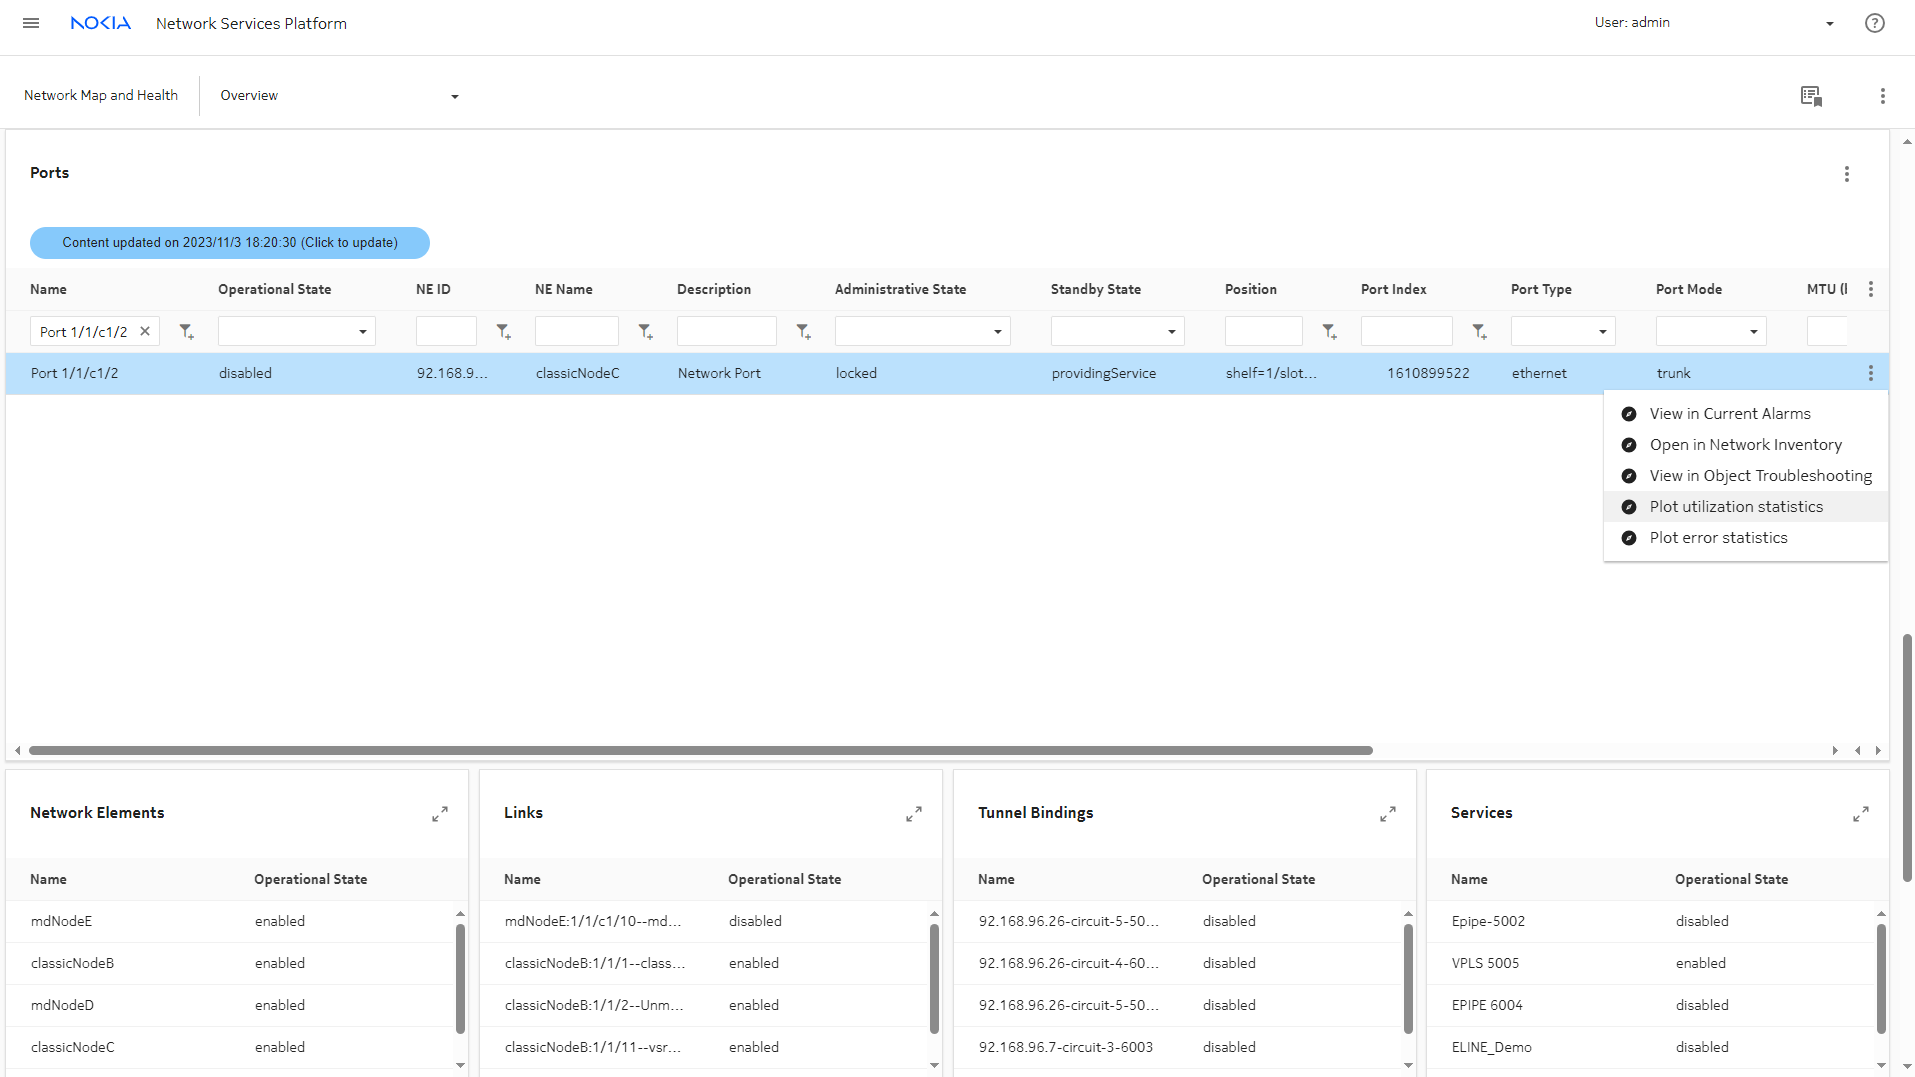
We can continue to investigate the issue by plotting statistics. Select the port and choose png2.png (Table row actions), Plot utilization statistics.


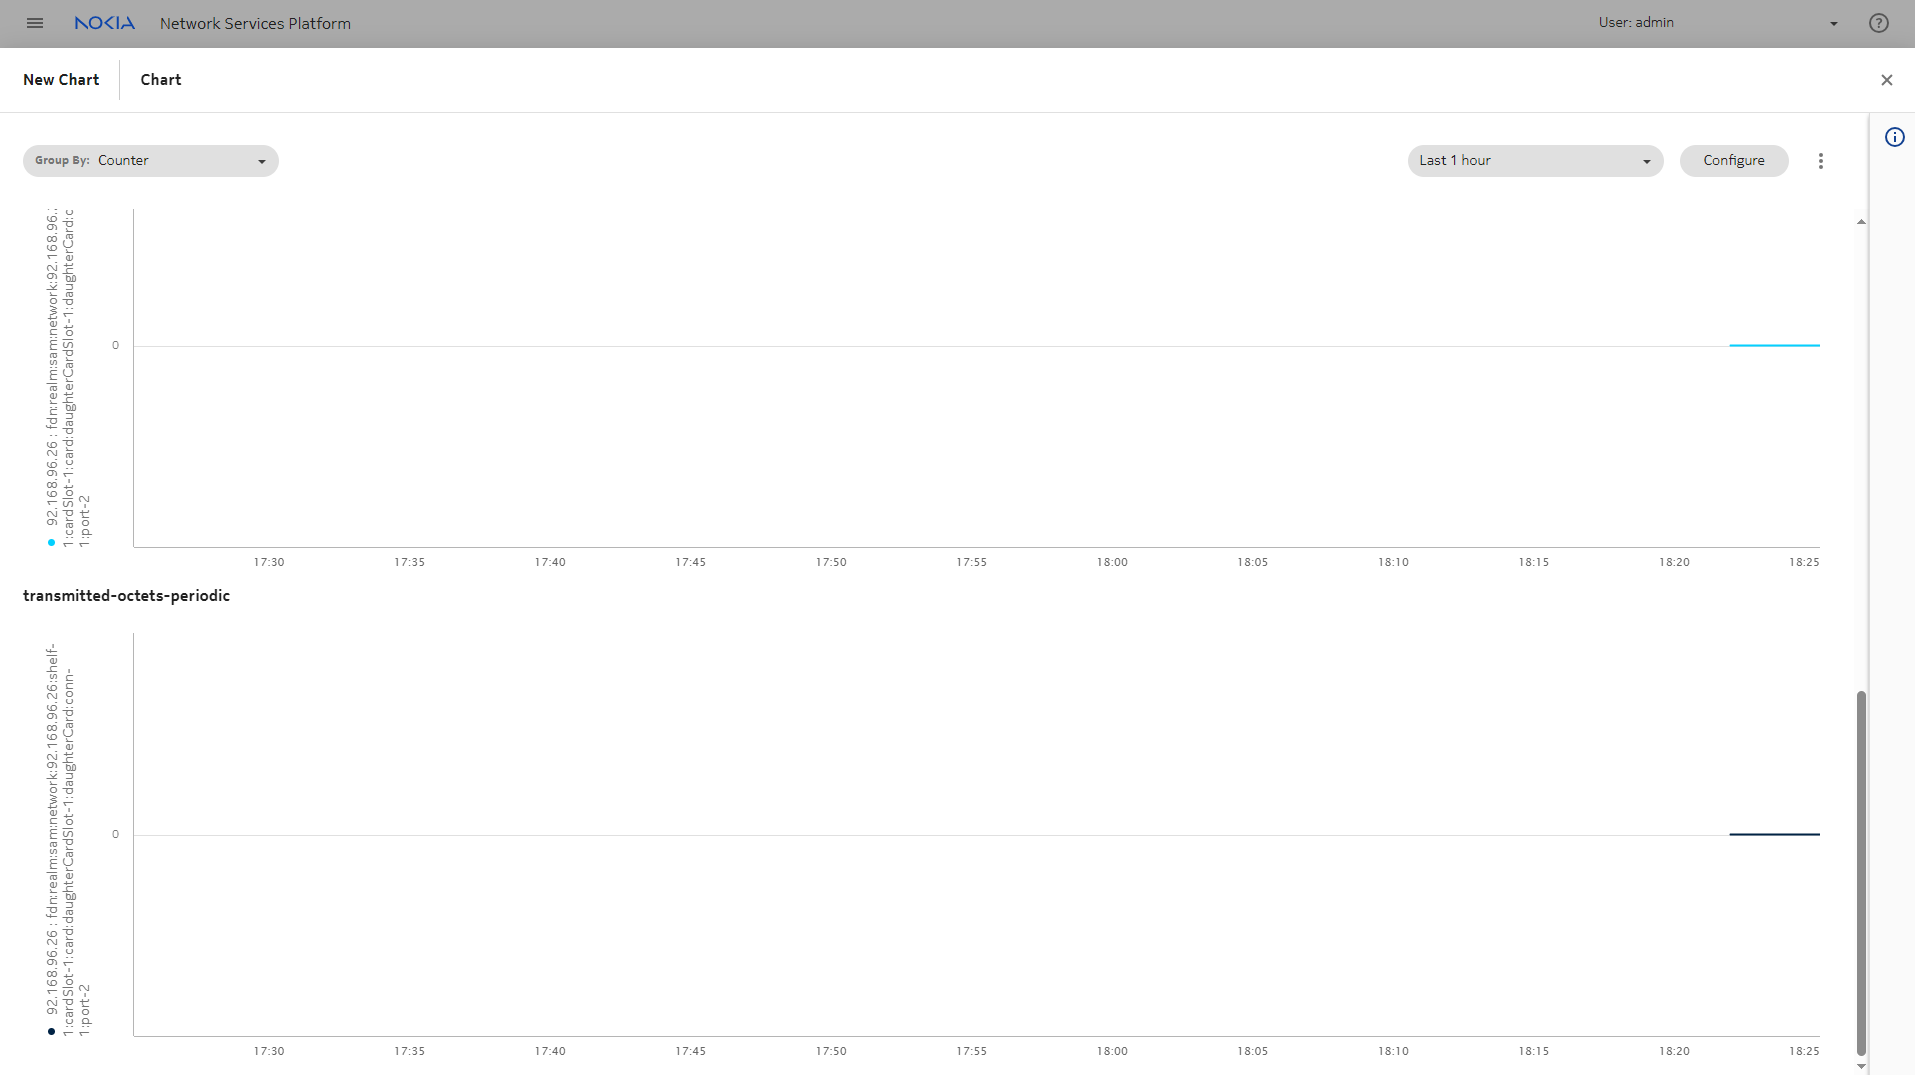
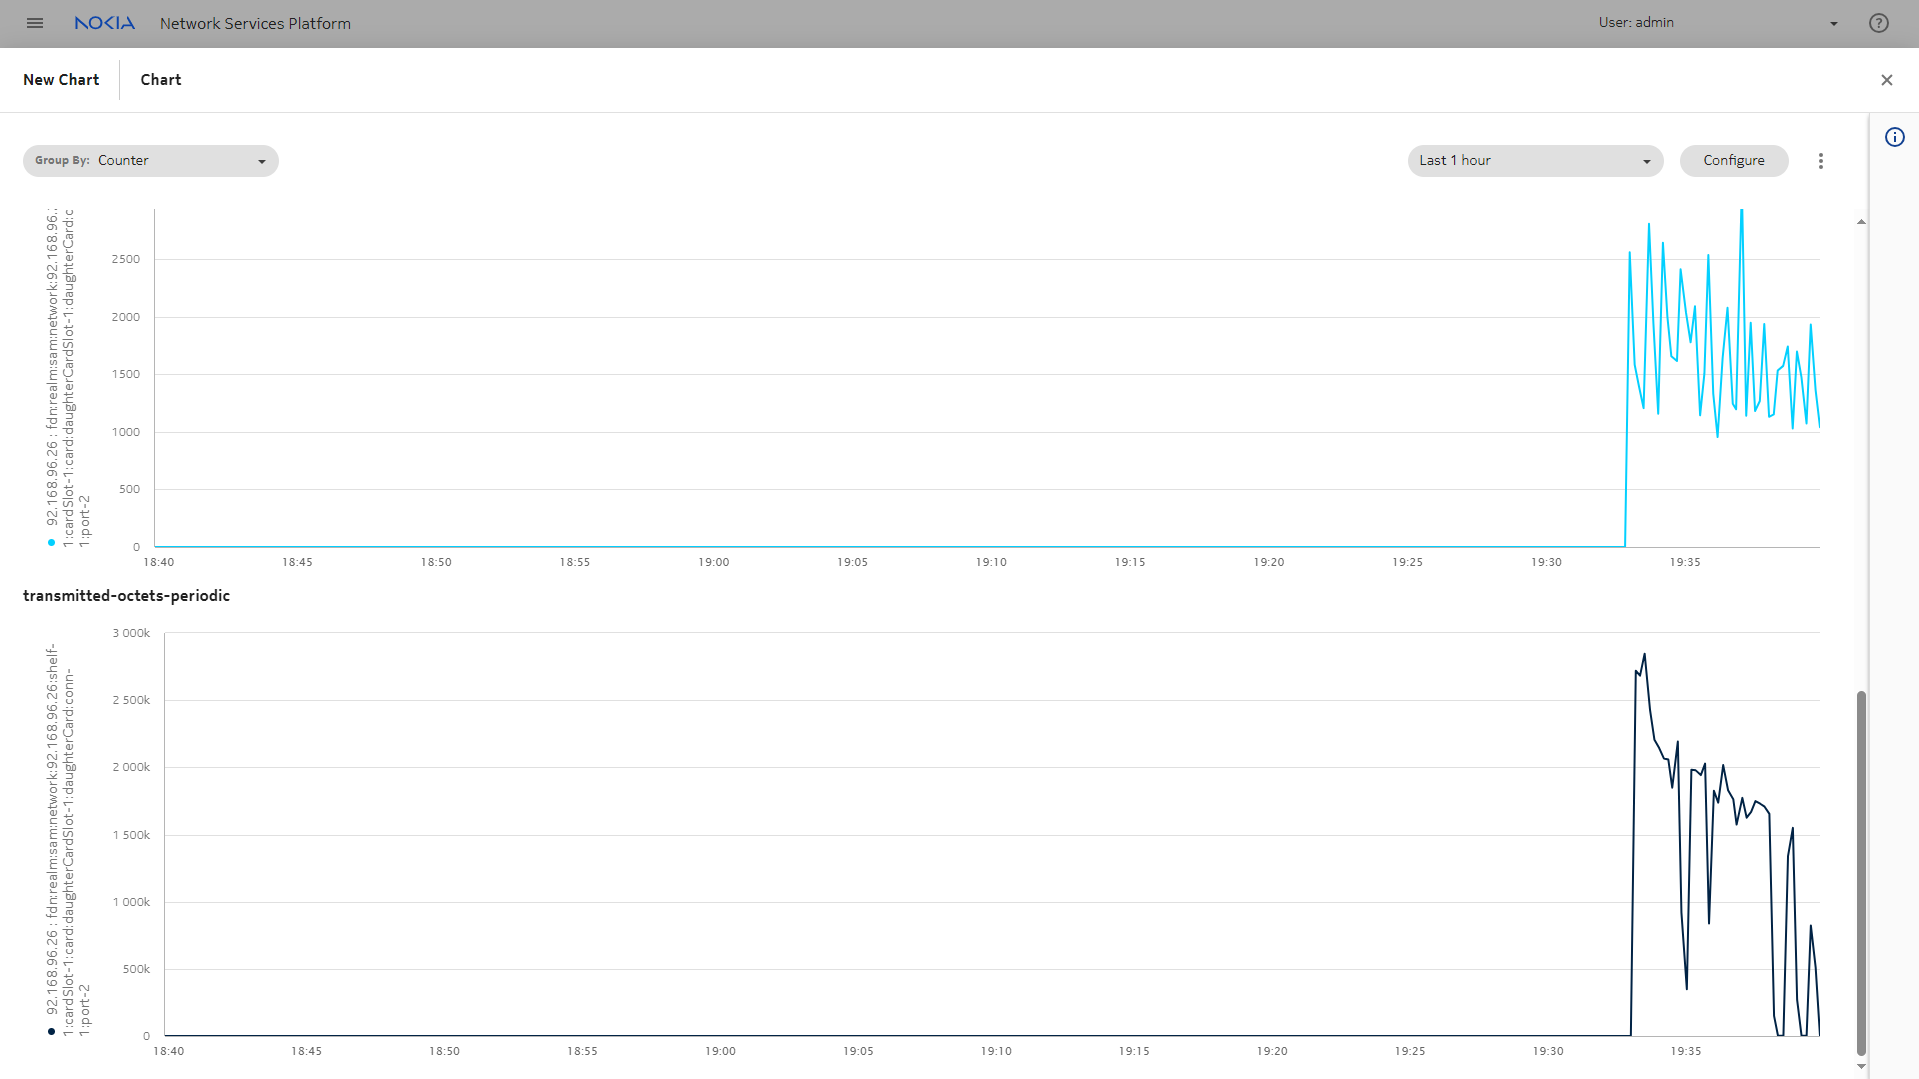
Data Collection and Analysis Visualizations opens, showing several charts of utilization statistics.

Here we can see that there is no traffic. This provides additional information about what has happened.


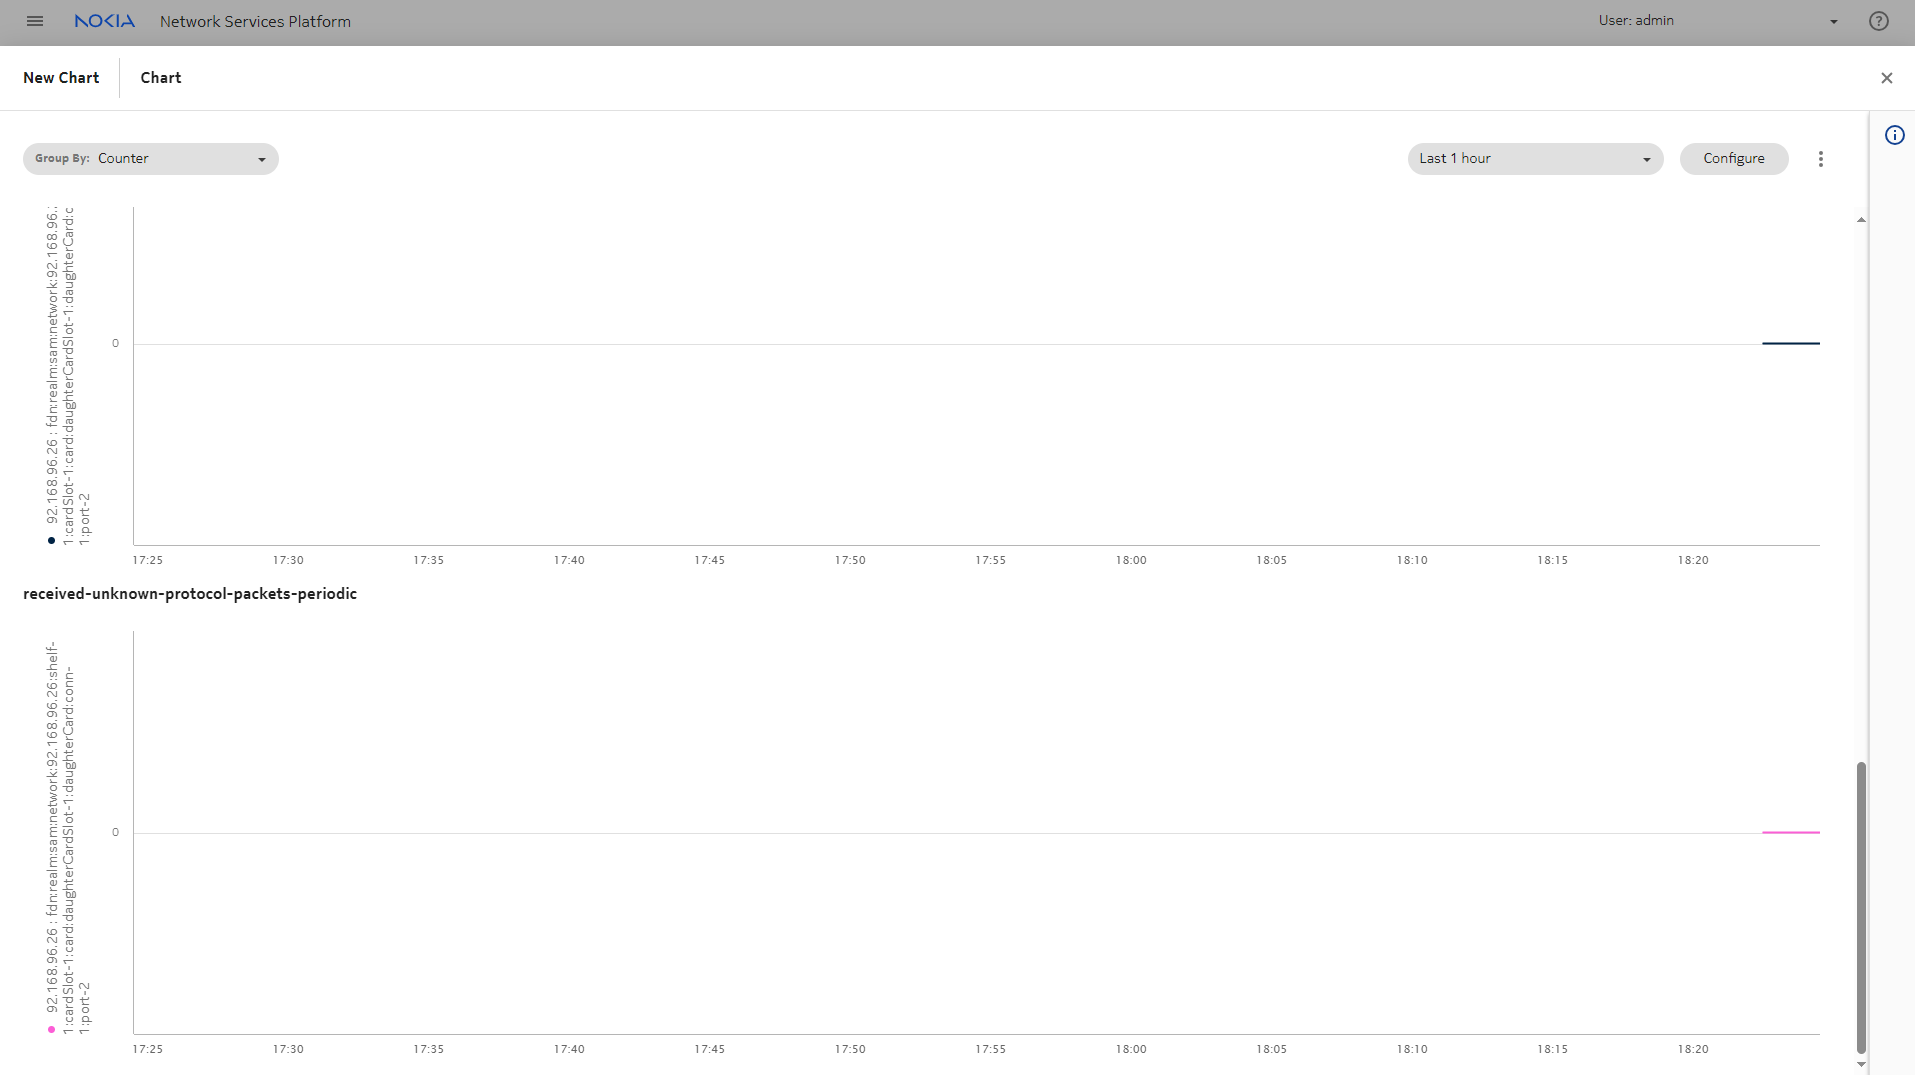
We can also plot error statistics for the port. Return to the port in the Ports list and choose png2.png (Table row actions), Plot error statistics.

Another Data Collection and Analysis Visualizations tab opens, charting multiple error statistics counters, for example, received bad or discarded packets. For this port, there are no errors being recorded.

Investigate using the Object Troubleshooting dashboard
 

You can cross-launch the Object Troubleshooting dashboard in context from the Ports data page in the Network Map and Health dashboard.


From the Current Health Summary dashlet in the Object Troubleshooting dashboard, click Open in NE Inventory.

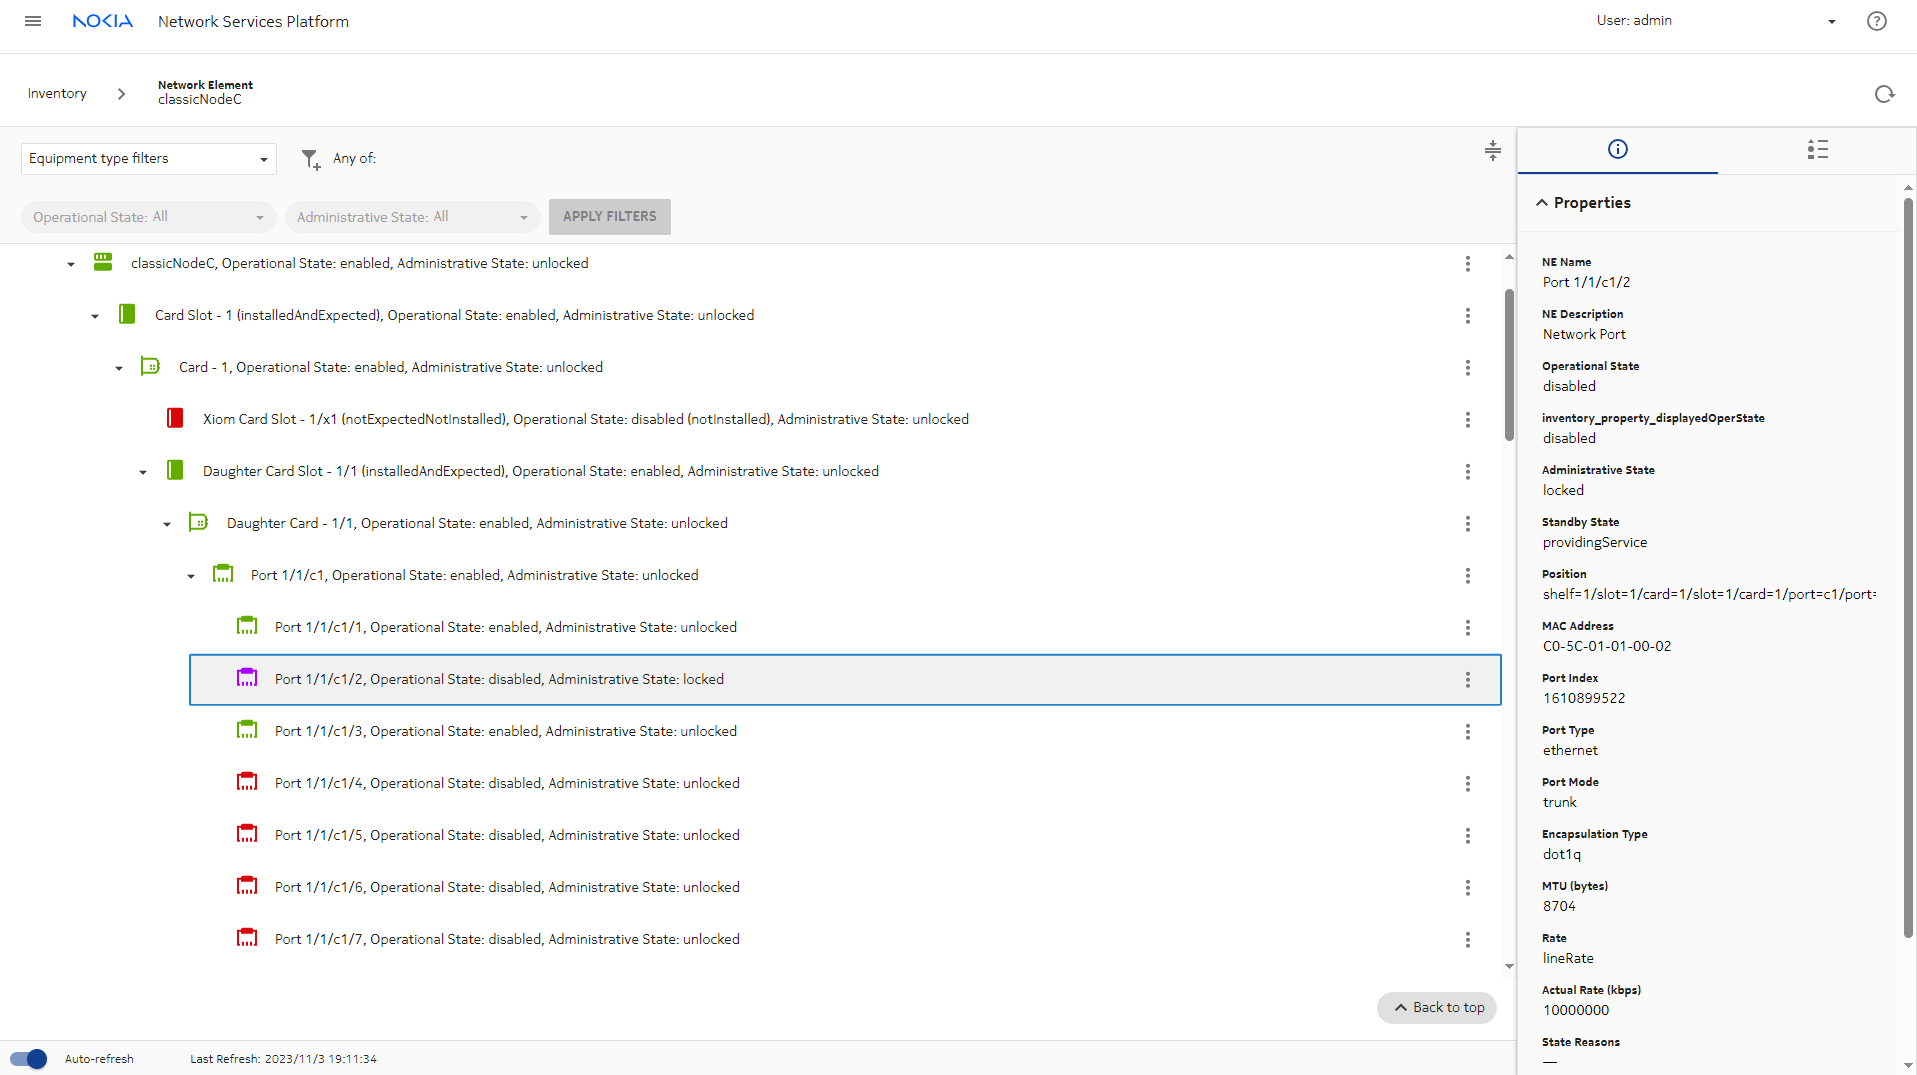
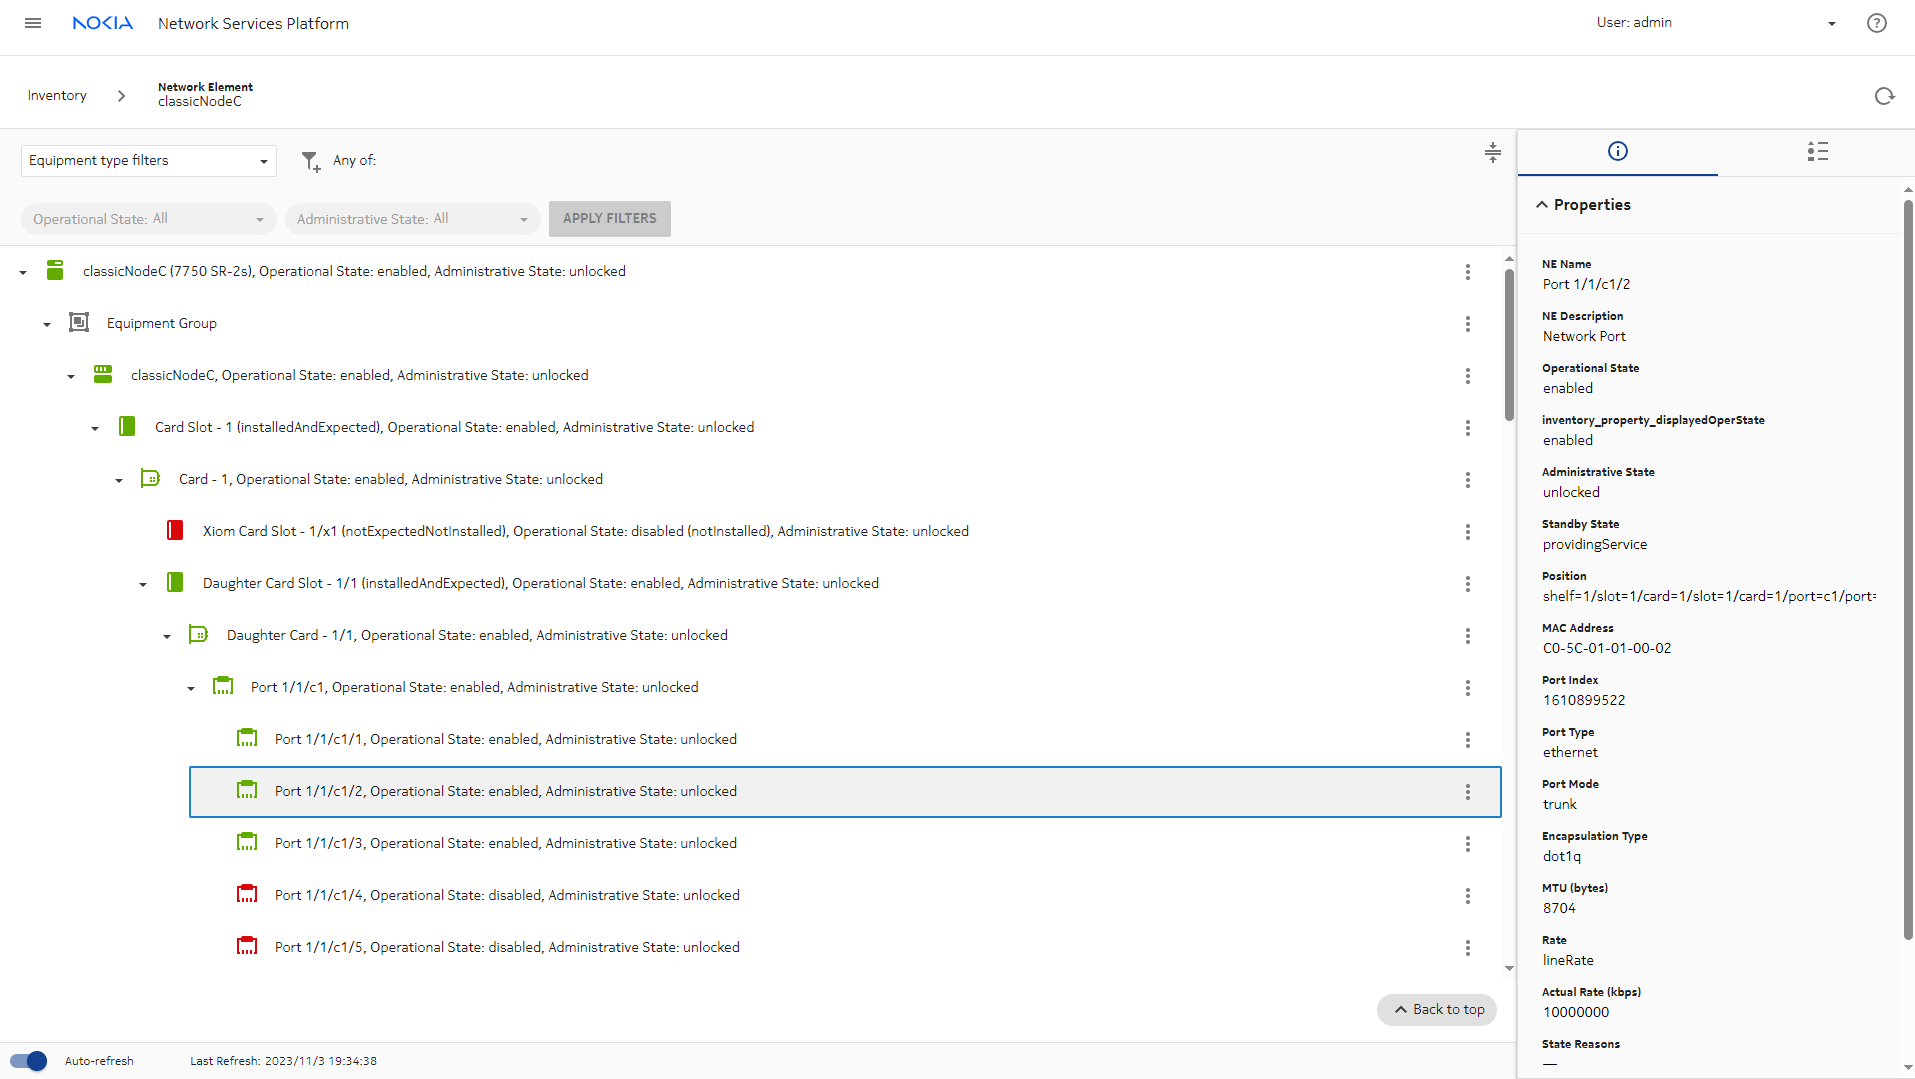
The port is selected, and additional information is shown in the Info panel regarding the operational state and administrative state of the port.

Check infrastructure configuration management details
 

If the NE was configured using Infrastructure Configuration Management, we can check for a misalignment in the Device Management, Configuration Deployments view.

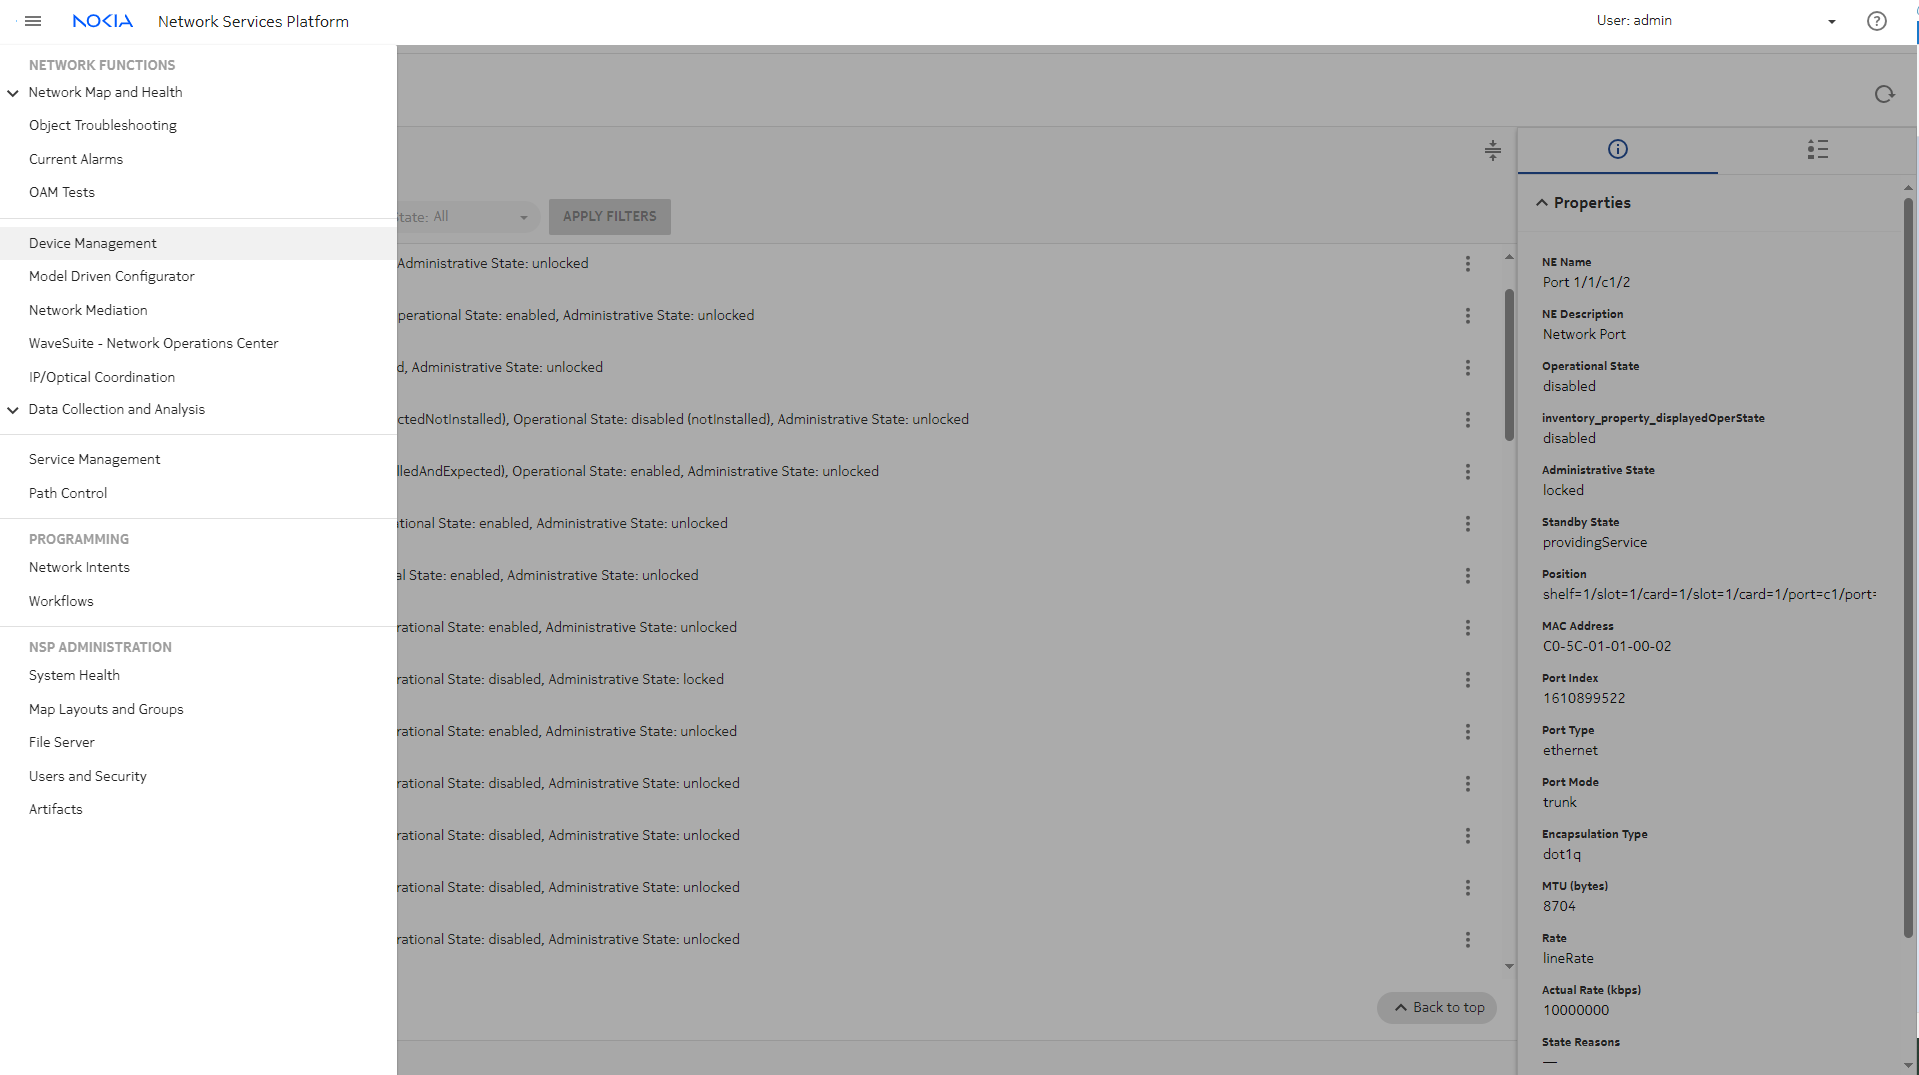
Navigate to Device Management.


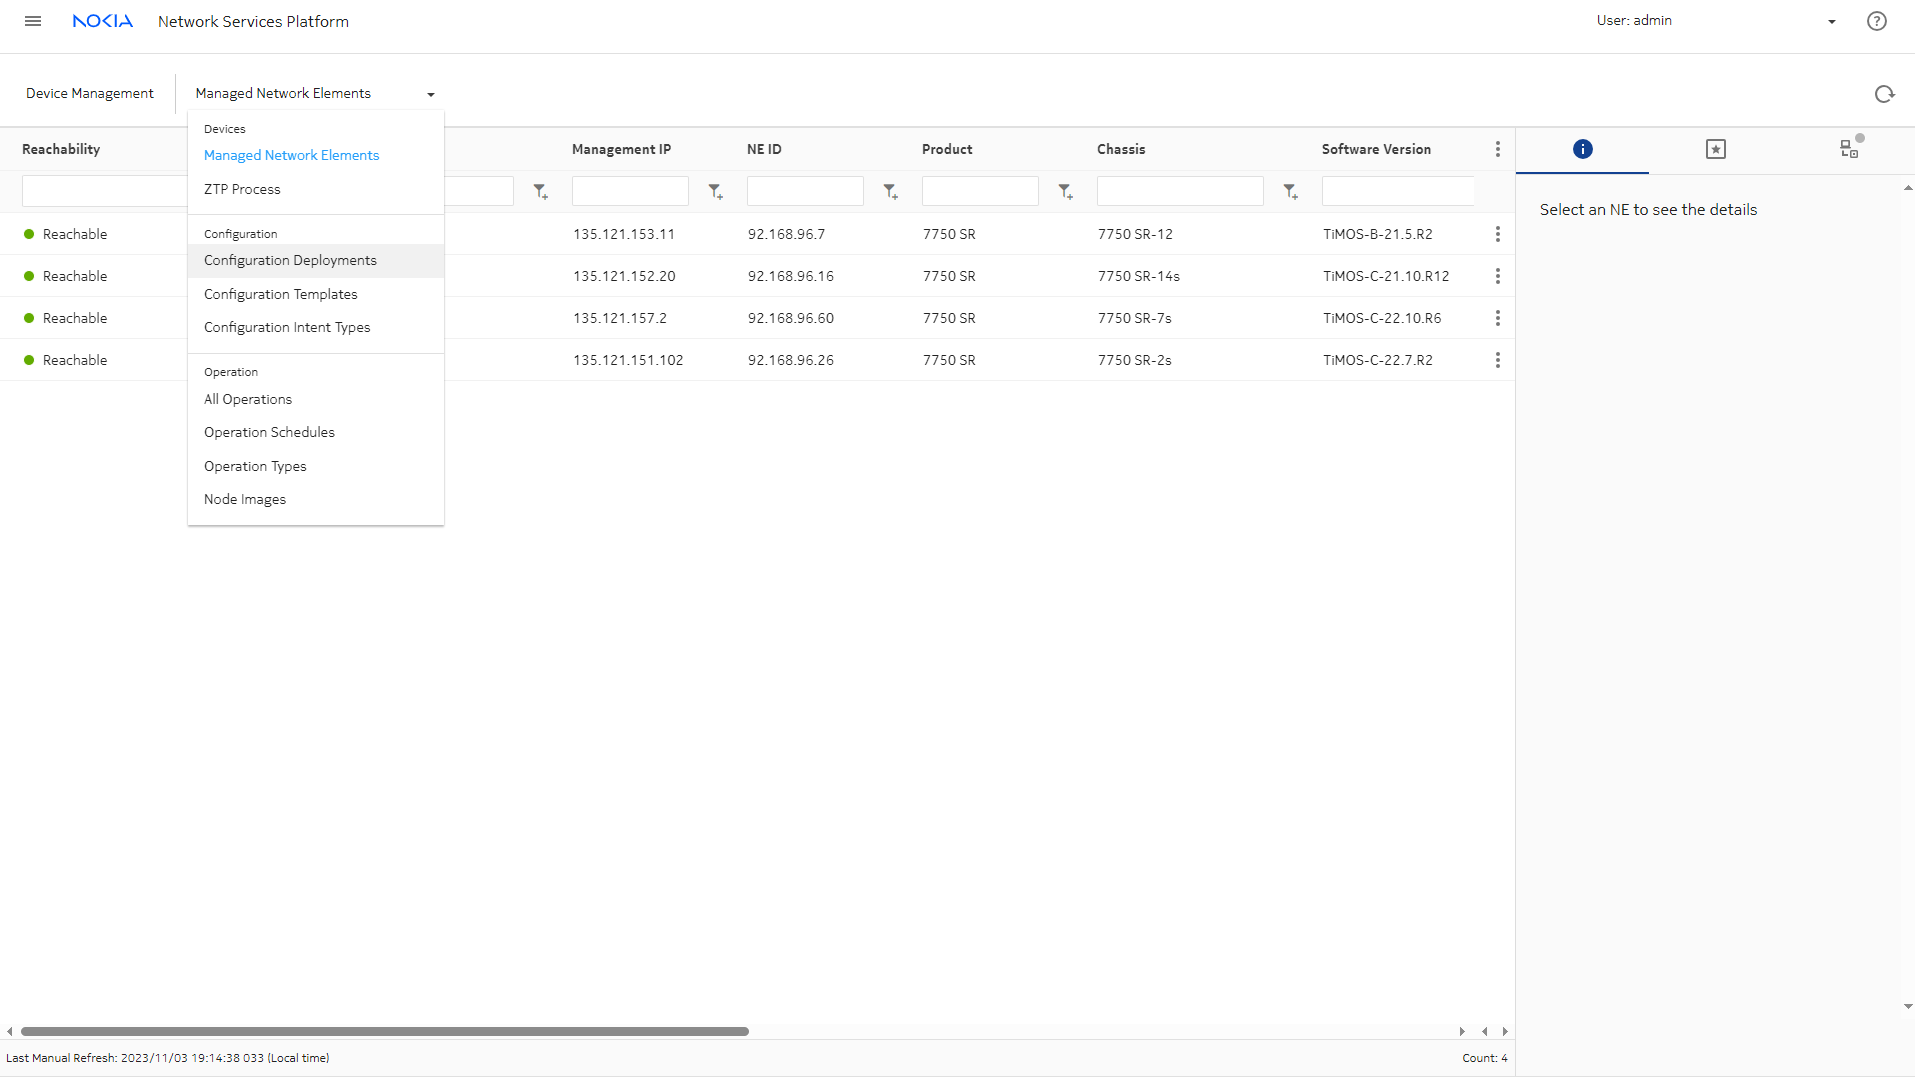
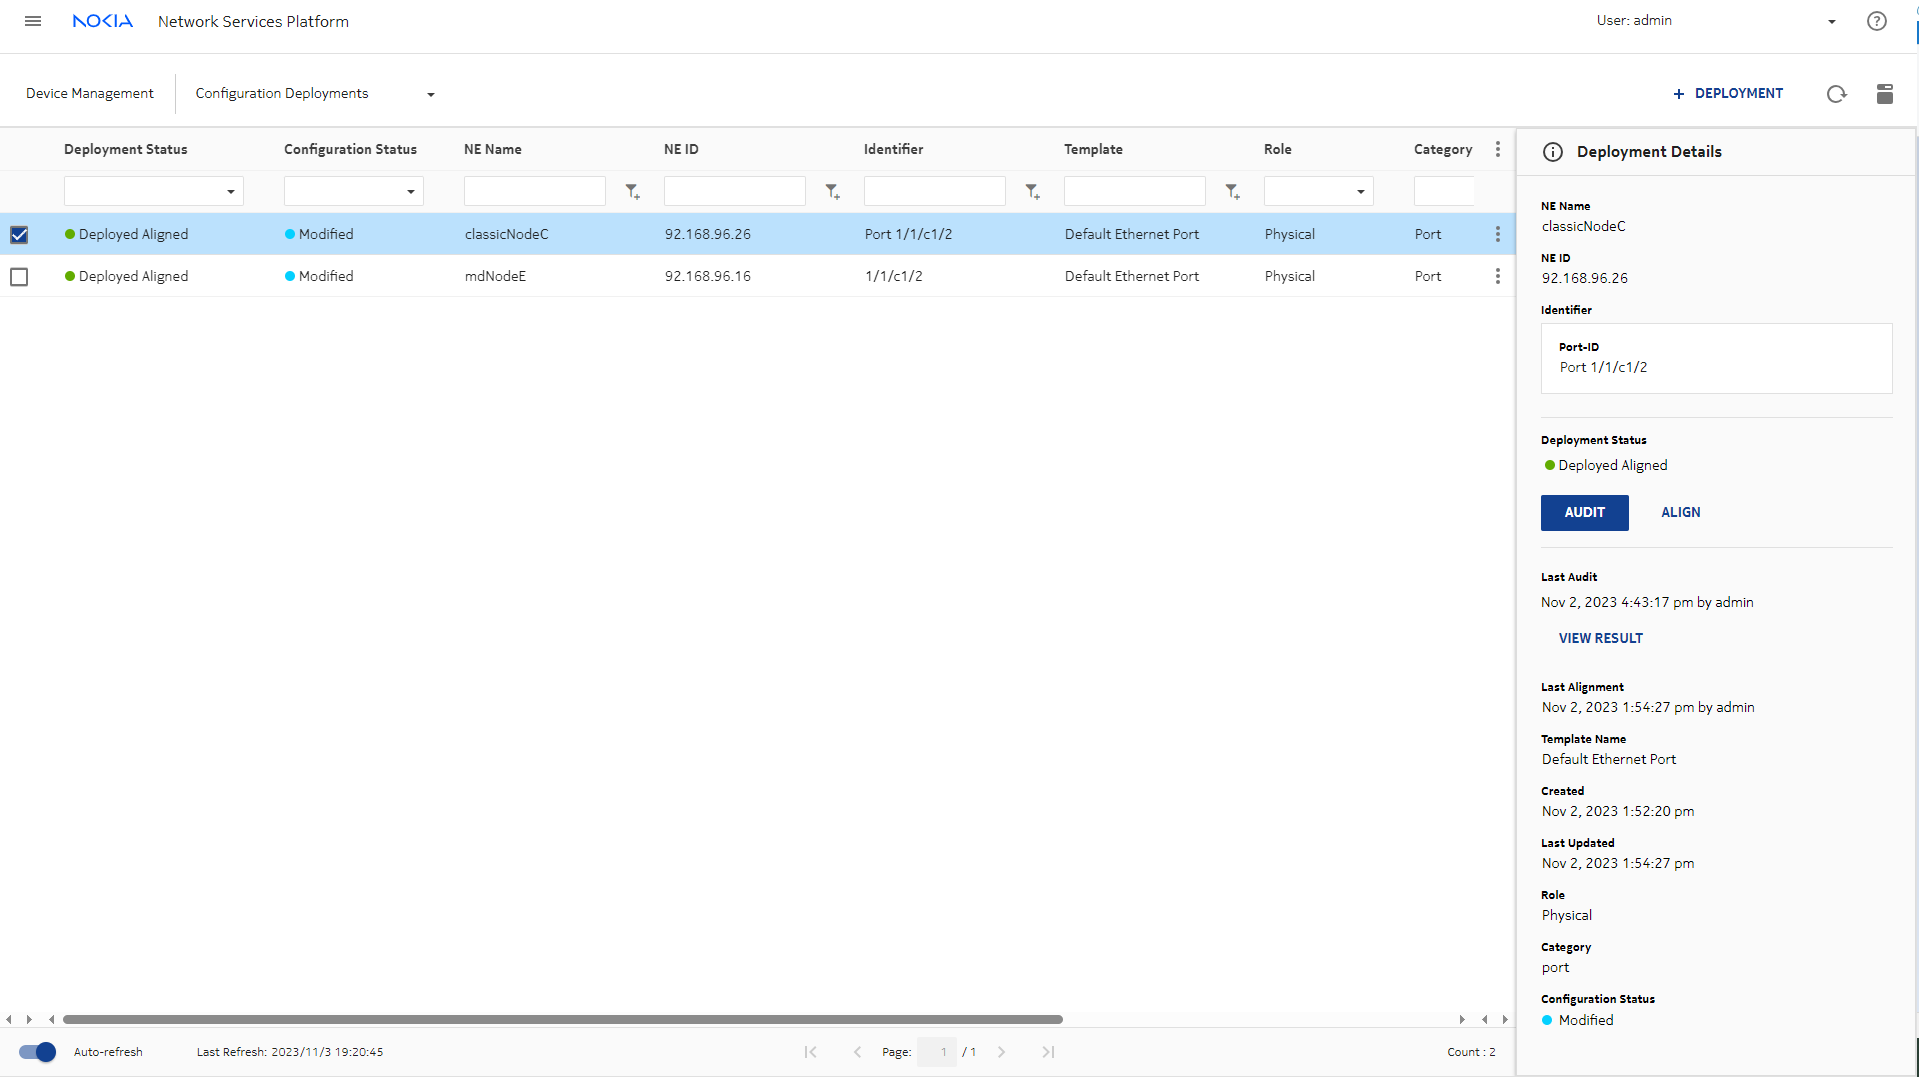
In Device Management, select Configuration Deployments to view the deployed configurations.


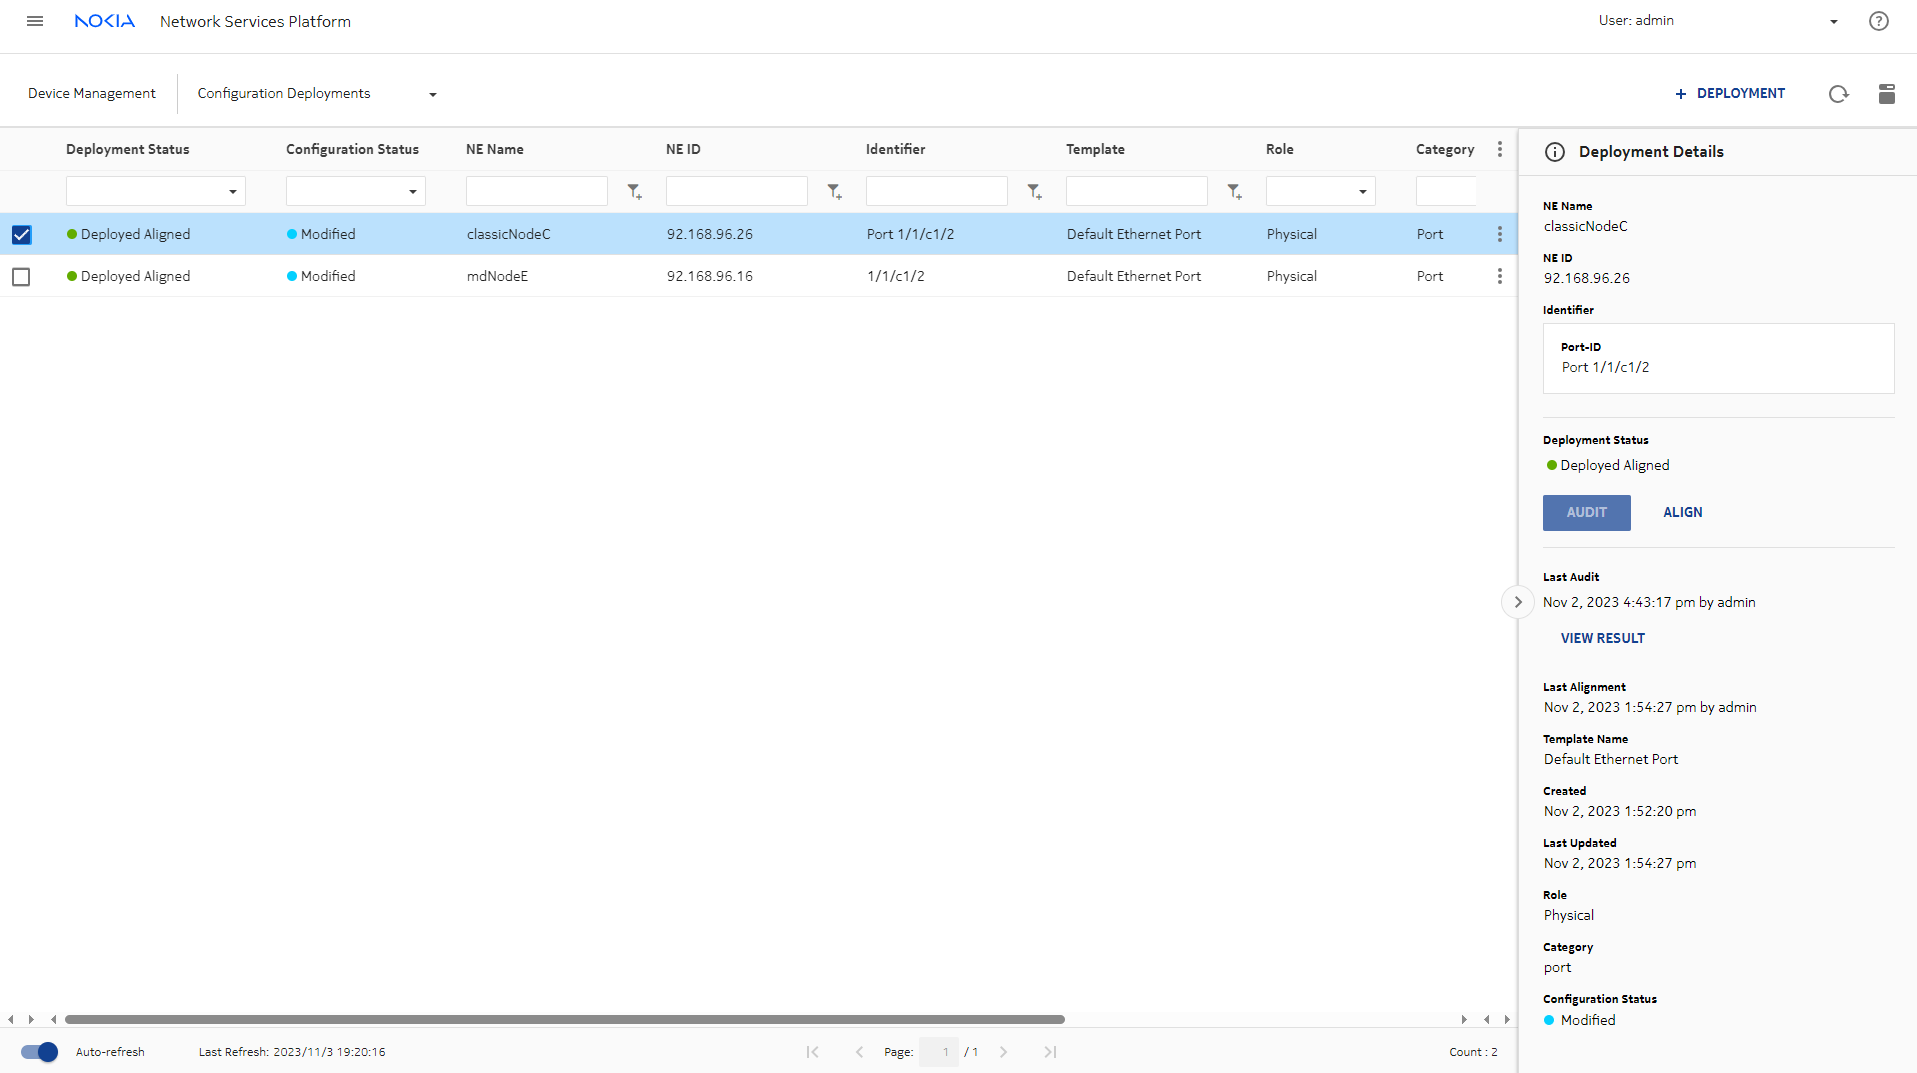
Configuration Deployments opens. Click on the port to see information about the port deployment. The Deployment Status column shows the status after the last alignment performed.


Let’s audit the configuration to compare the configuration of the port in the NSP to the configuration that is present in the network. Click AUDIT in the Deployment Details panel.


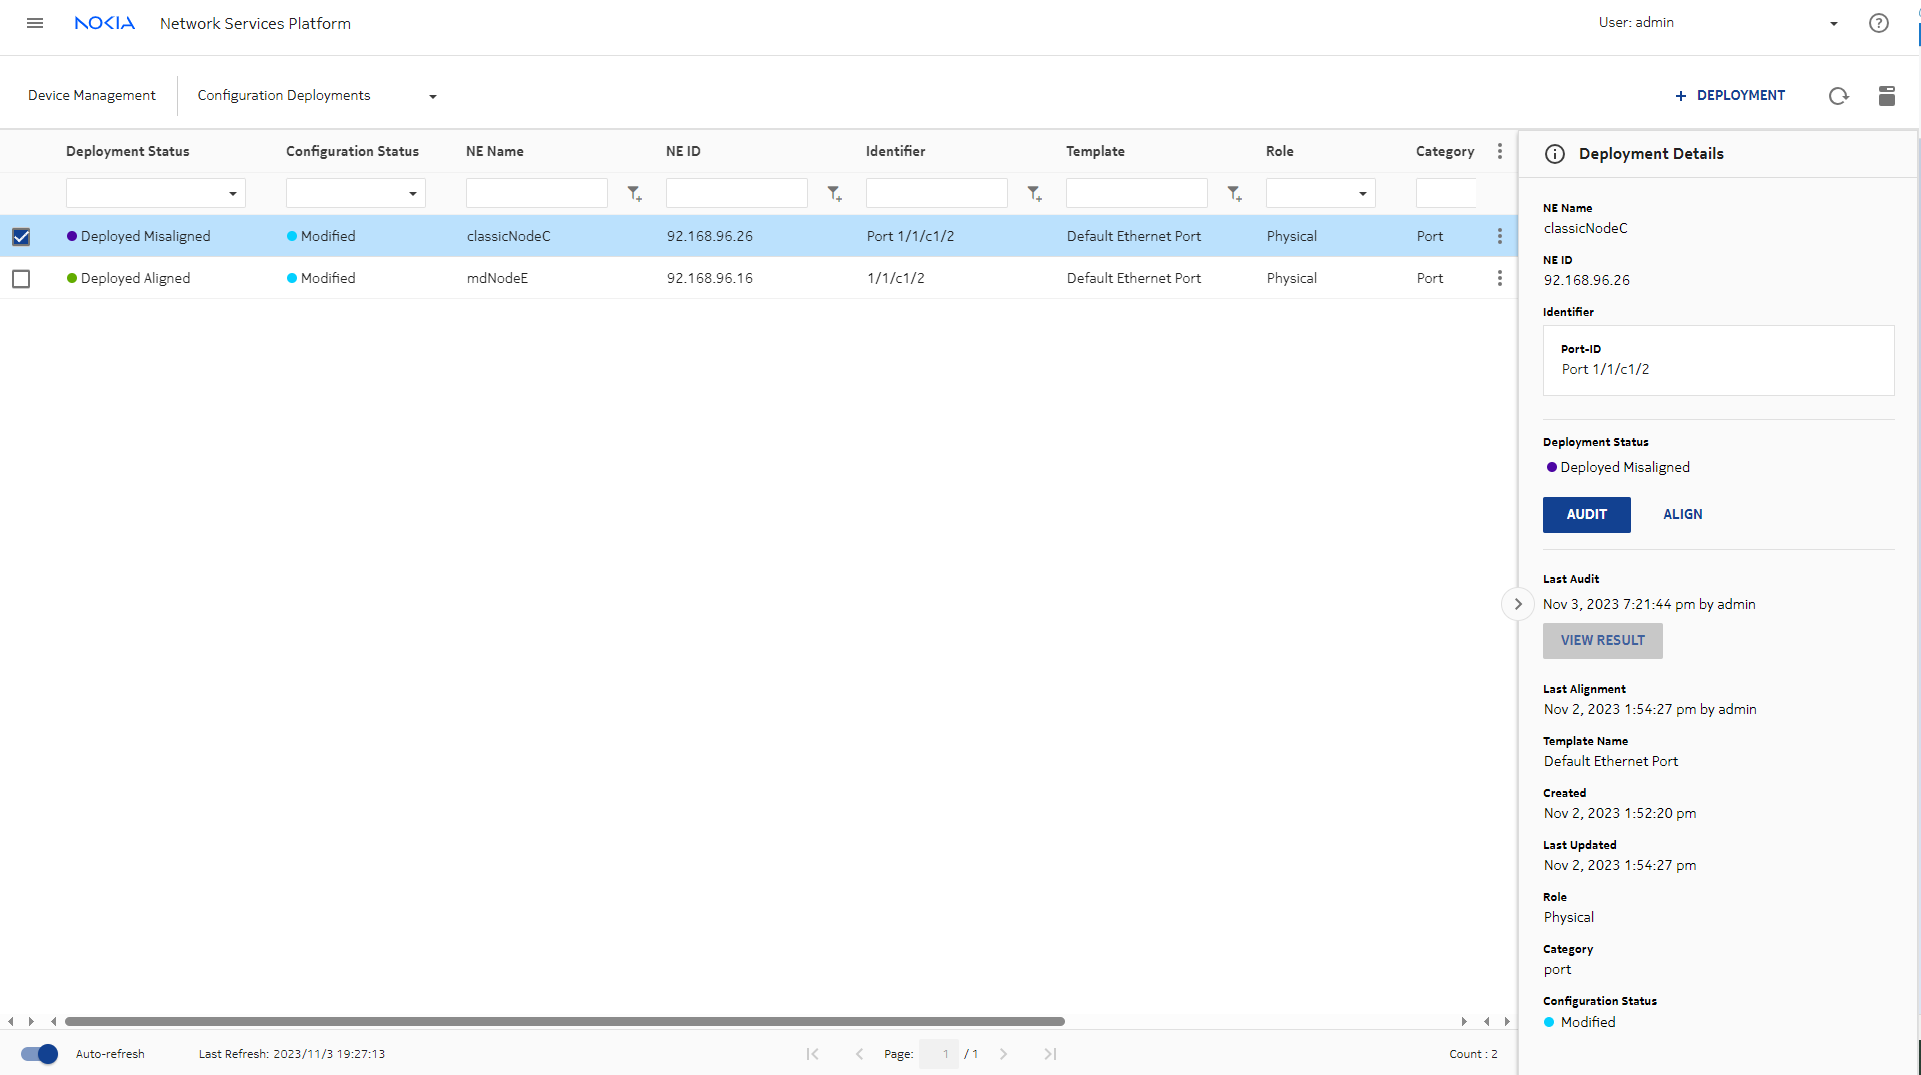
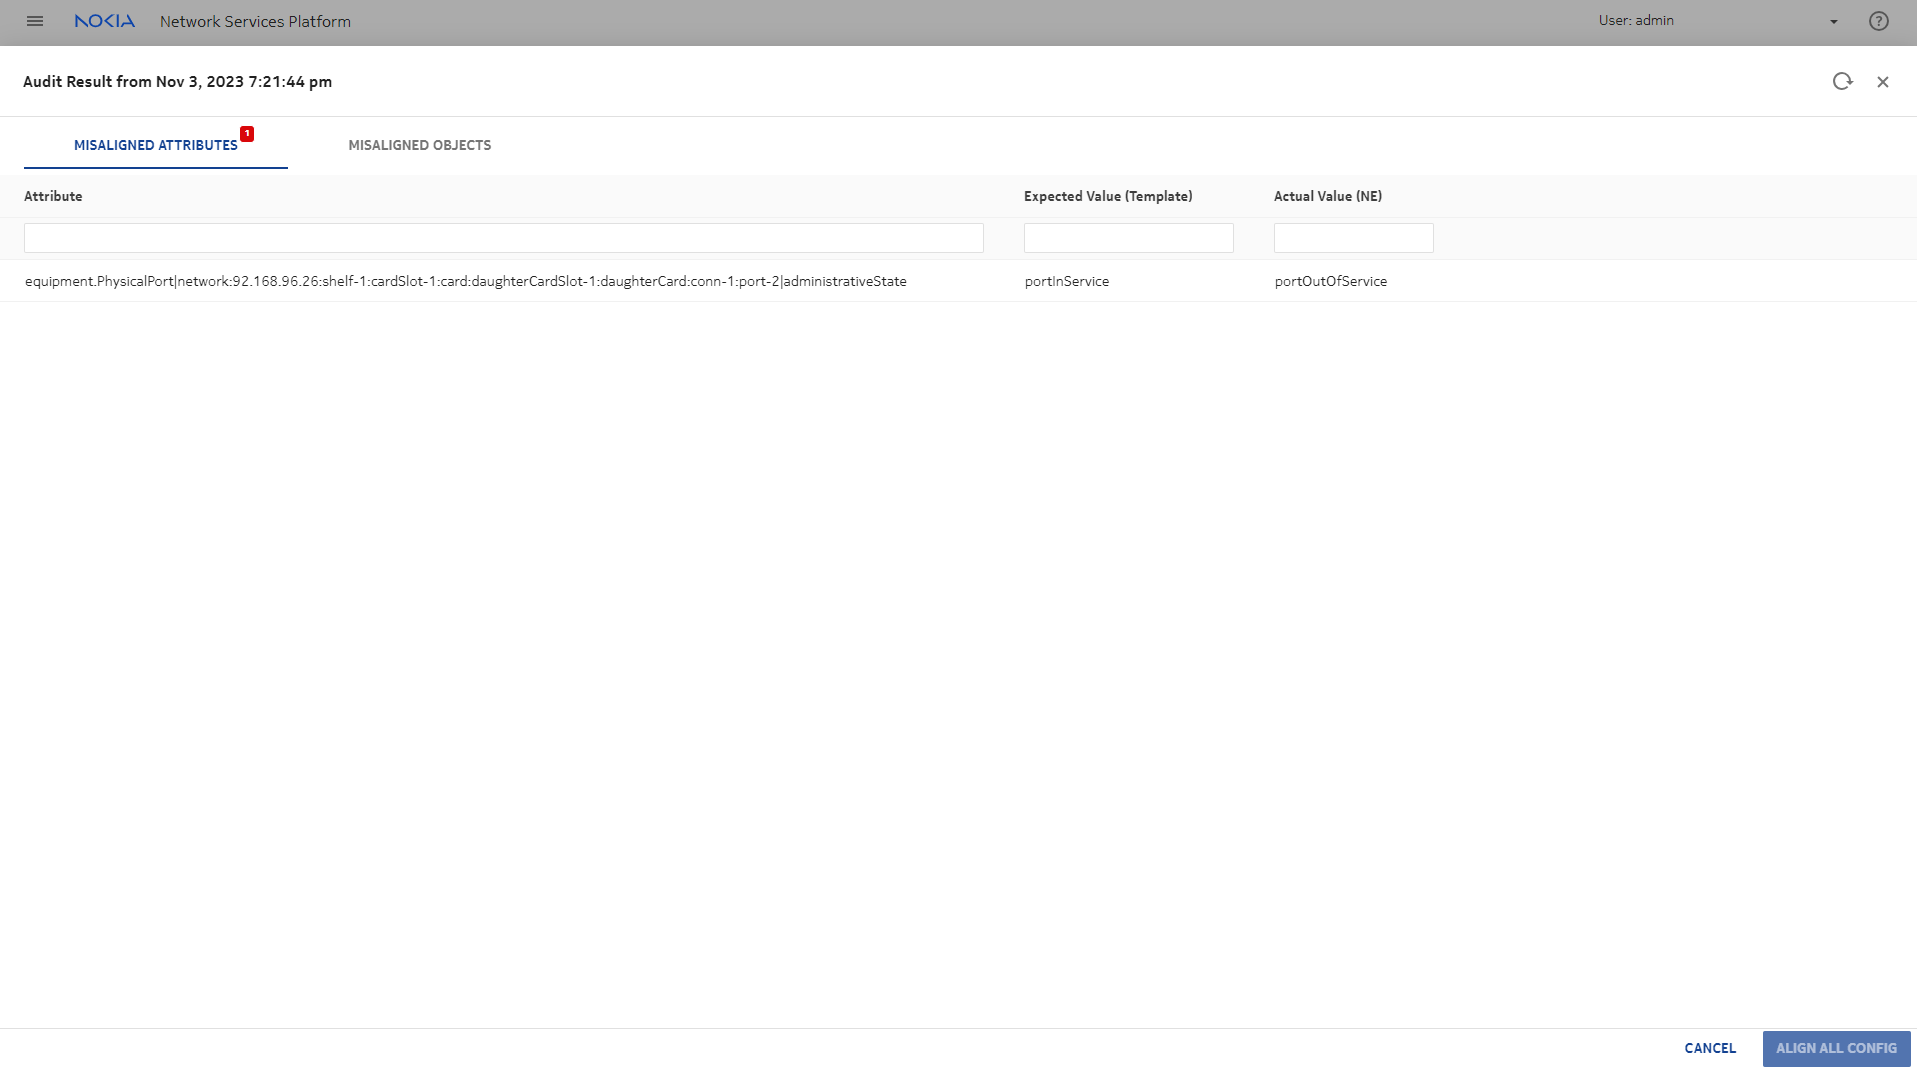
When the audit completes, we see that the deployment is misaligned. The configuration on the port is different from the configuration in Device Management.

Click VIEW RESULT for more details.

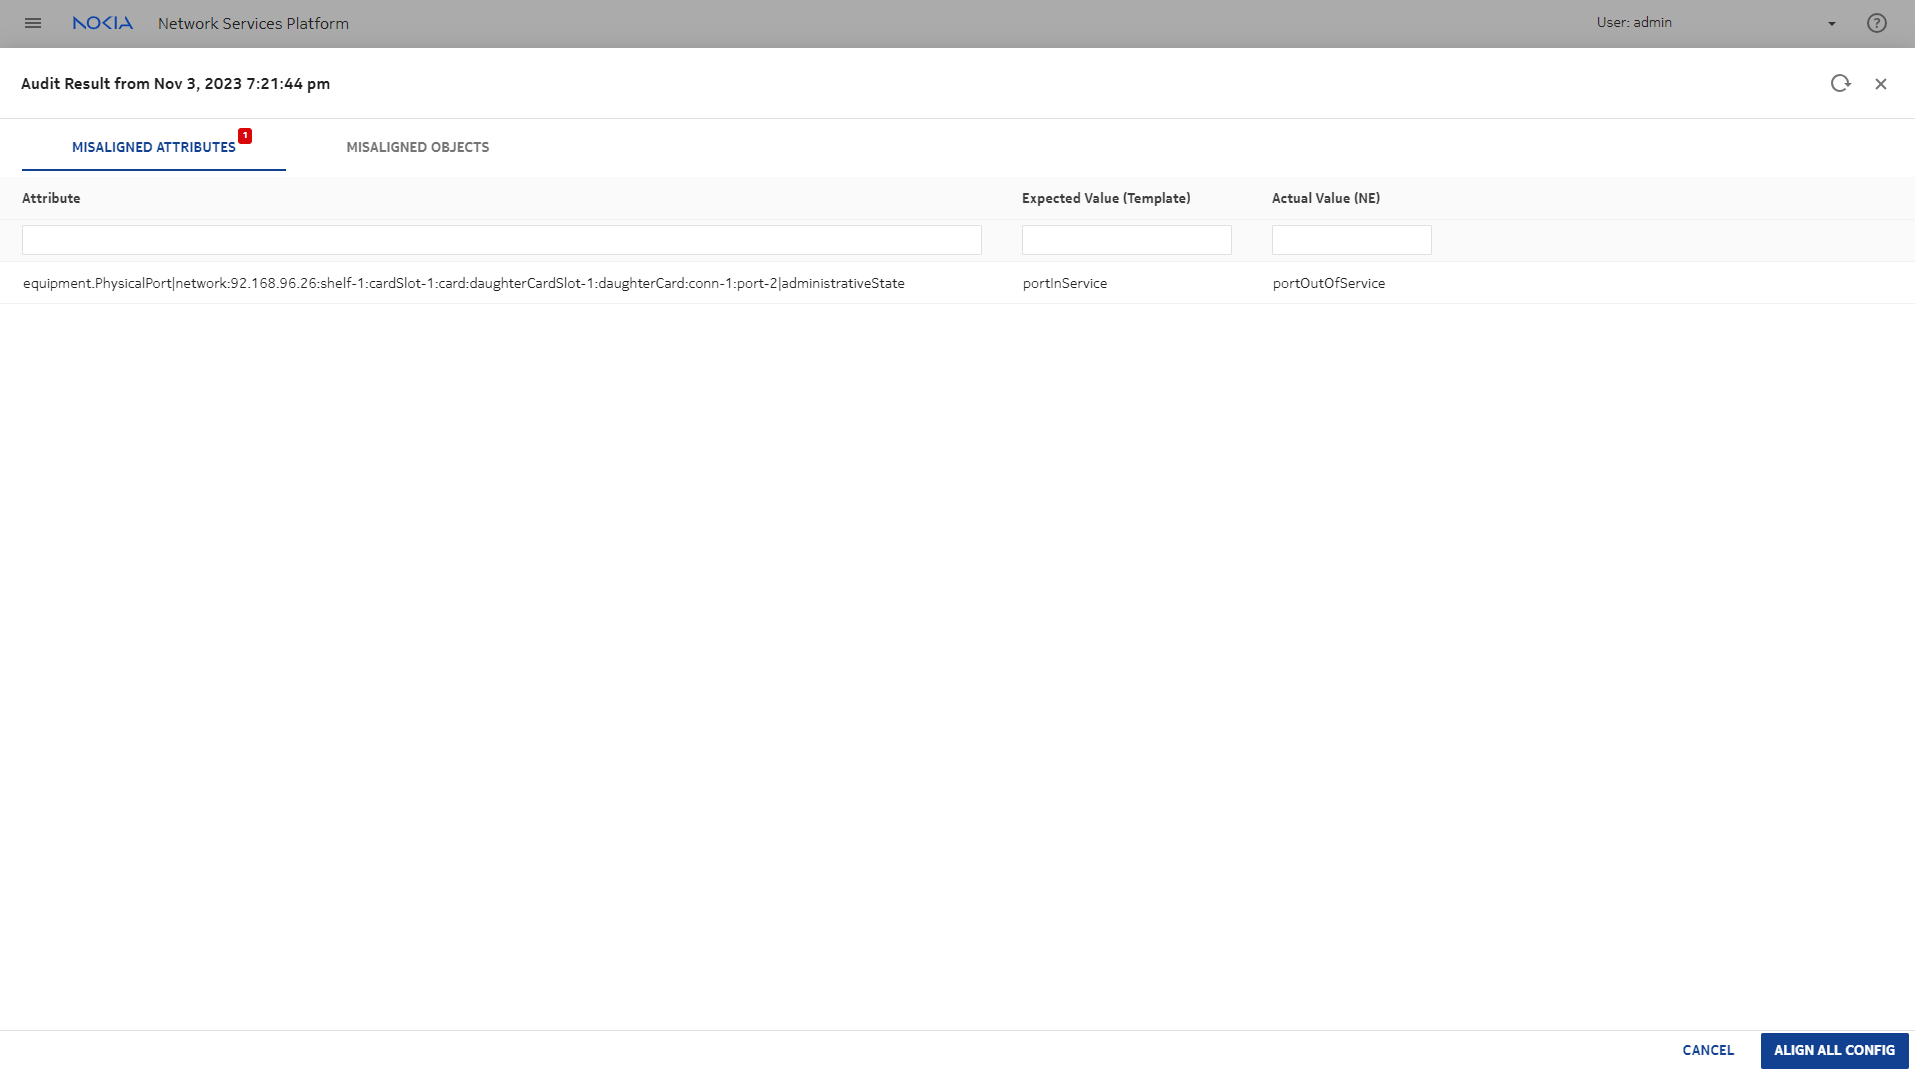
The audit results show a state mismatch for the port.


The port configuration can be aligned by clicking on ALIGN ALL CONFIG in the audit result.

Verify the results
 

After the audit is completed, we can check that the problem has cleared.

Device Management shows that the configuration is now aligned:

Inventory shows the port in green, with Operational State enabled and Administrative State unlocked:

The Object Troubleshooting dashboard shows the Major alarm cleared and Operational and Administrative states as expected:

Clicking View in Current Alarms from the Object Troubleshooting dashboard takes you to the alarm list, where the Equipment Down alarm no longer appears.

The Ports list in the Network Map and Health dashboard shows the updated port states:

The News Feed also shows that the Equipment Down alarm has cleared:

Returning to Data Collection and Analysis Visualizations, we can also see that the traffic on the port has resumed.