Onboarding an NE into NSP
Purpose
This process shows you how to use the NSP to manage an NE, configure attributes, verify component health, and confirm that the NE is up, running, and ready for further configuration.
Prerequisites
This process assumes that the following prerequisites are in place:
-
The intent type artifact bundles required for device configuration have been installed:
-
icm-equipment-card_mda
-
icm-equipment-port-connector
-
icm-equipment-port-ethernet
-
icm-router-network-interface
-
The NE has been discovered in the NSP.
-
Required templates and telemetry subscriptions have been created.
-
Power modules and SFMs have been configured on the NE using CLI.
For details about intent type installation, see the NSP Network Automation Guide. For device discovery and template creation, see the NSP Device Management Guide. For telemetry subscriptions, see the NSP Data Collection and Analysis Guide. For CLI, see the NE documentation.
Resync the NE in Device Management
|
|
1 |
First, we’ll perform a resync, to ensure that the configuration on the NE is aligned with the NSP. This step is performed immediately after the NE is discovered.
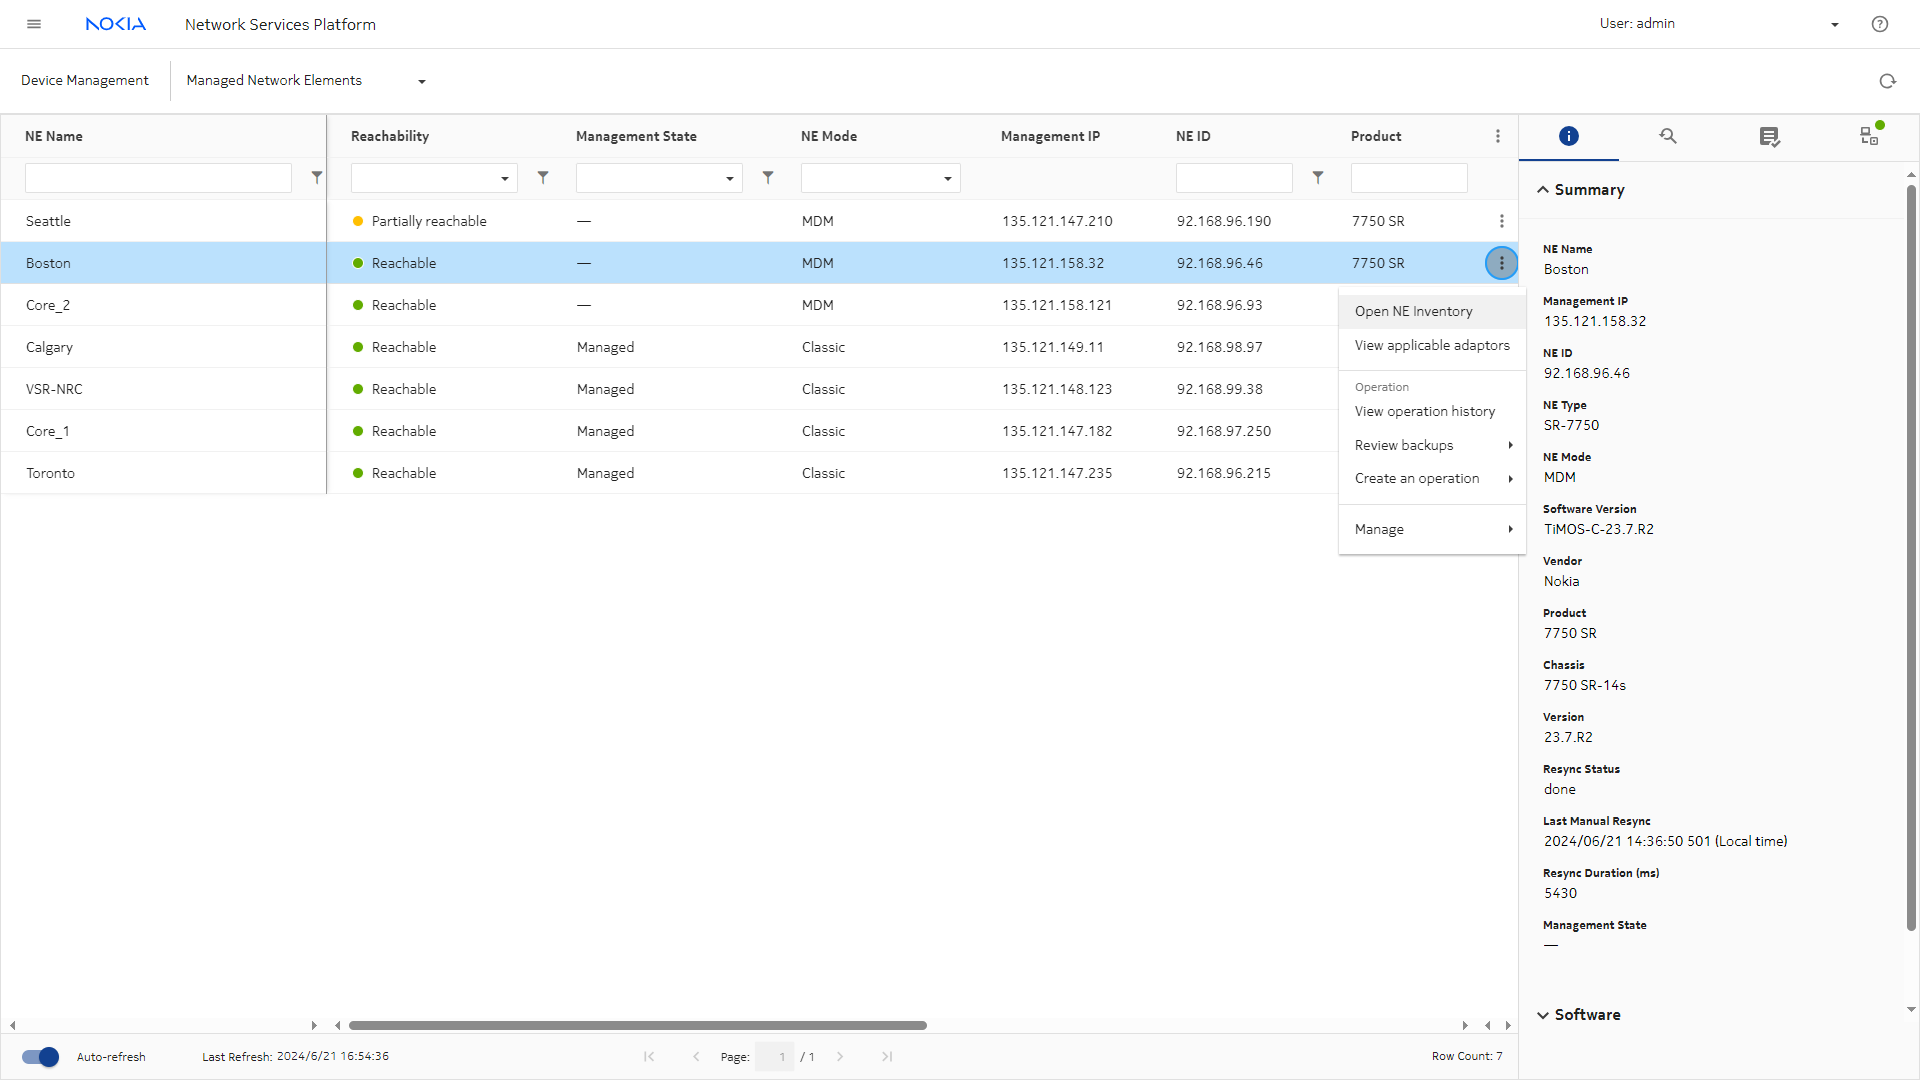
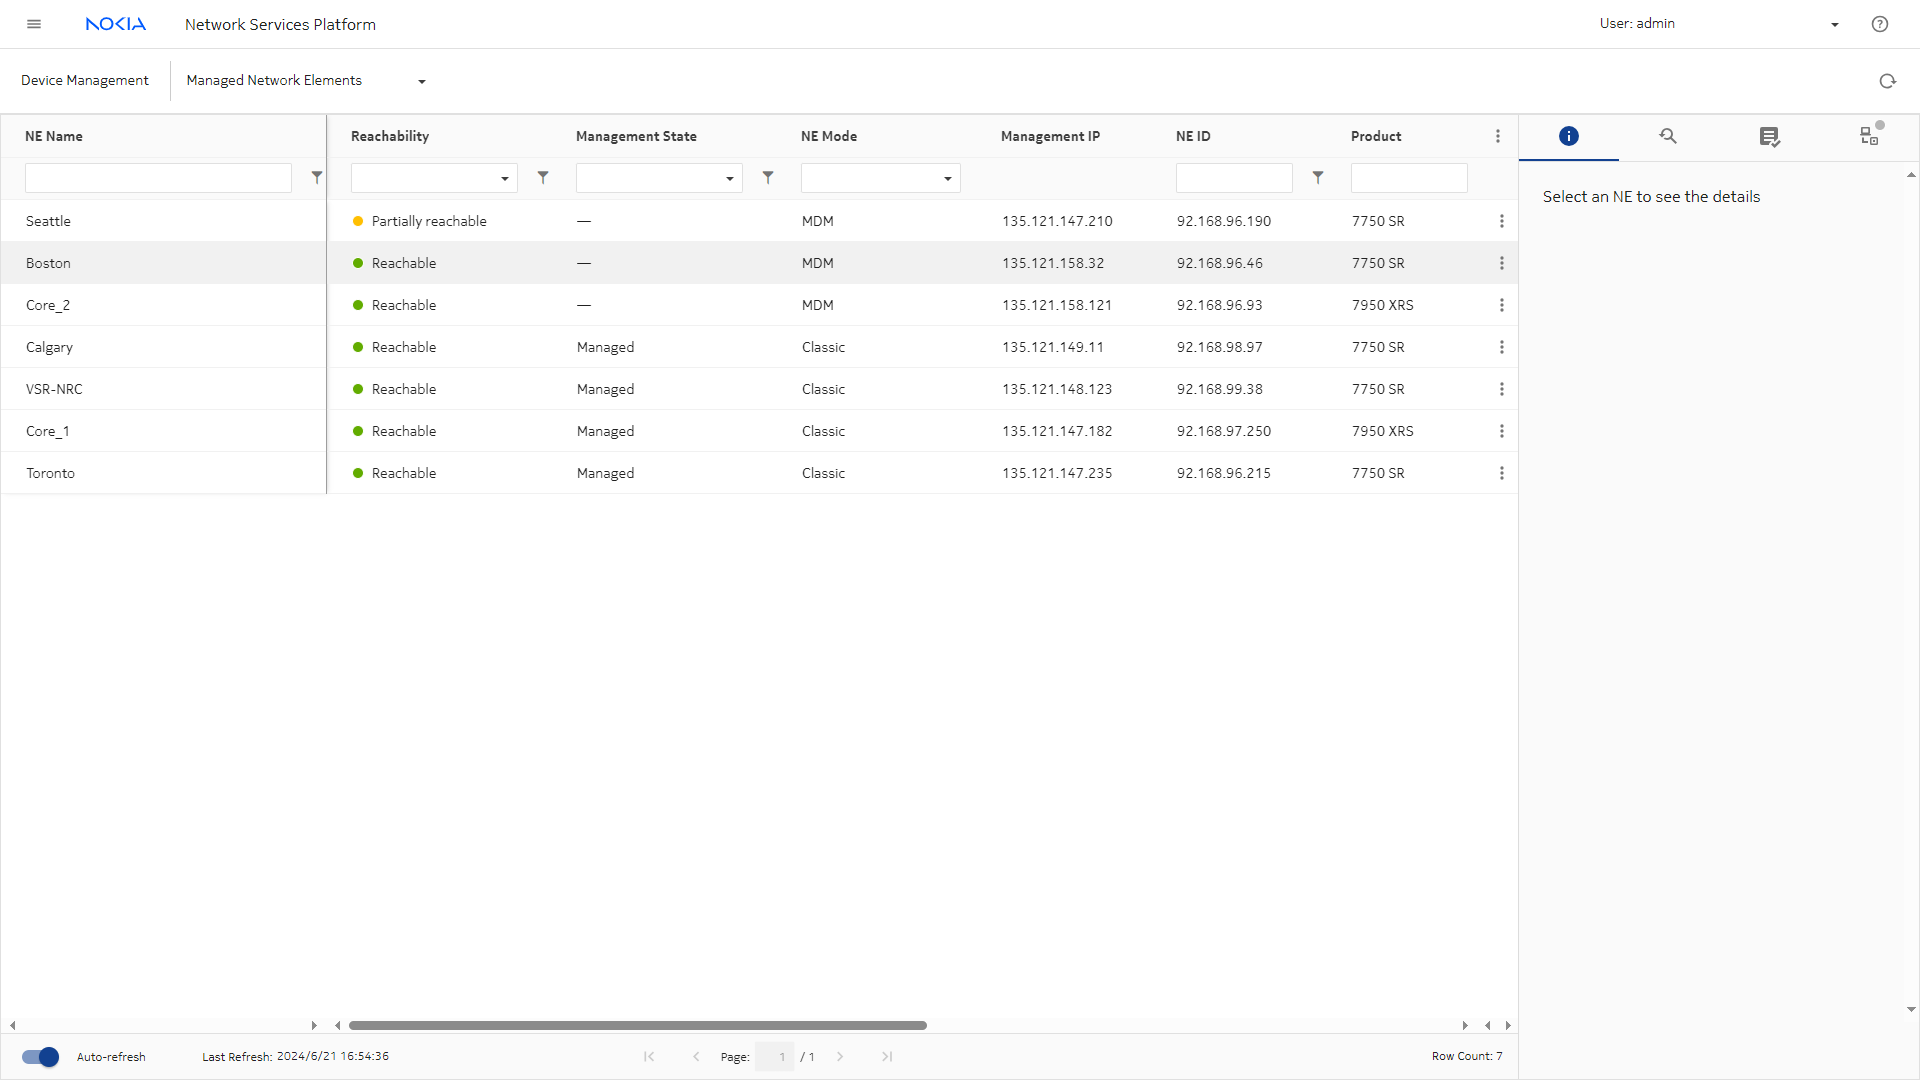
View the NE in Device Management, Managed Network Elements. A green icon indicates that the NE is reachable.
|
2 |
Select the NE and choose Manage, Resync from the table row actions menu (). |
Verify the NE inventory pre configuration
|
|
1 |
Select the NE and choose Open in NE Inventory from the table row actions menu ().
|
2 |
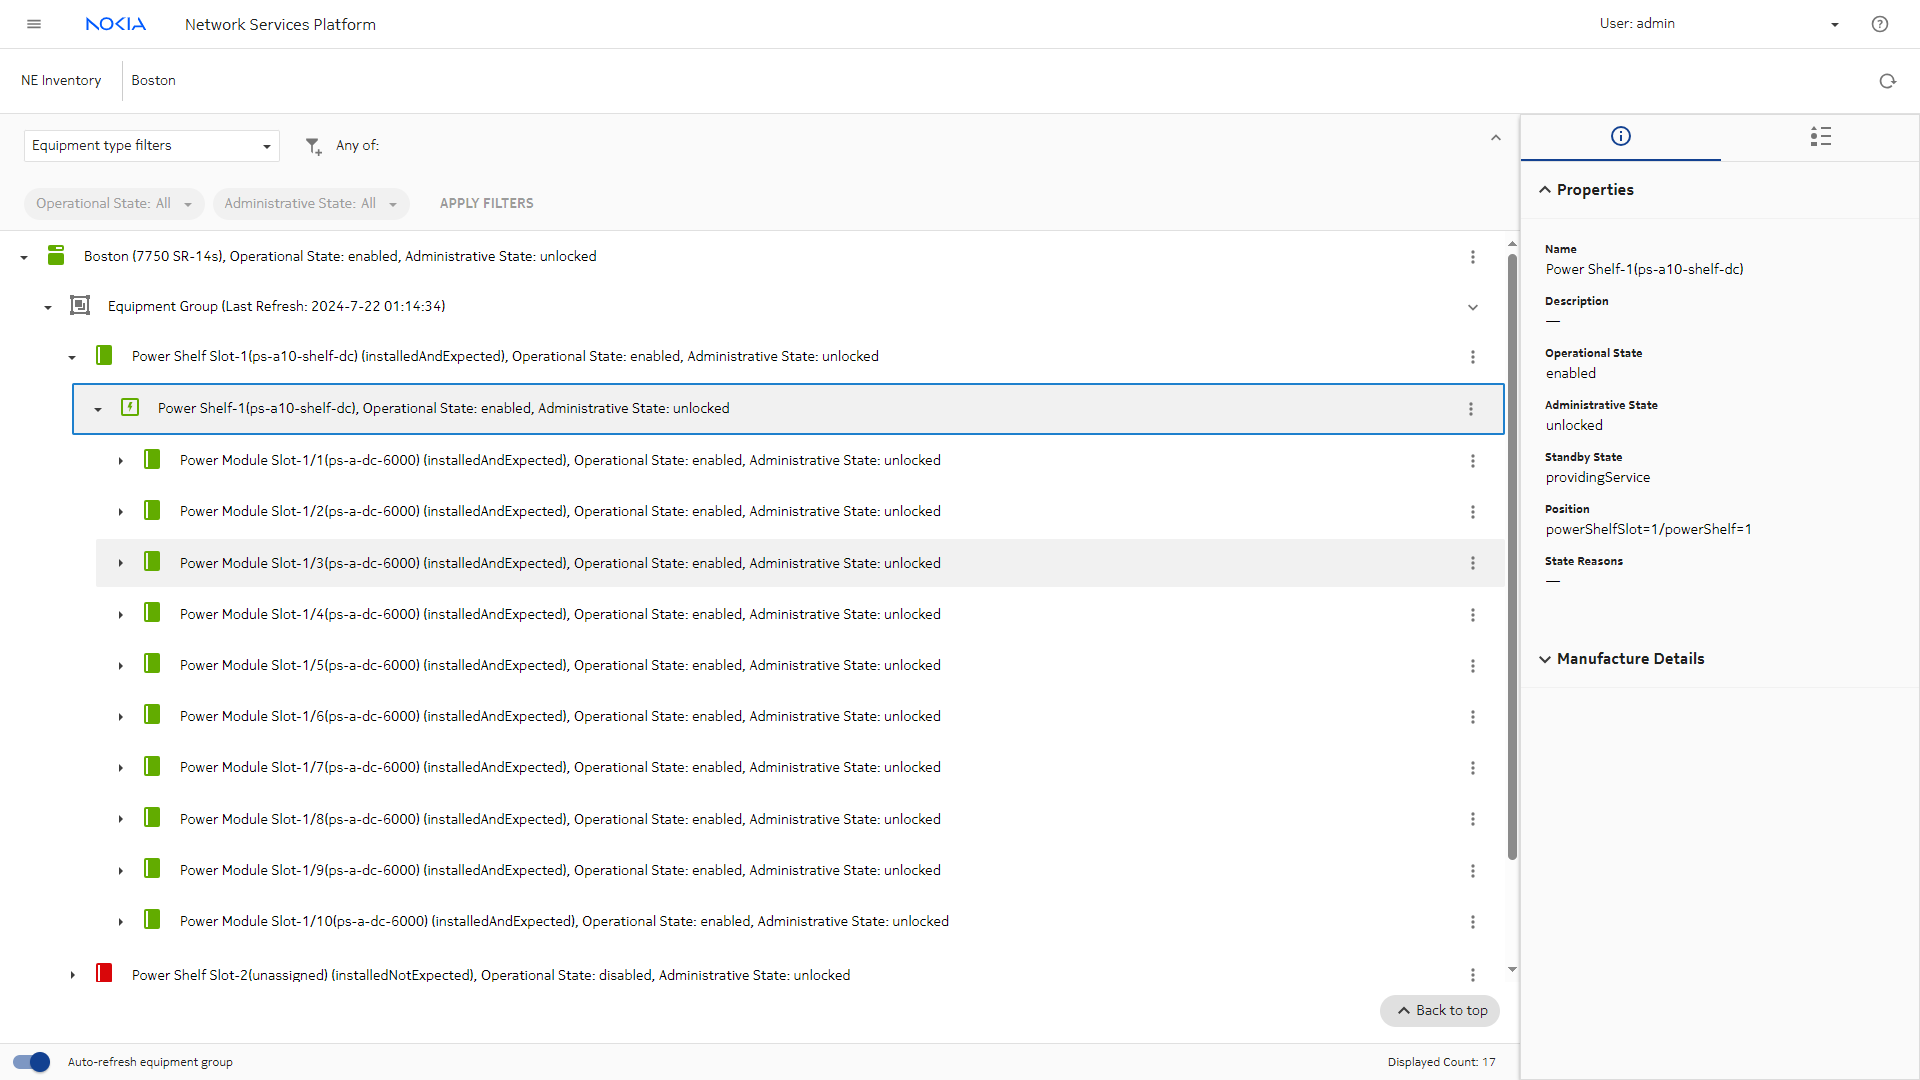
The NE inventory tree view opens in a new browser tab, displaying the components that are already configured using CLI.
Expand the Equipment group to show the status of the power shelf and power modules.
|
3 |
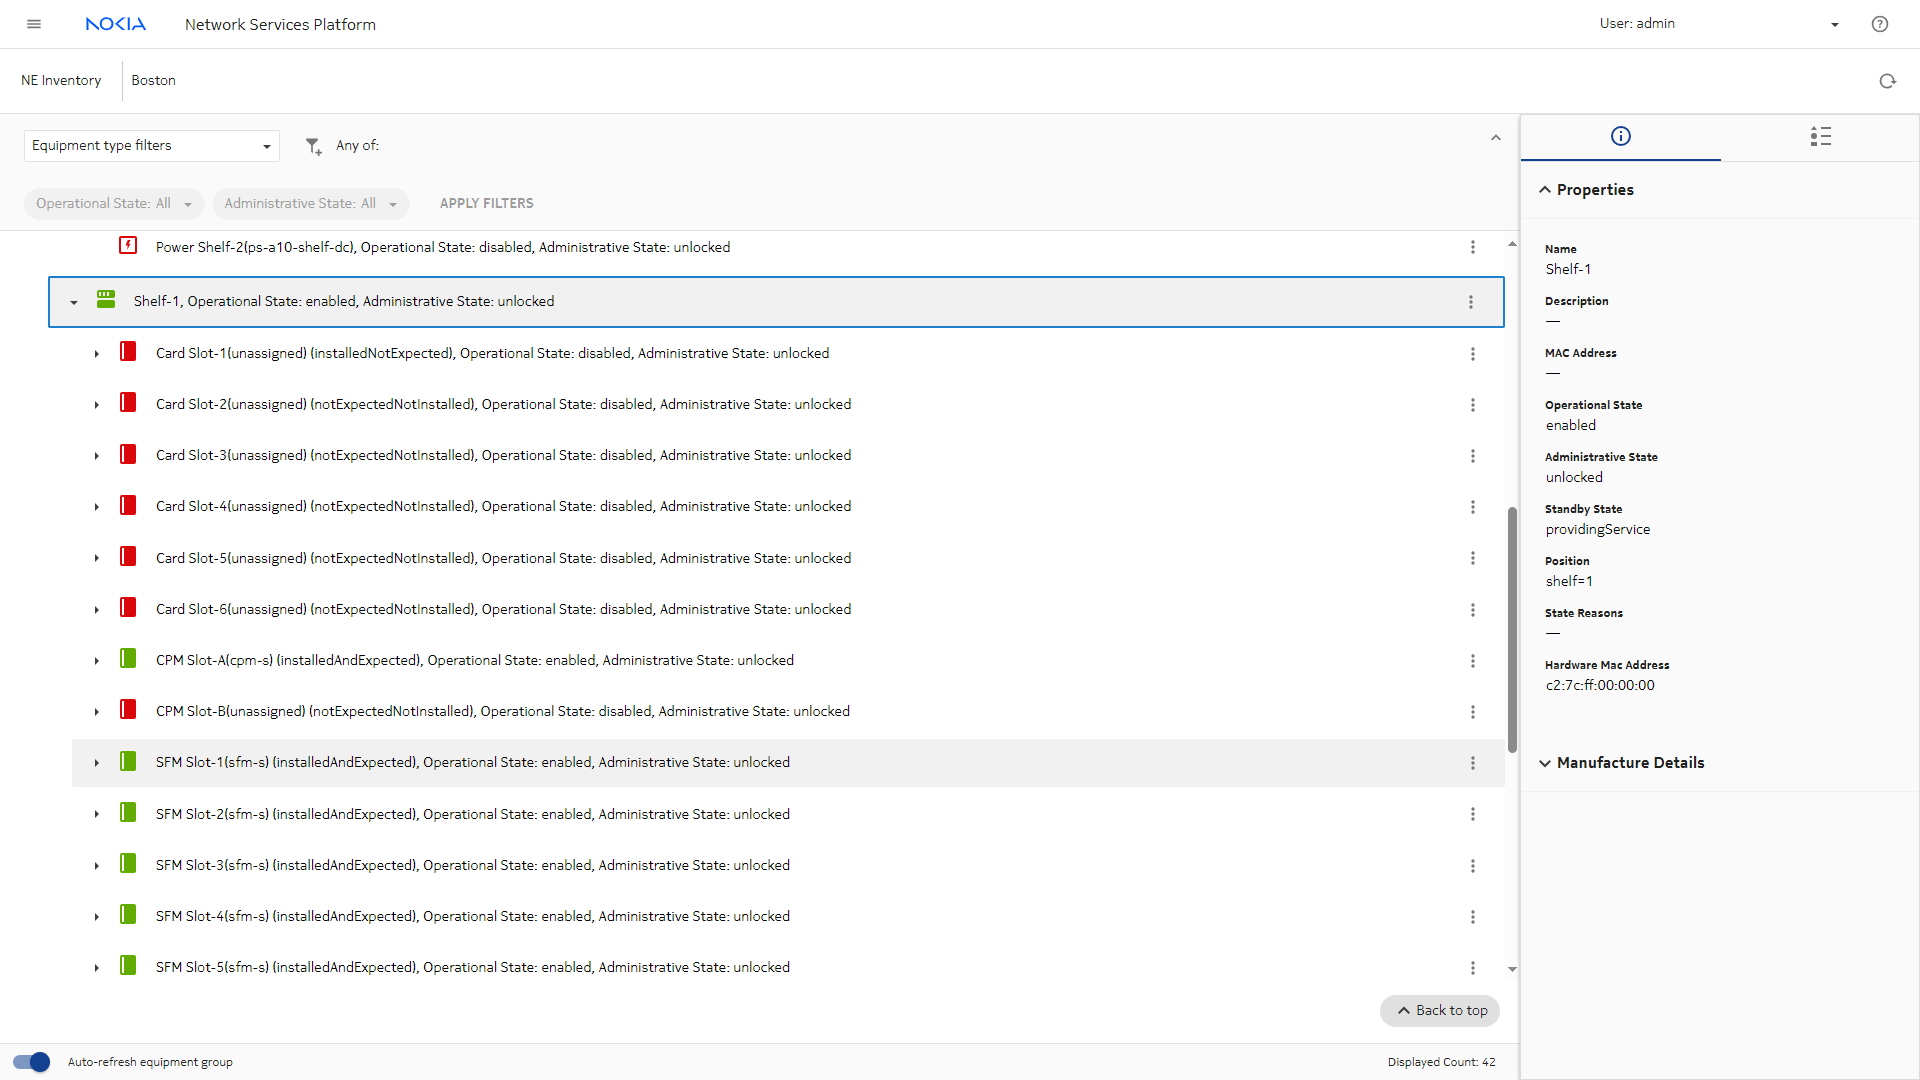
Expand the shelf to show the status of the SFMs.
|
Create device configuration deployments for NE components
|
|
1 |
Next, we’ll configure NE components. This can be done by deploying a series of templates in the Device Management, Configuration Deployments view.
|
2 |
From the Device Management, Configuration Deployments view, click DEPLOYMENT. We’ll start by configuring Cards and MDAs, which are physical components: select Physical from the drop-down.
|
3 |
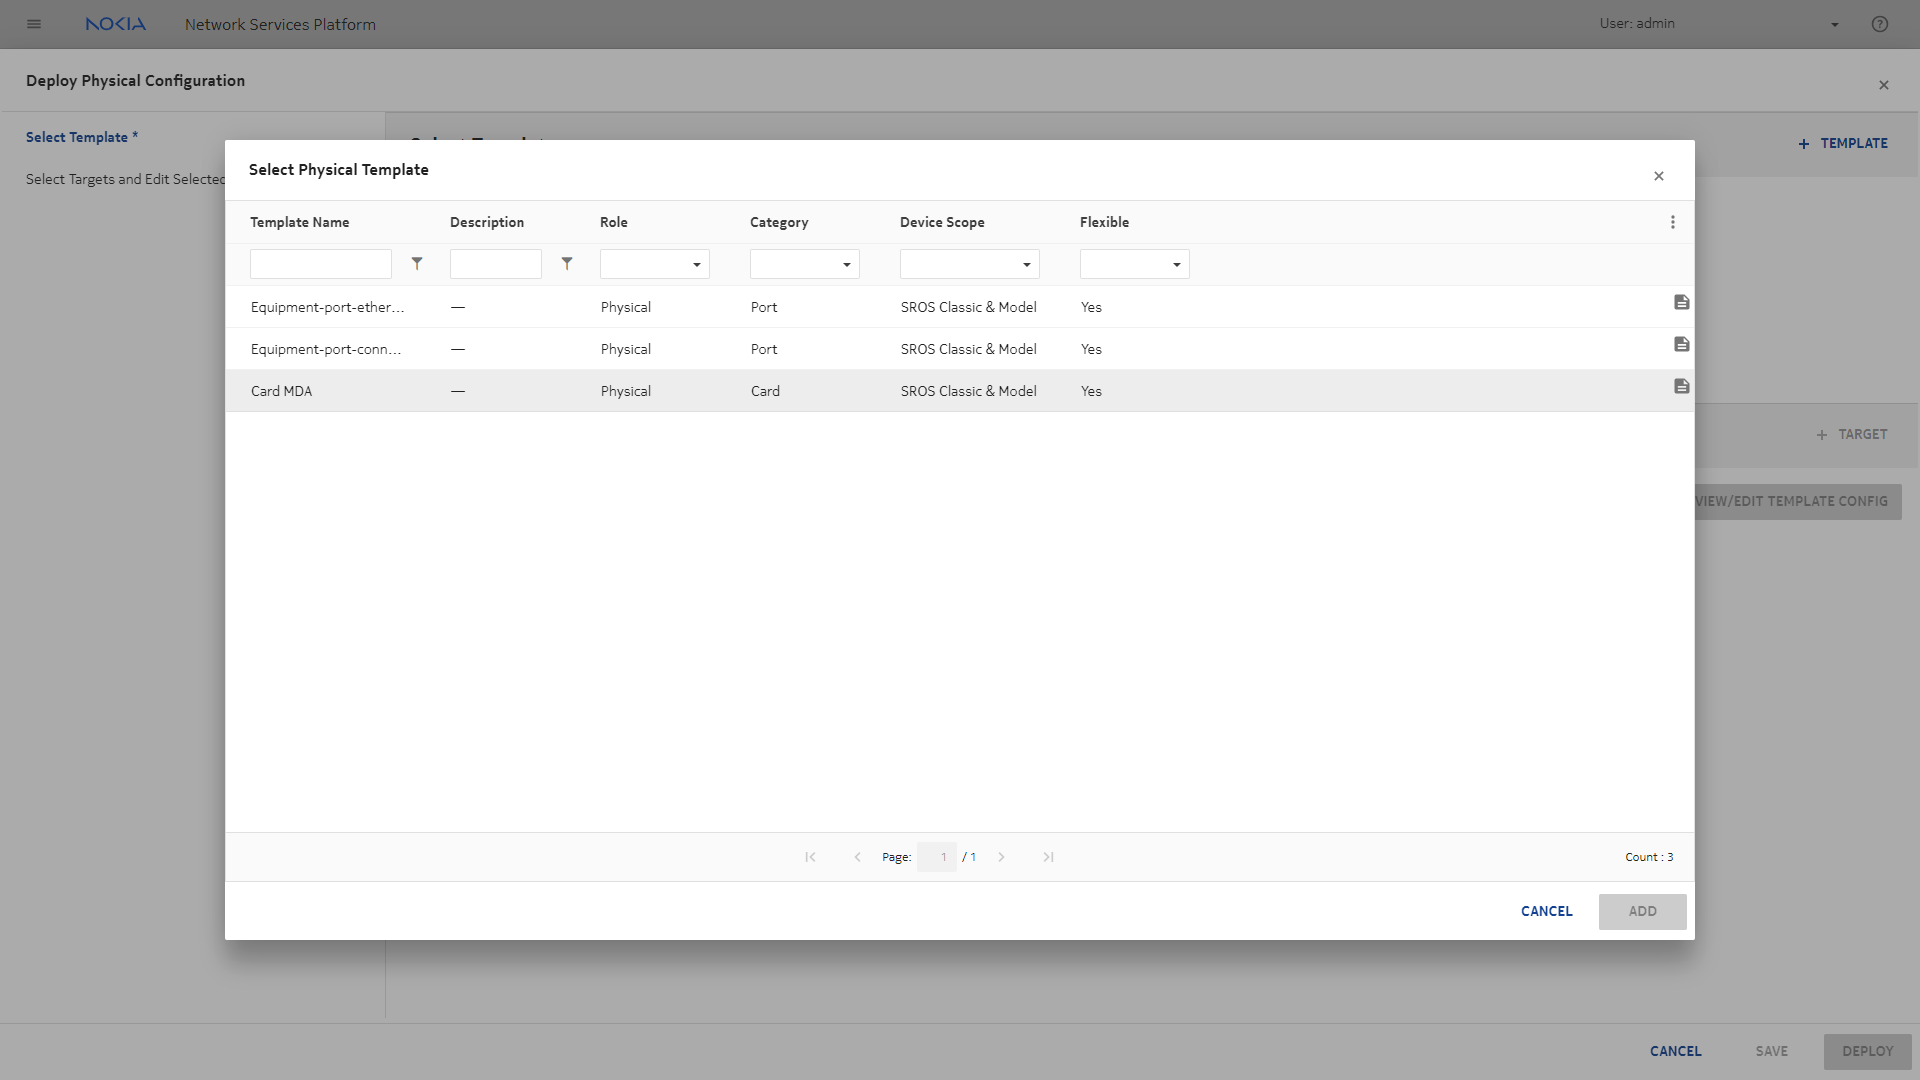
In the form that opens, click TEMPLATE and choose the template for Card and MDA configuration.
|
4 |
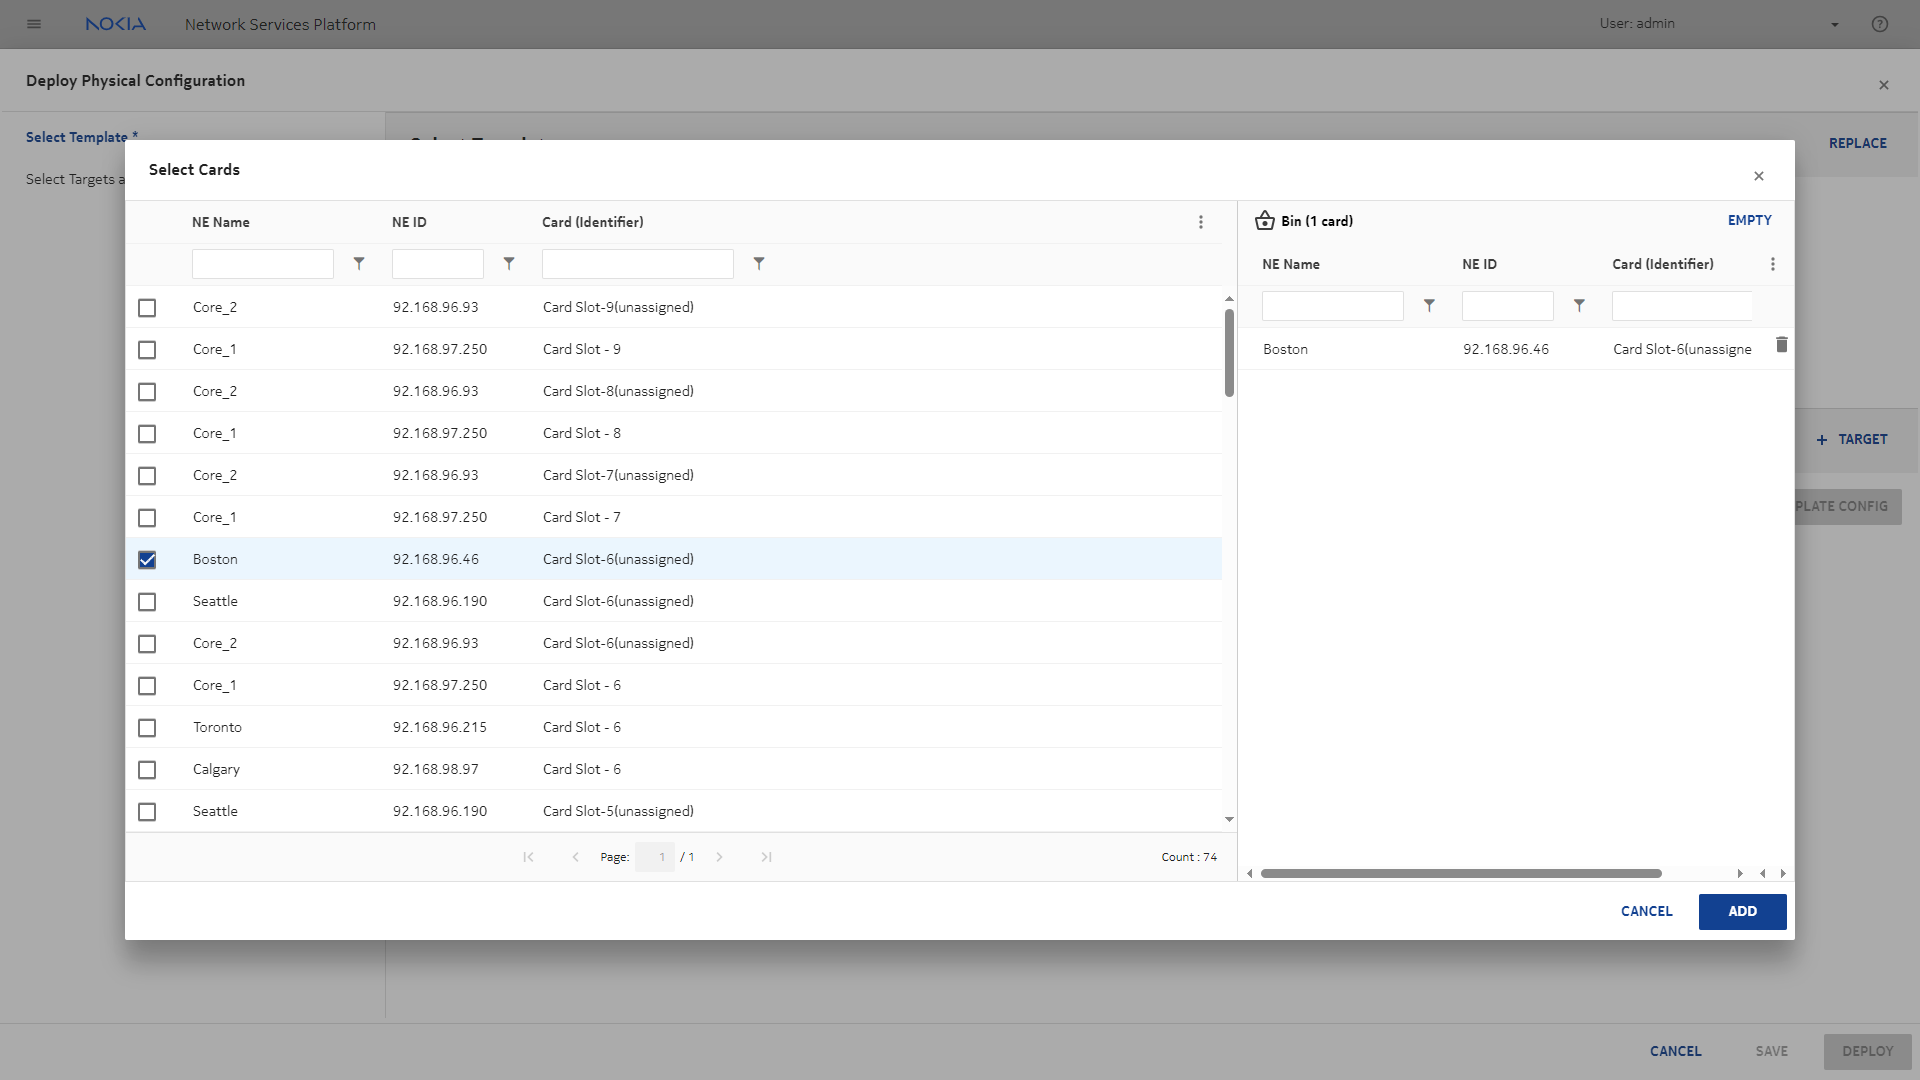
Choose a card to add as the target:
-
Click TARGET and select Cards as the target type.
-
Choose a card slot from the list to add it to the Bin and click ADD
|
5 |
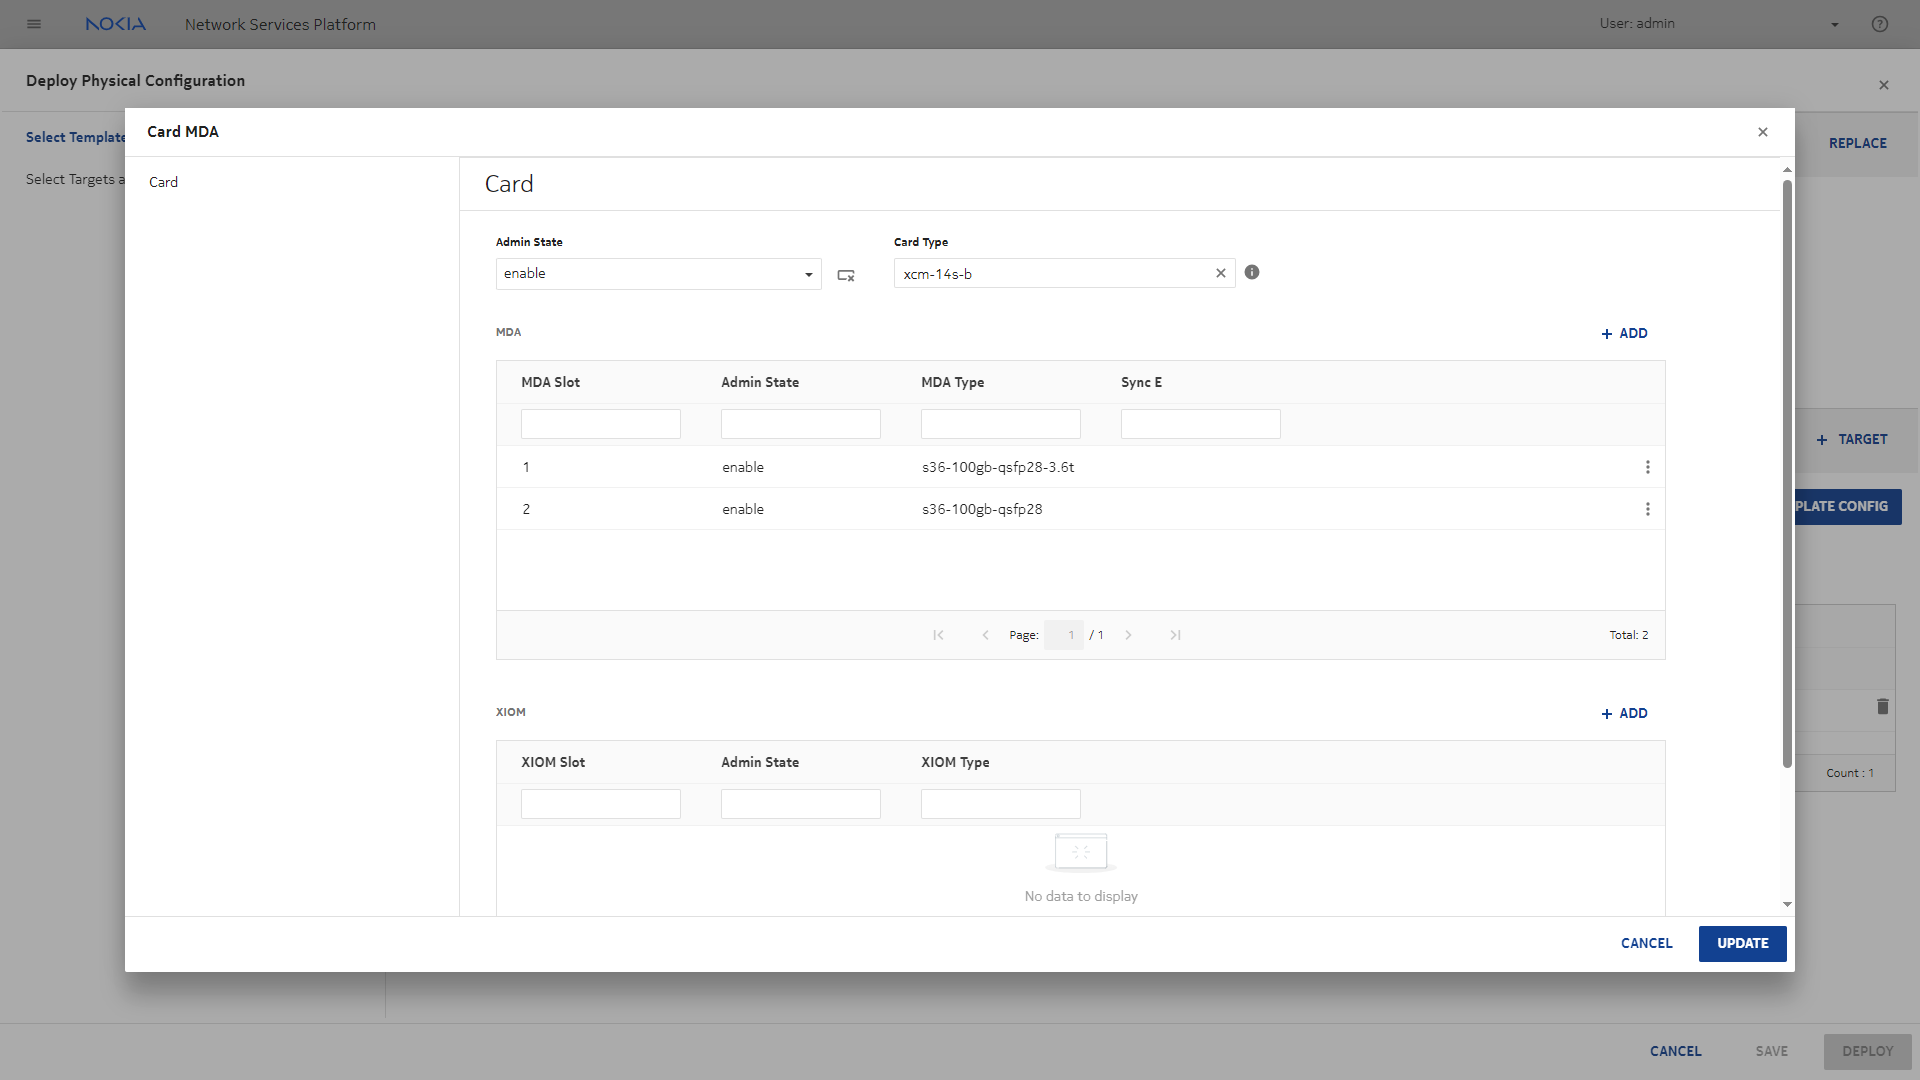
Click VIEW/EDIT TEMPLATE CONFIG. In the form that opens, configure the card parameters:
-
Choose a card type.
-
In the MDA panel, click ADD and configure the parameters to create an MDA.
-
Click UPDATE.
|
6 |
Click DEPLOY to deploy the configuration.
|
7 |
Create physical deployments for additional connectors and ports, using their templates. The overall steps are very similar to creation of a Card and MDA deployment, but the parameters vary by template.
-
Configure deployments for port connectors if applicable, using the template created from the icm-equipment-port-connector intent type.
-
Configure deployments for ports, using the template created from the icm-equipment-port-ethernet intent type.
|
8 |
After the port configurations have been deployed, configure OSPF and ISIS routing on the NE using CLI.
|
9 |
Now we can create a logical deployment to configure a router interface.
Click DEPLOYMENT and select Logical from the drop-down.
|
10 |
|
11 |
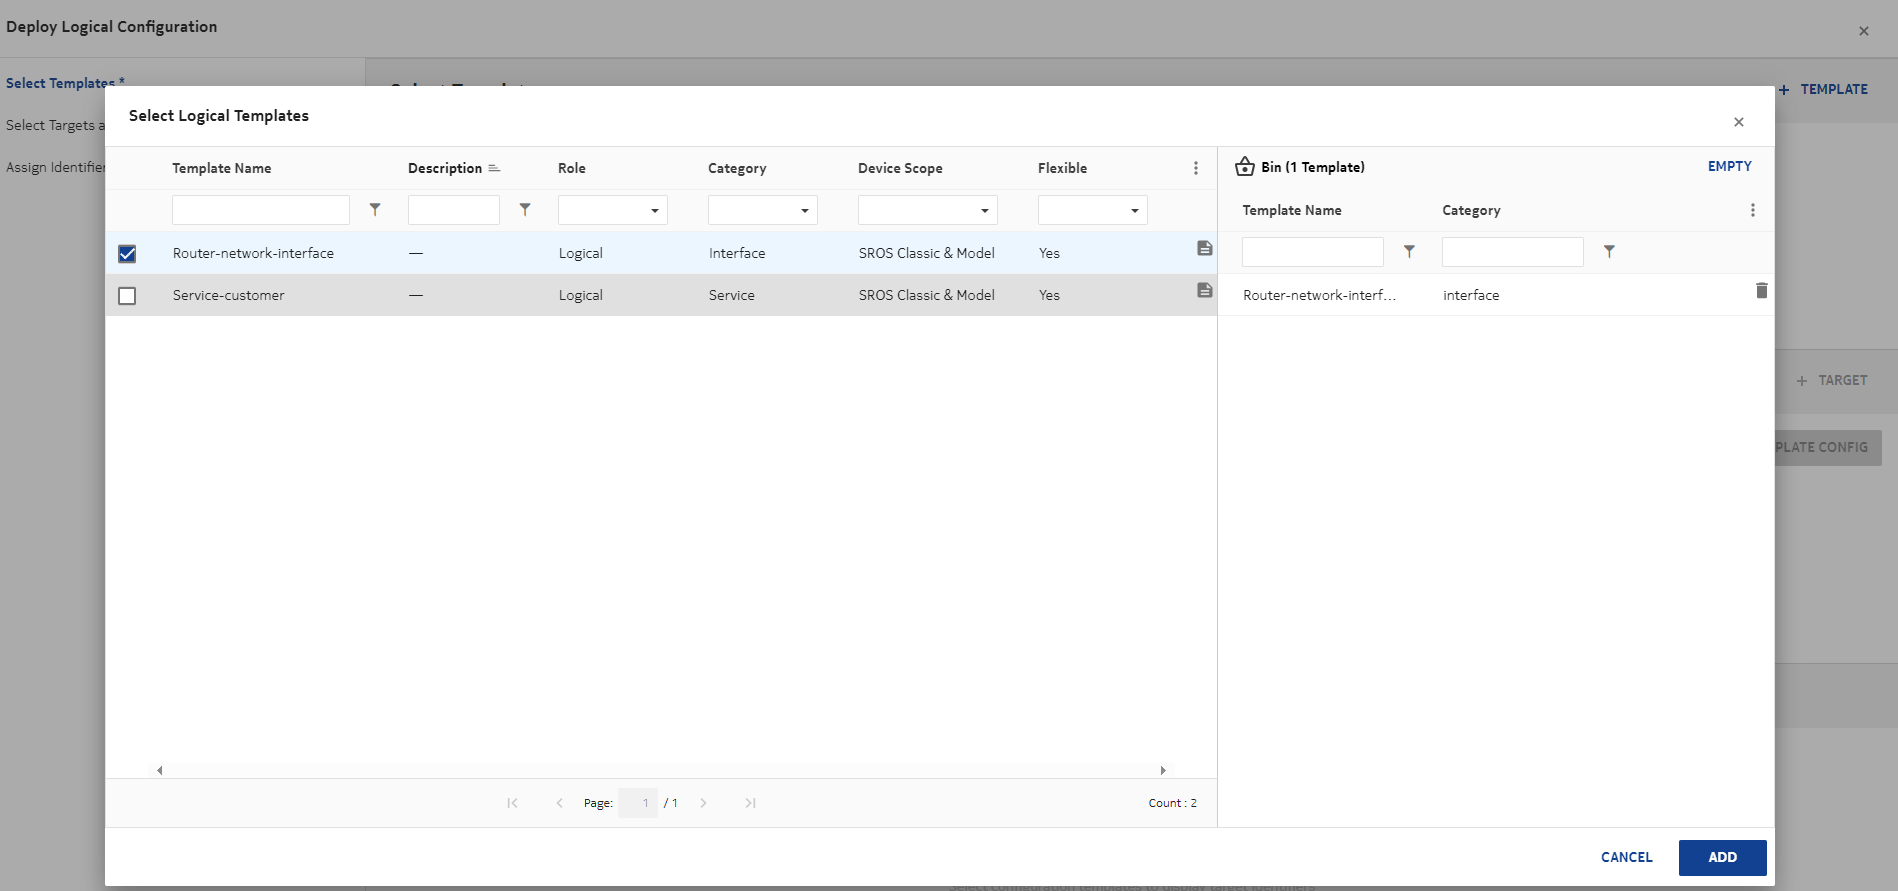
In the form that opens, click TEMPLATE and choose the template for router interface configuration. Click ADD.
|
12 |
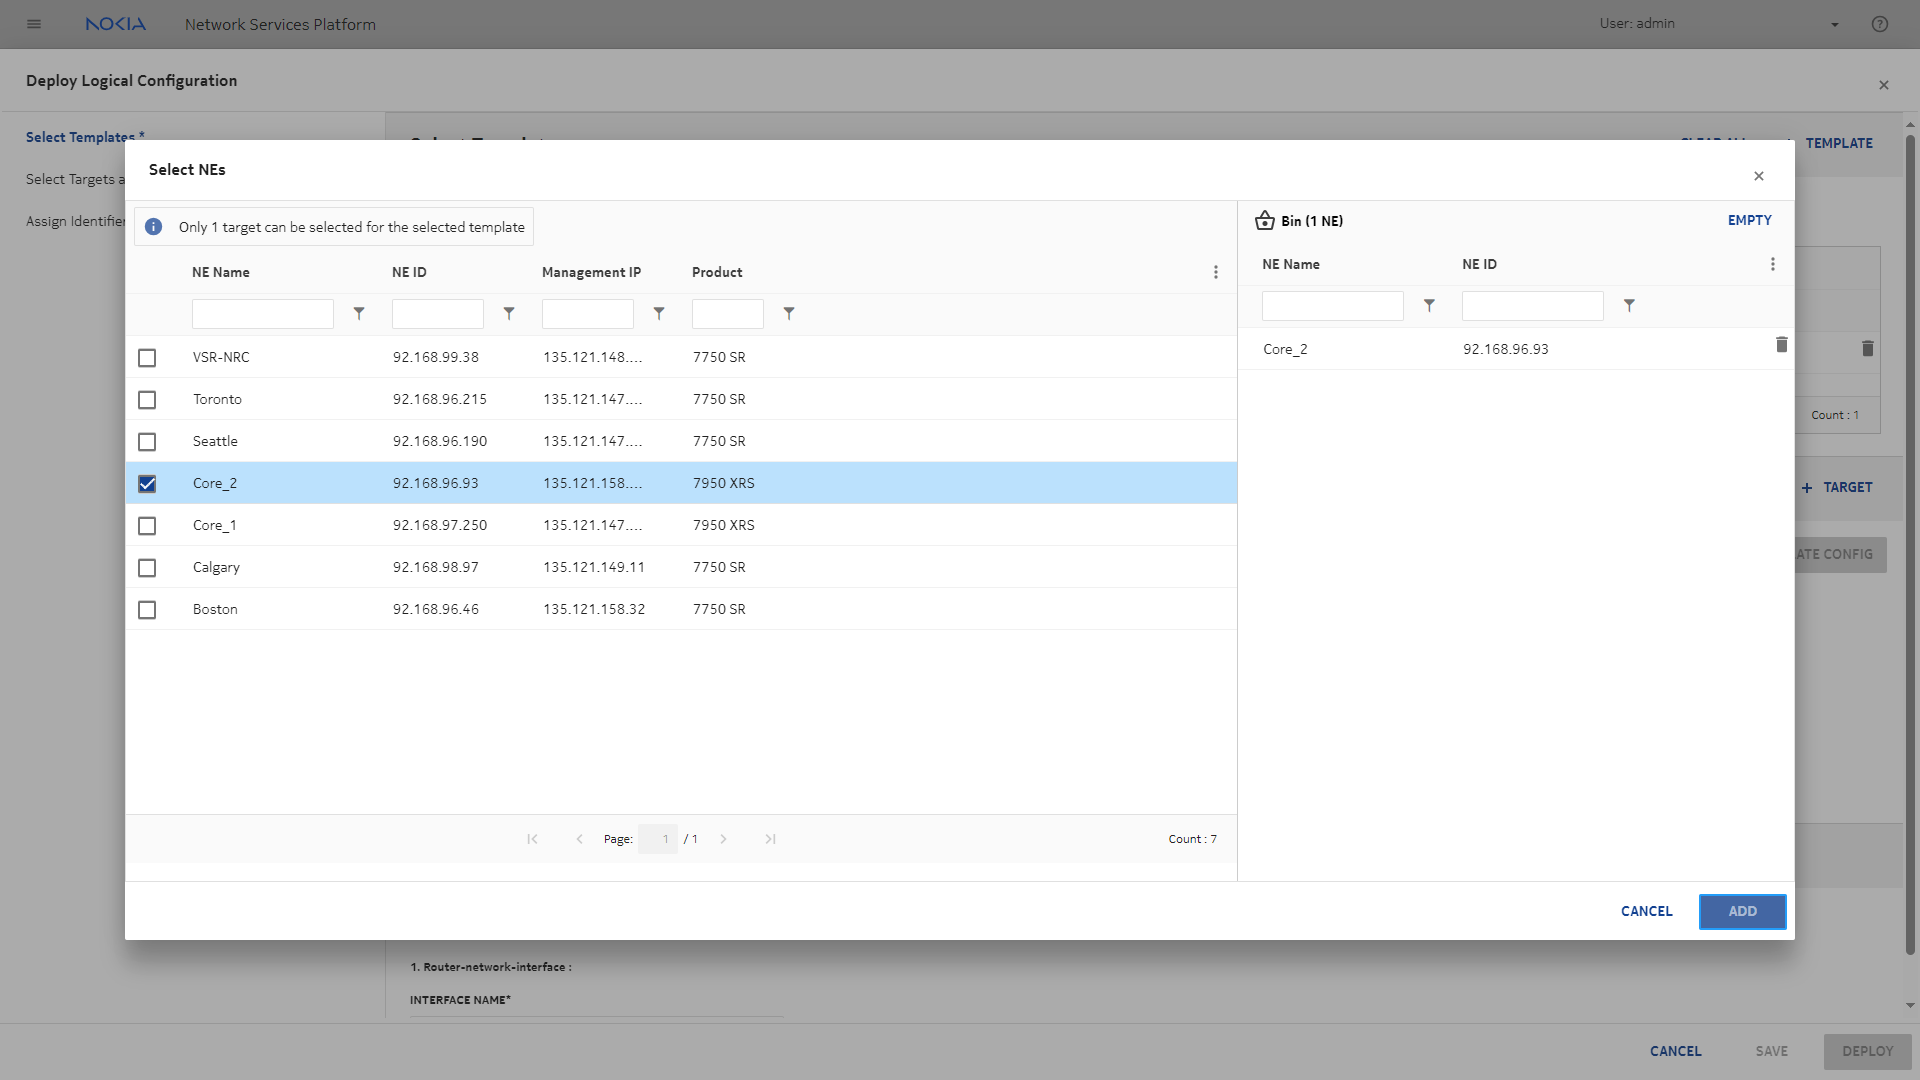
Choose a target:
-
Click TARGET and choose NEs from the drop-down list.
-
Choose an NE from the list to add it to the Bin and click ADD.
|
13 |
-
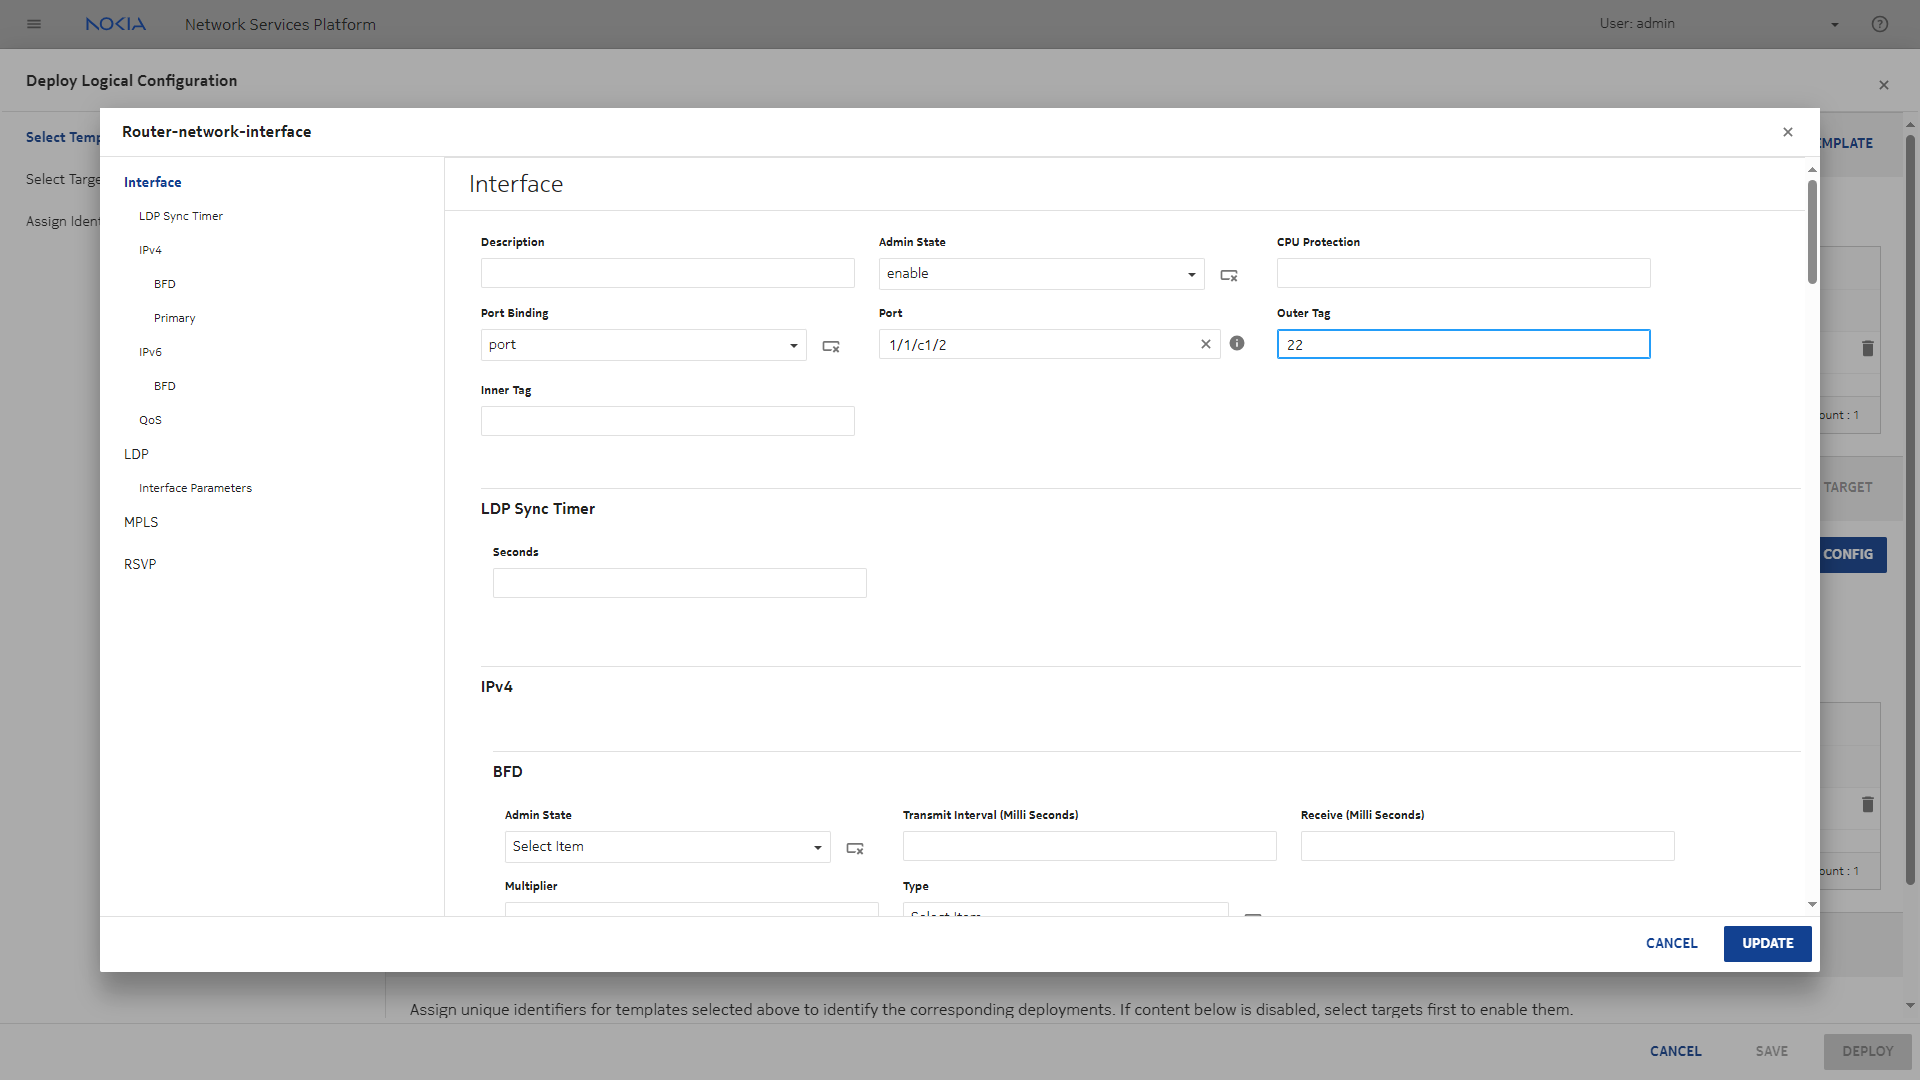
Click VIEW/EDIT TEMPLATE CONFIG. In the form that opens, configure the interface parameters. Scroll through the form to update parameters as needed.
-
Click UPDATE.
|
14 |
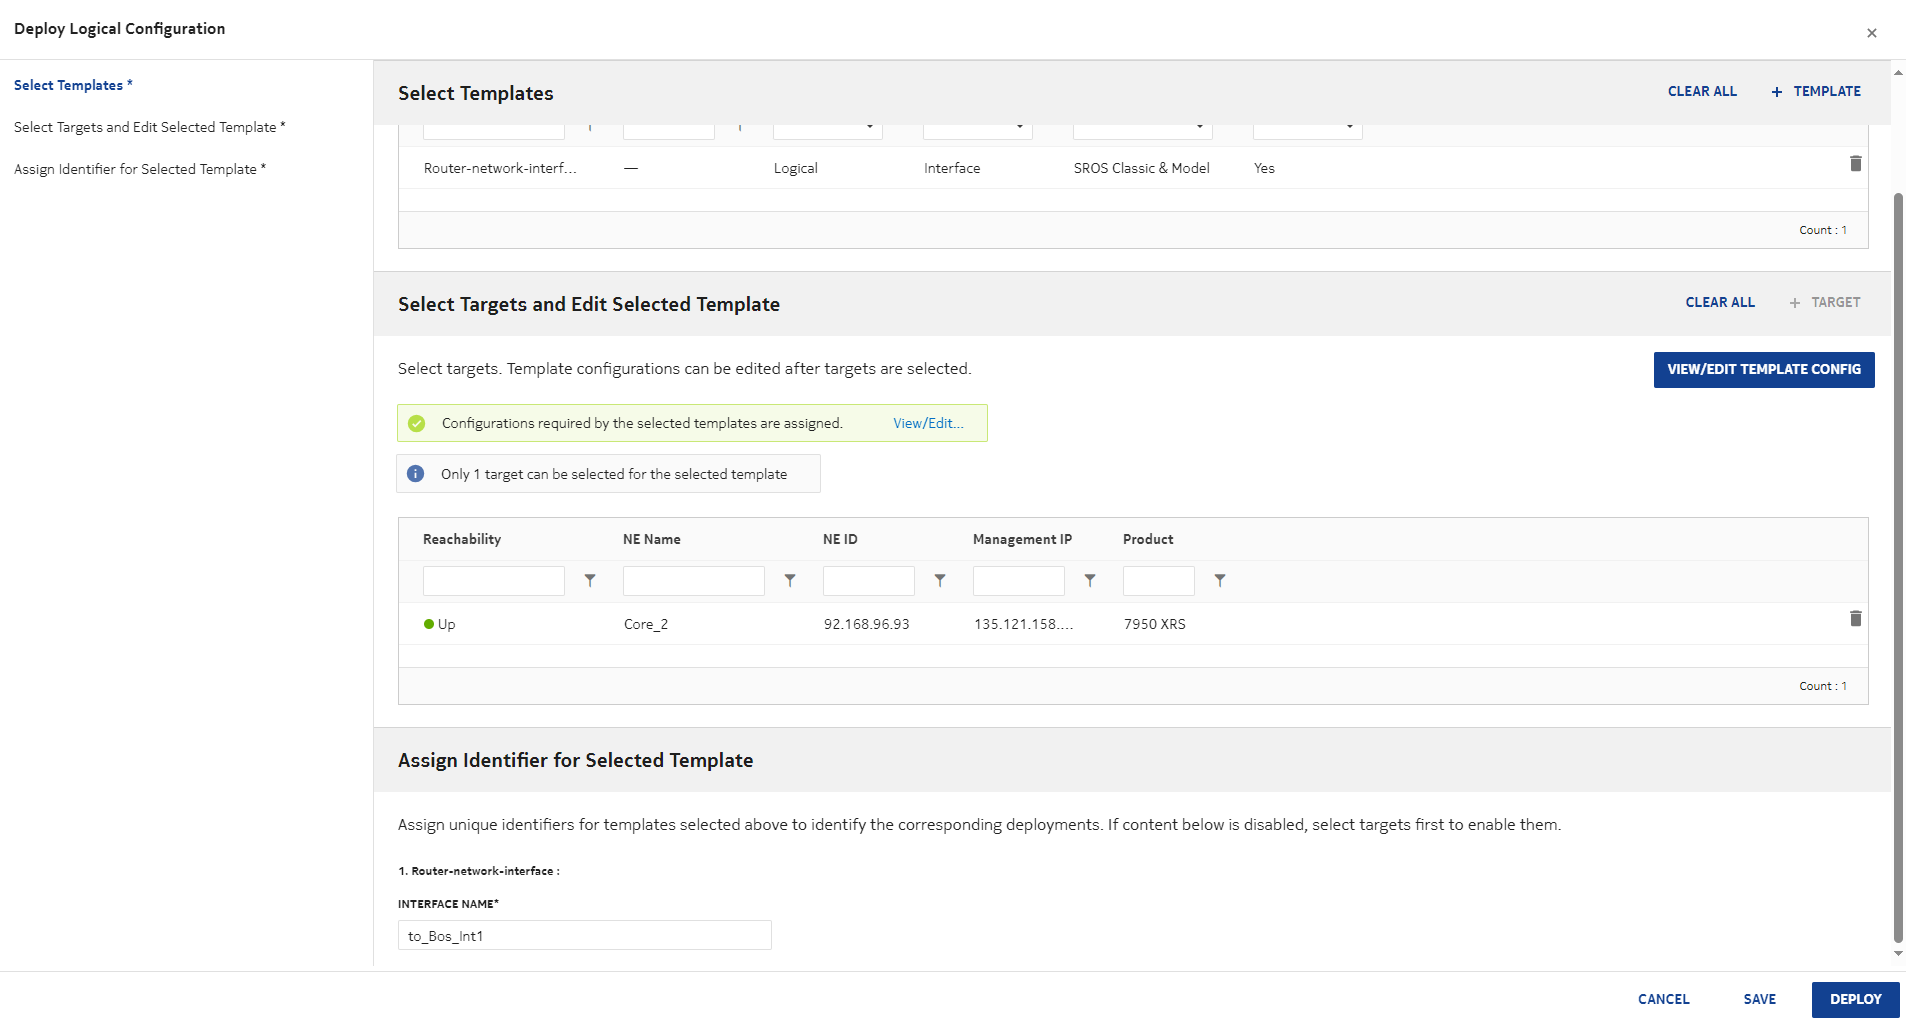
Enter a name for the interface in the INTERFACE NAME field.
|
15 |
Click DEPLOY to deploy the configuration.
|
16 |
Audit and align each deployment:
-
For each of the deployments we created, select the deployment and click AUDIT.
-
Click ALIGN to ensure that the NE configuration is aligned with the templates.
|
Back up the NE configuration
|
|
1 |
Returning to the Managed Network Elements list, we’ll take a backup of the NE.
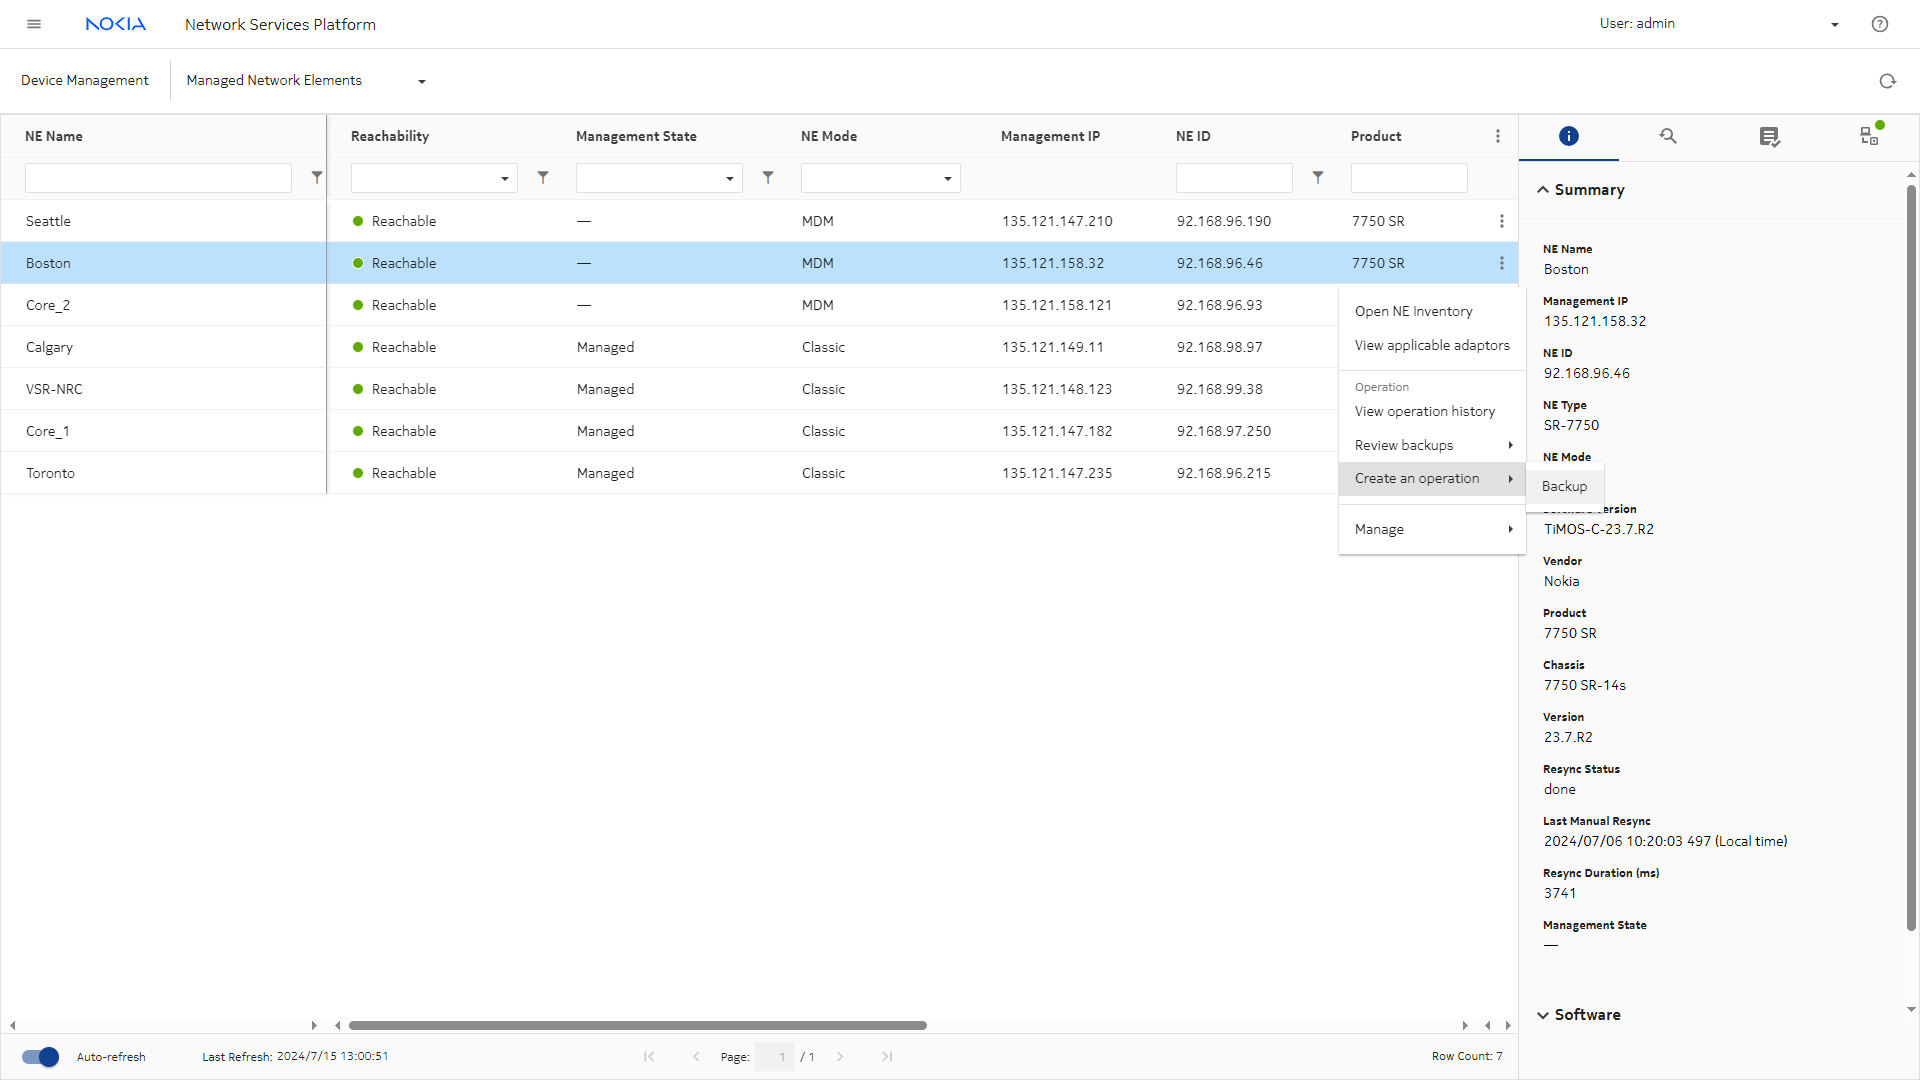
Select the NE and choose Create an operation, Backup from the table row actions menu ().
|
2 |
We can check the status of the backup by clicking (Table row actions), Review backups, View all backup files to view the list of completed backups.
|
Verify the NE inventory post configuration
|
|
1 |
Return to the list of devices in Device Management, Managed Network Elements.
|
2 |
Select the NE and choose Open in NE Inventory from the table row actions menu ().
|
3 |
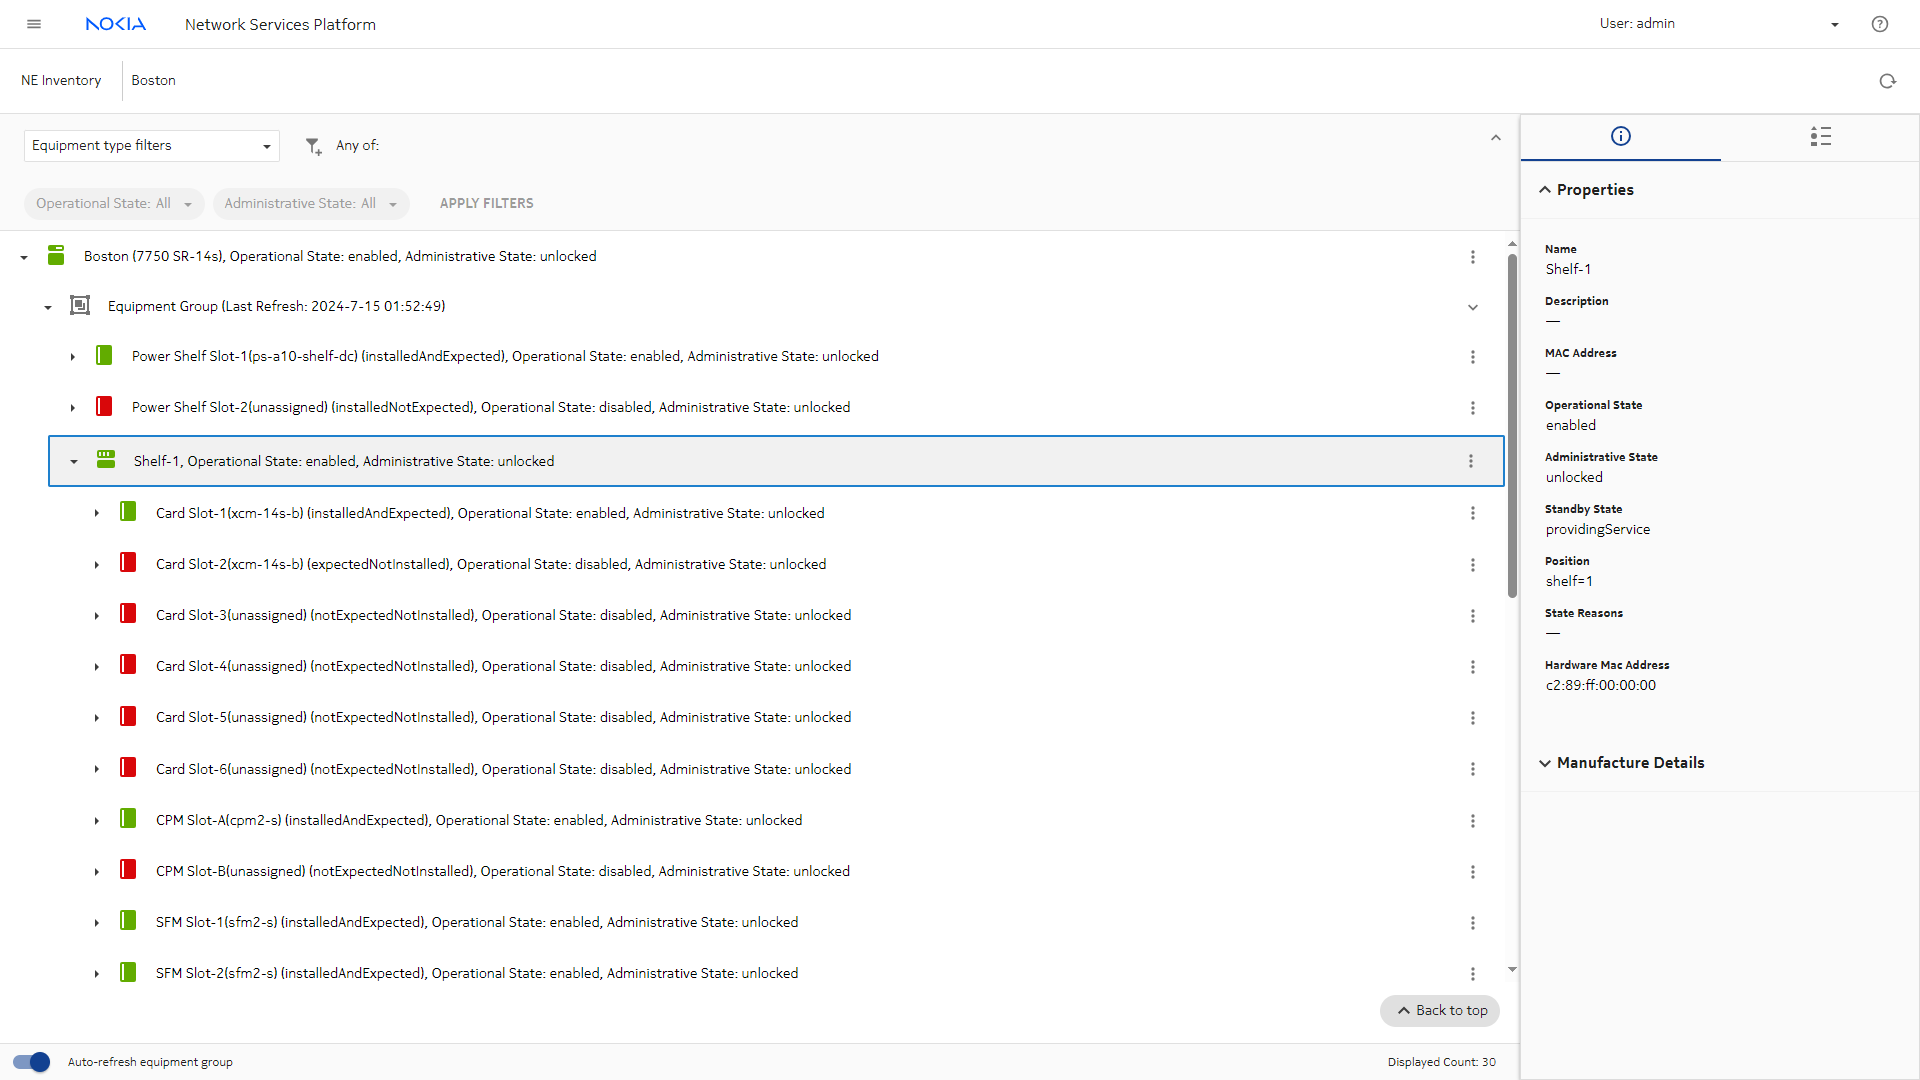
The NE inventory tree view opens in a new browser tab, displaying the components that are configured.
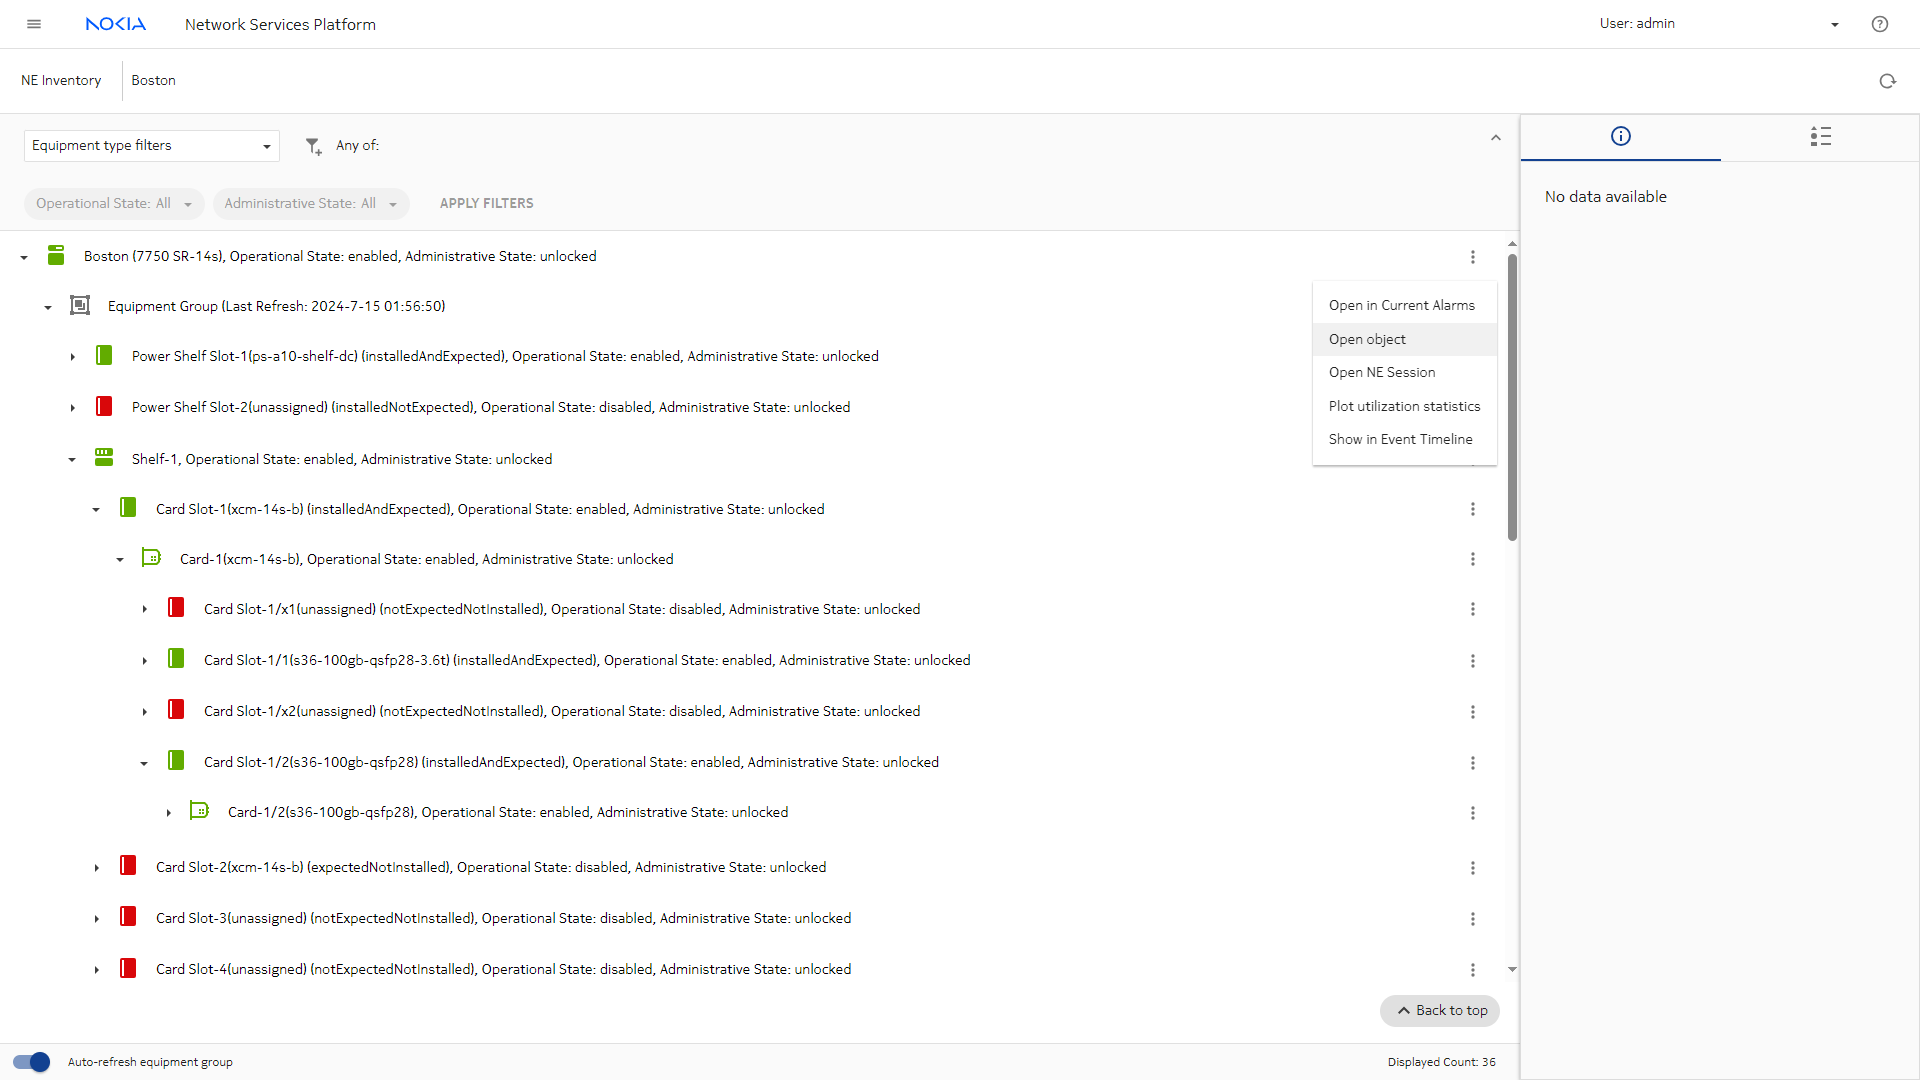
Expand the Equipment group to show the status of the shelves, slots, and cards.
|
4 |
We can also verify configuration details in Modeled Device Configurator.
From the top of the inventory tree, select Open object from the More menu ().
|
5 |
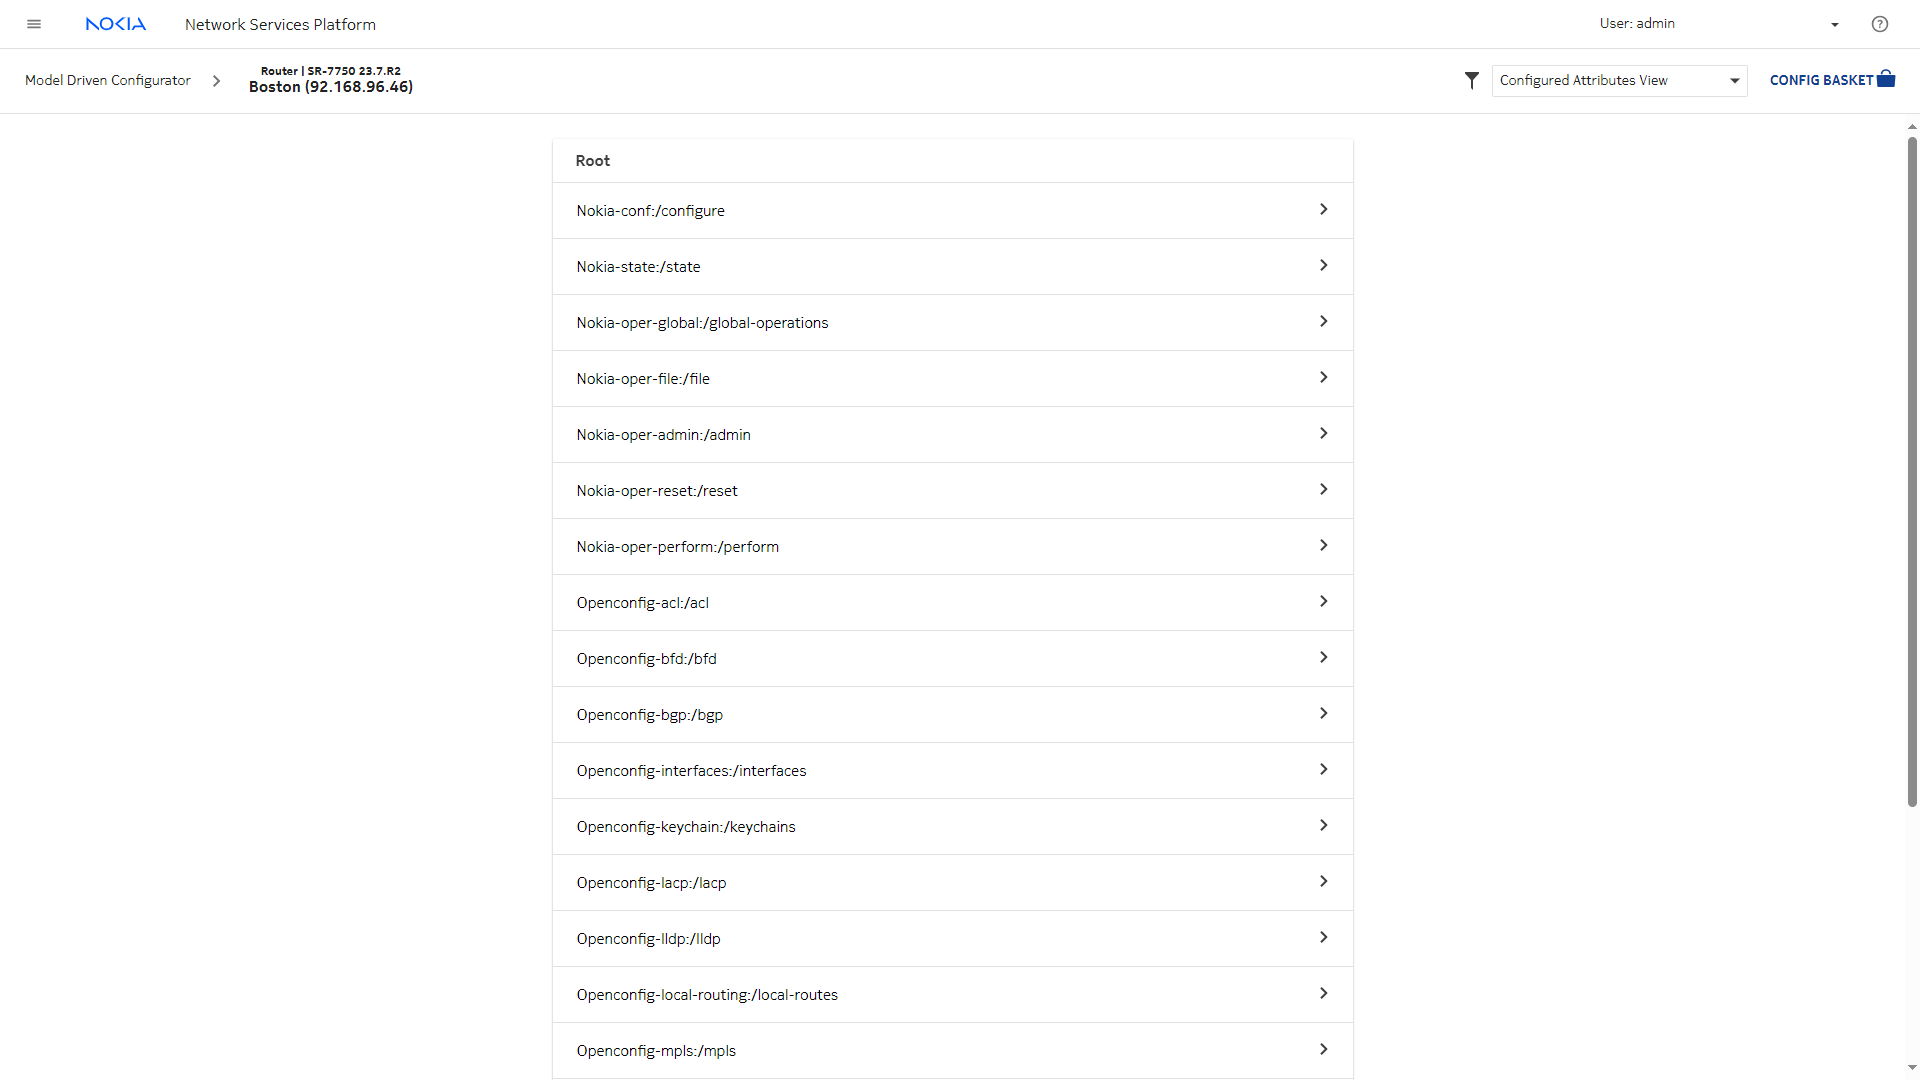
Modeled Device Configurator opens in a new tab, showing the configuration and state trees for the NE.
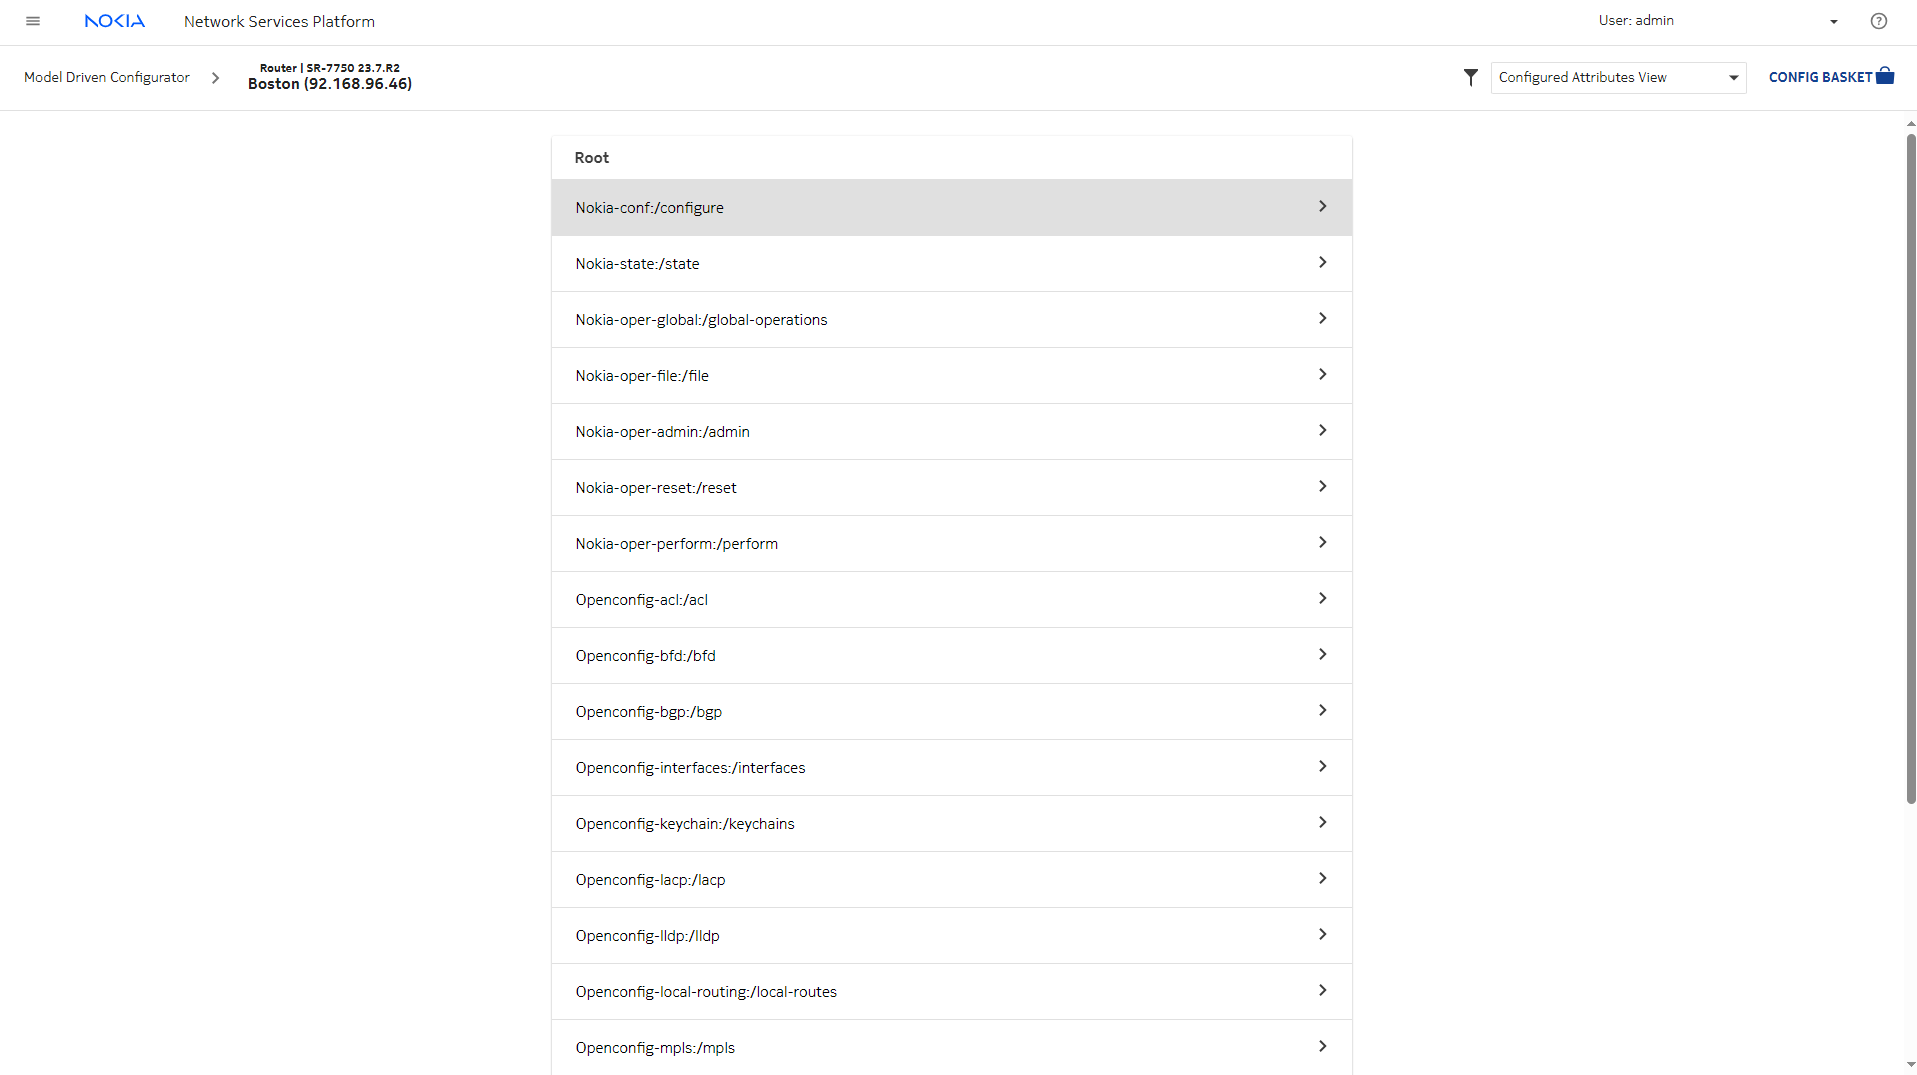
Click the Nokia-conf:/configure row to open the configuration tree.
|
6 |
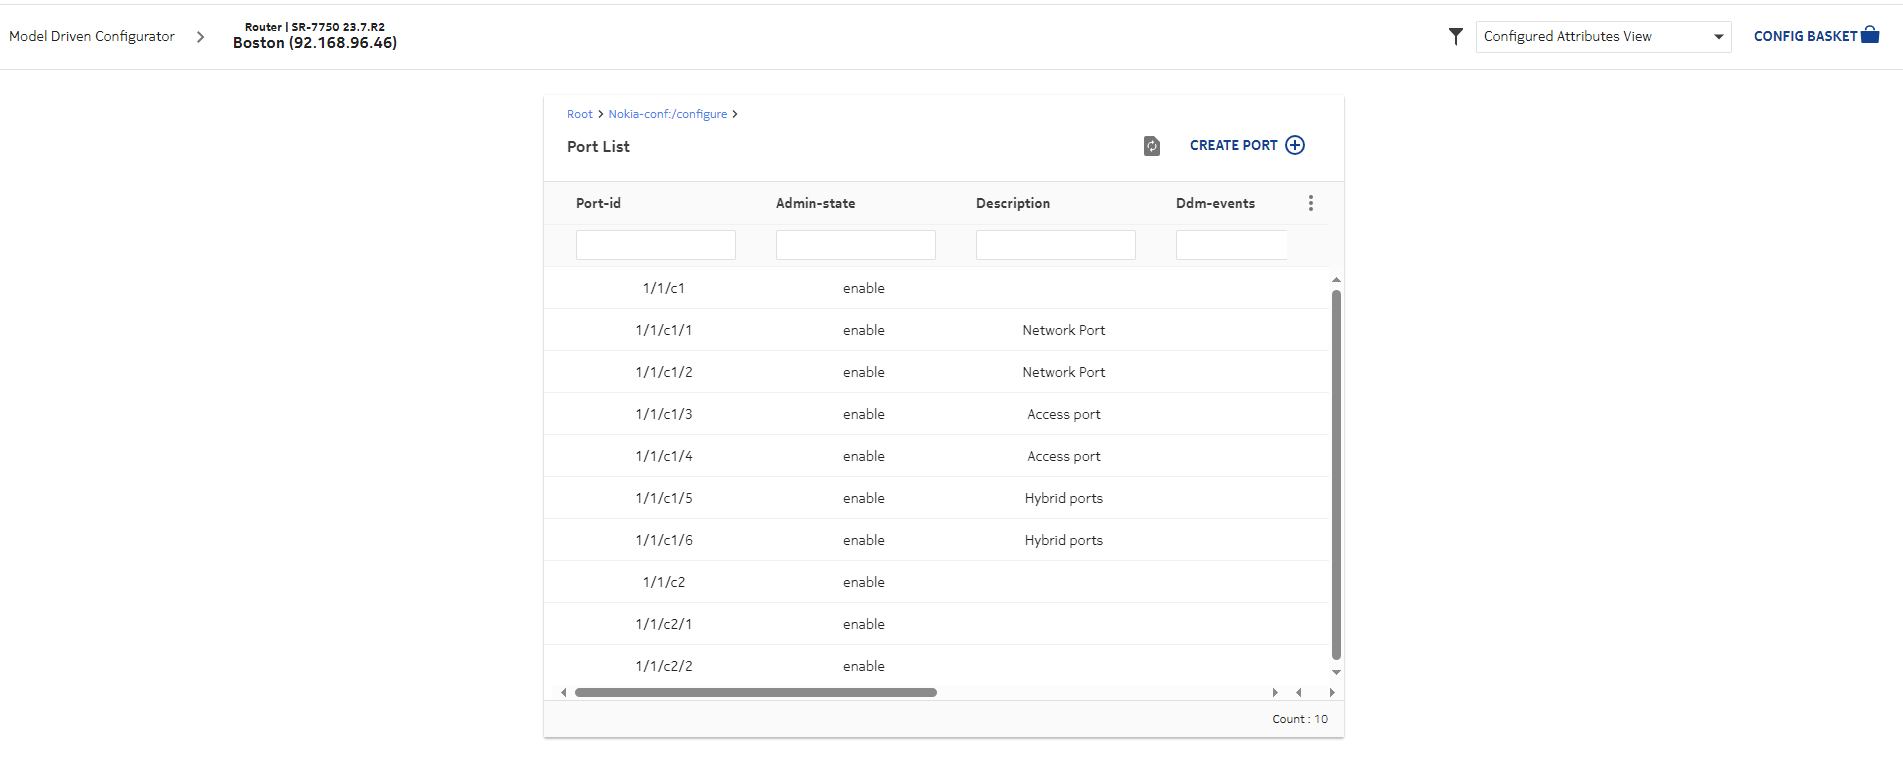
Scroll down to see information about the objects we configured.
For example, we’ll click Port List to see the configured ports.
|
7 |
We can also verify our logical configurations from the NE Inventory tab.
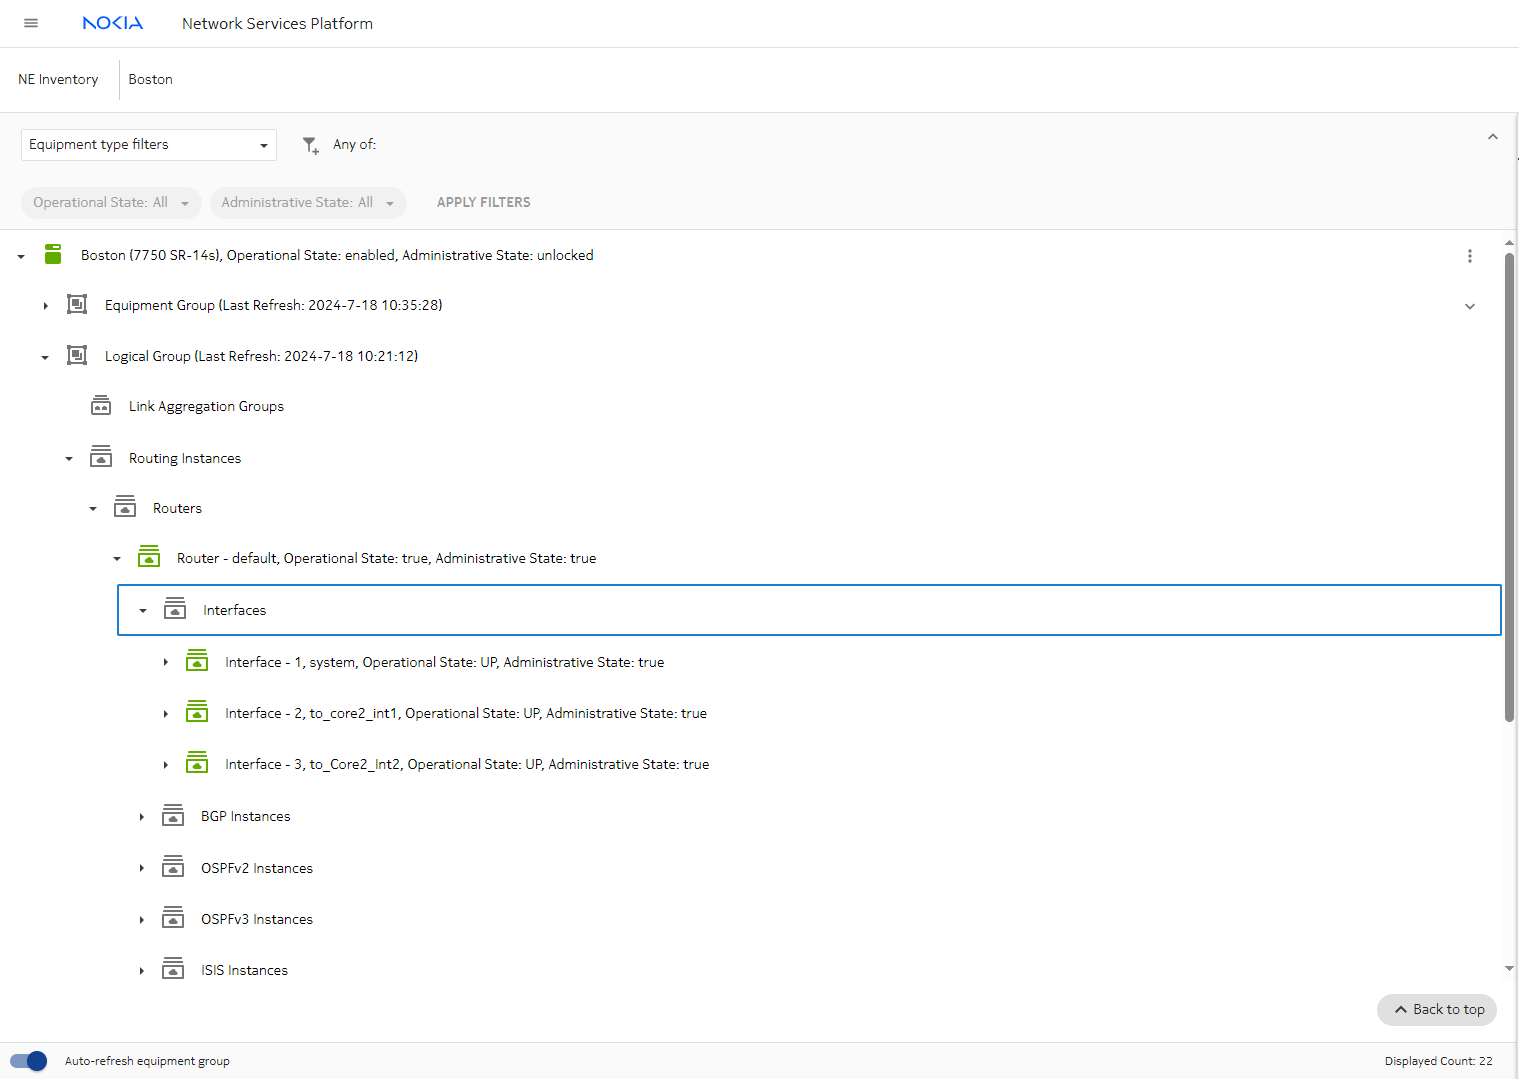
Return to the NE Inventory tab and expand the Logical Group. To see interfaces, expand, Routers and Interfaces. Green icons show normal operation.
|
View the NE in the Network Health dashboard
|
|
1 |
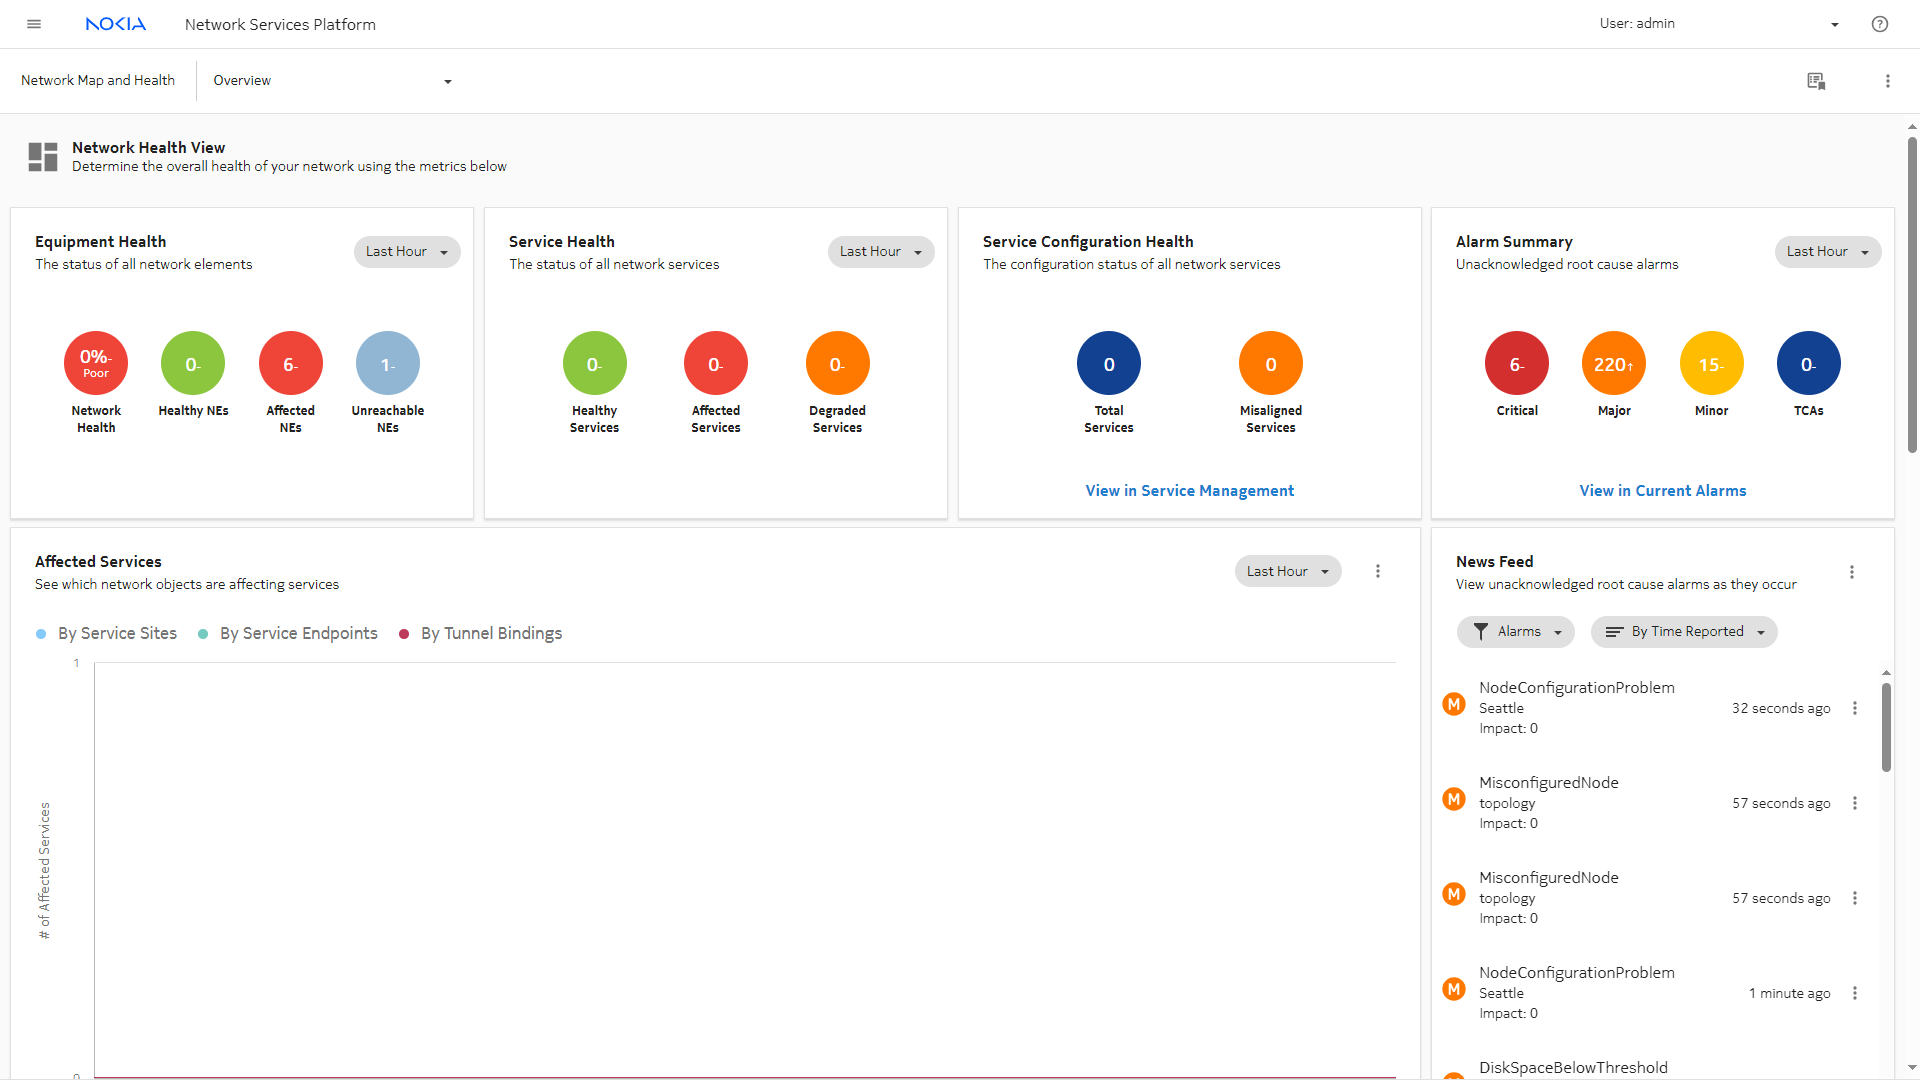
The Network Health dashboard is the home screen of the NSP. It provides a quick view of essential information relating to the function of your network and its components.
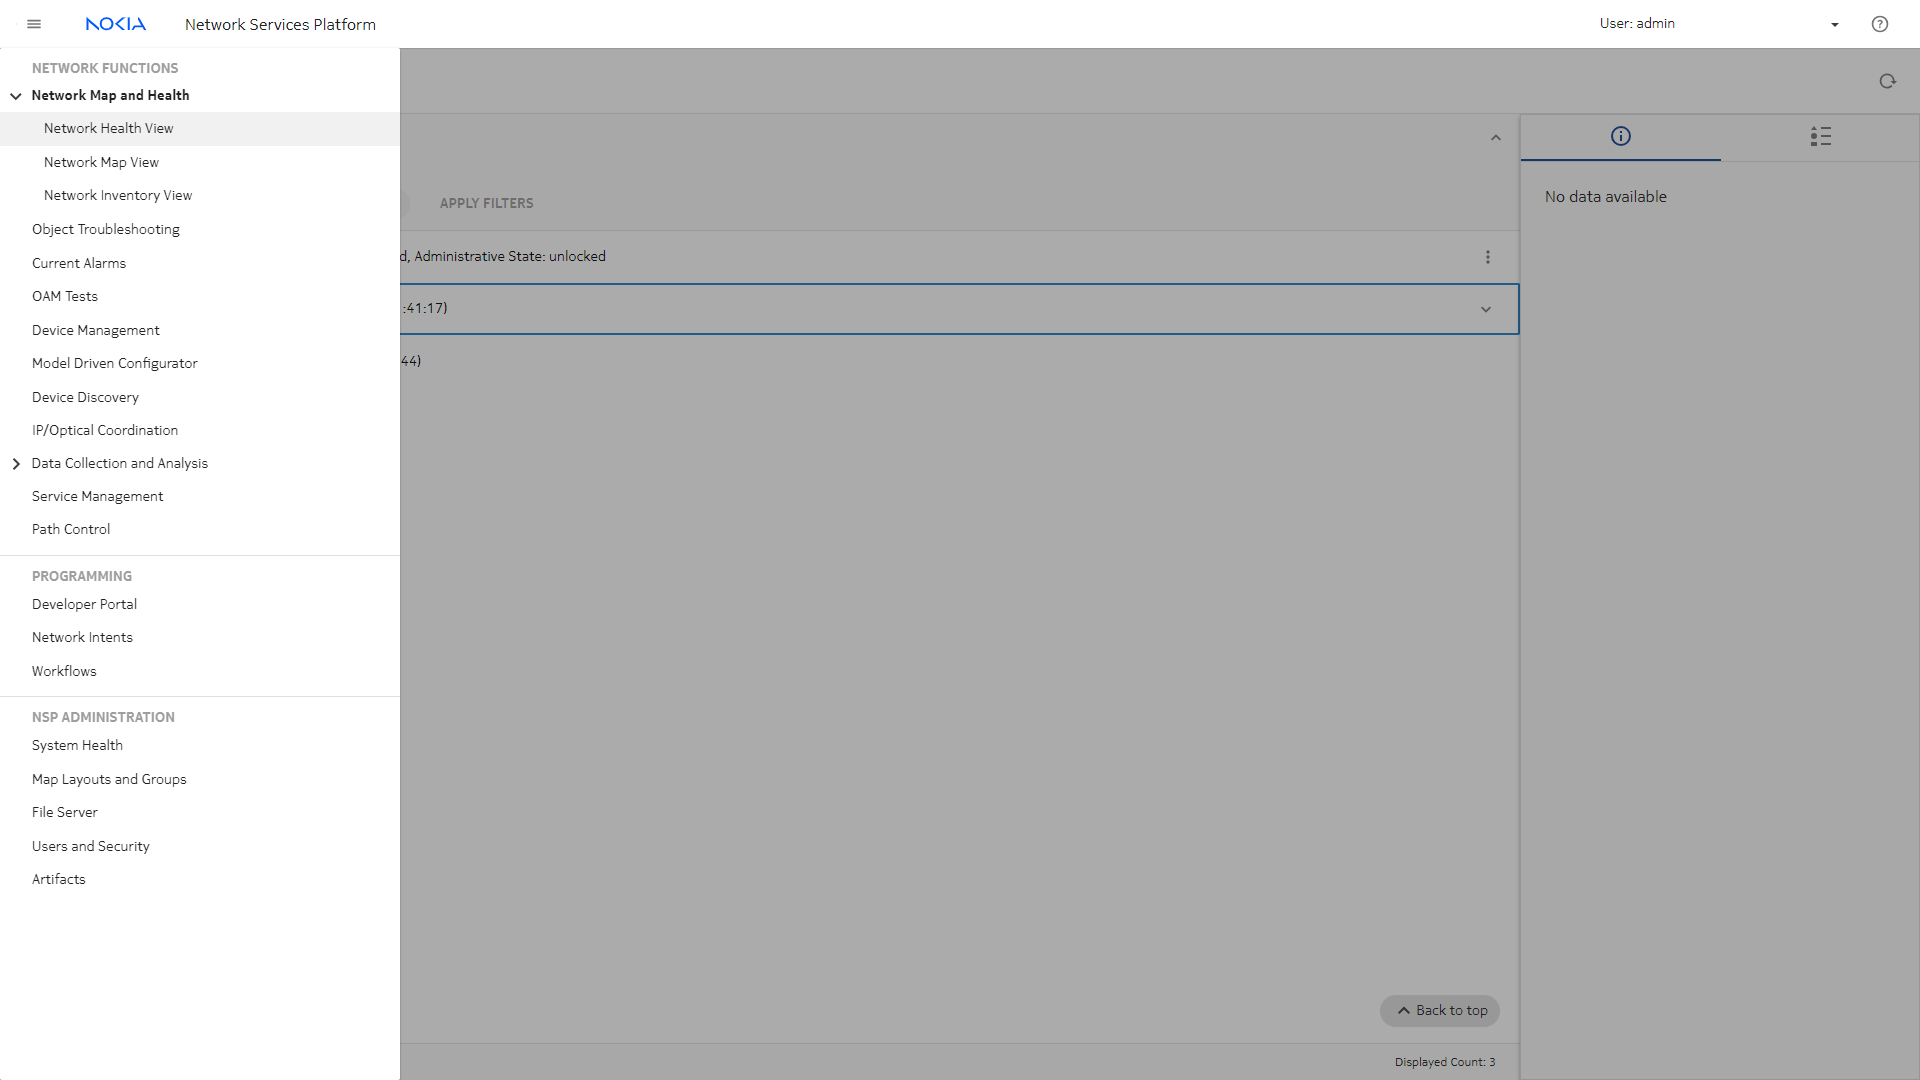
Choose Network Health View from the NSP main menu to open the dashboard.
The Equipment Health dashlet shows that six affected NEs are present in the network.
|
2 |
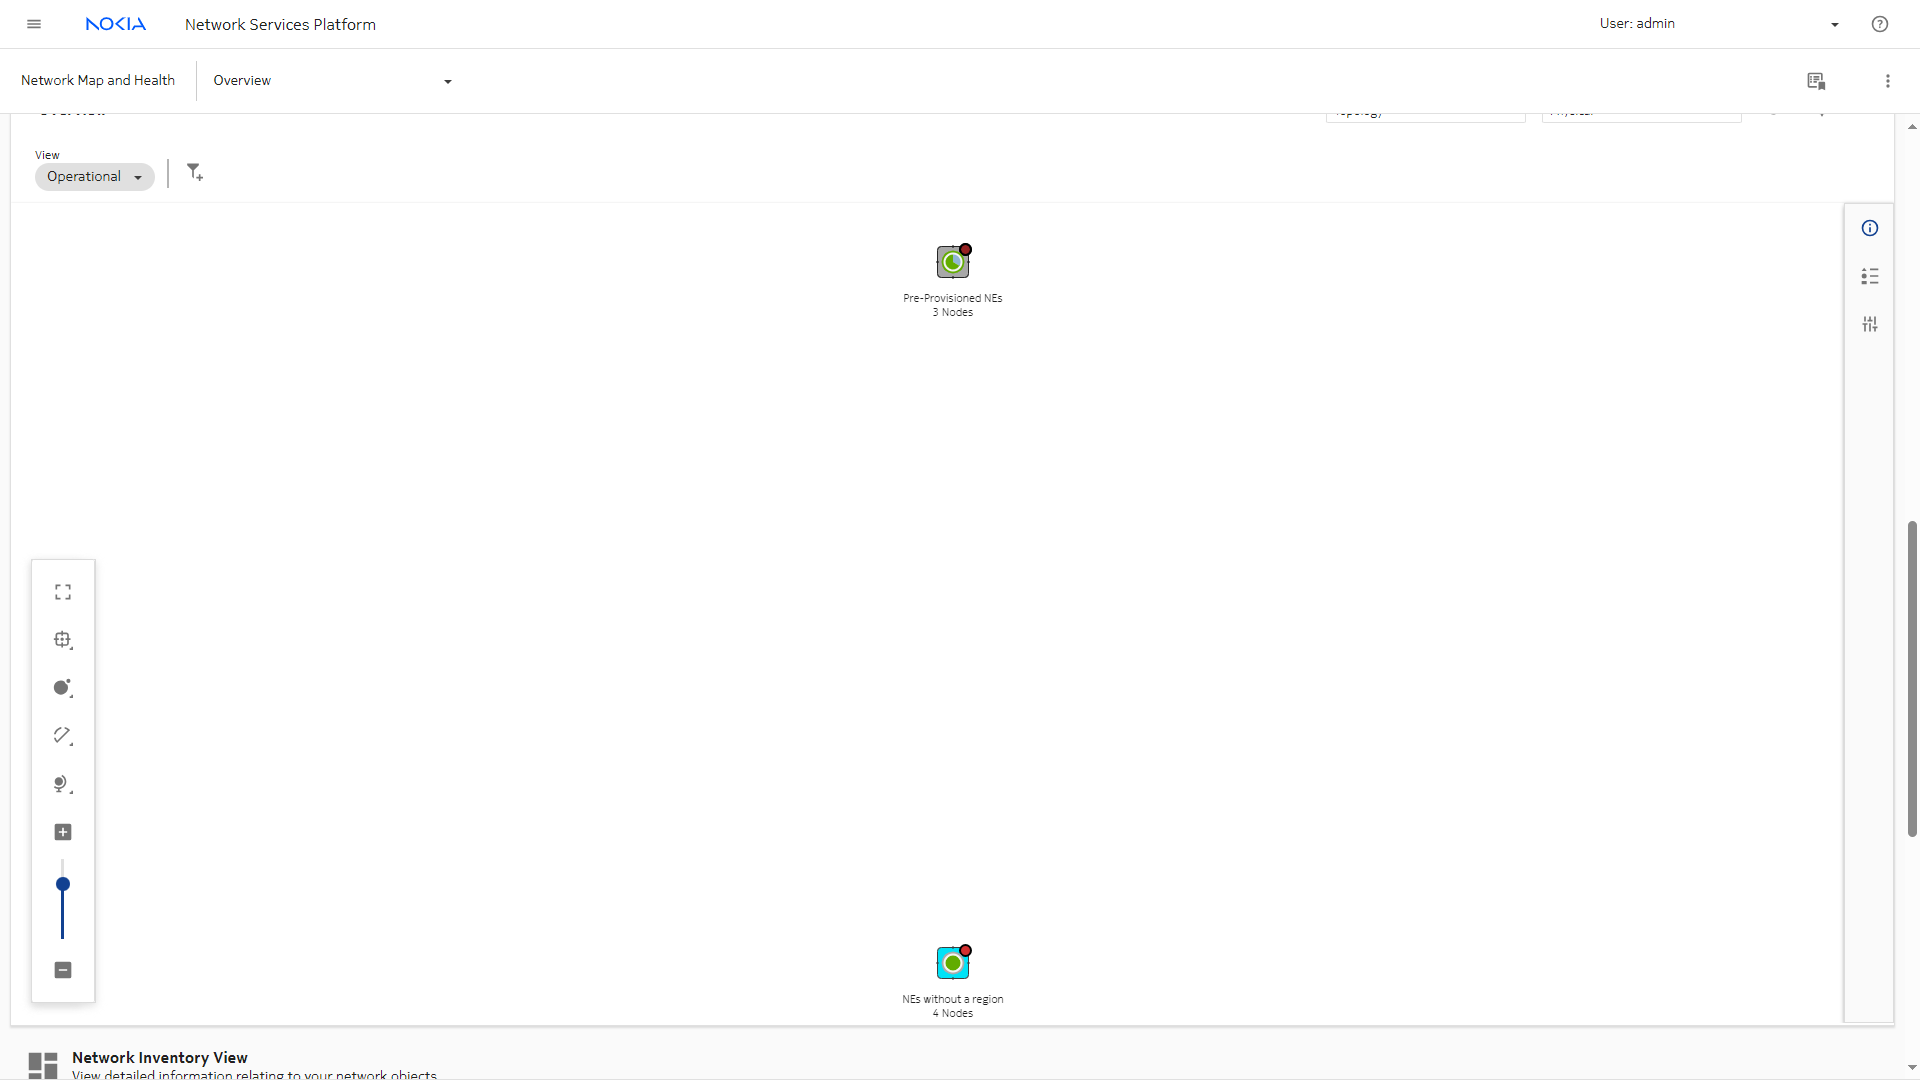
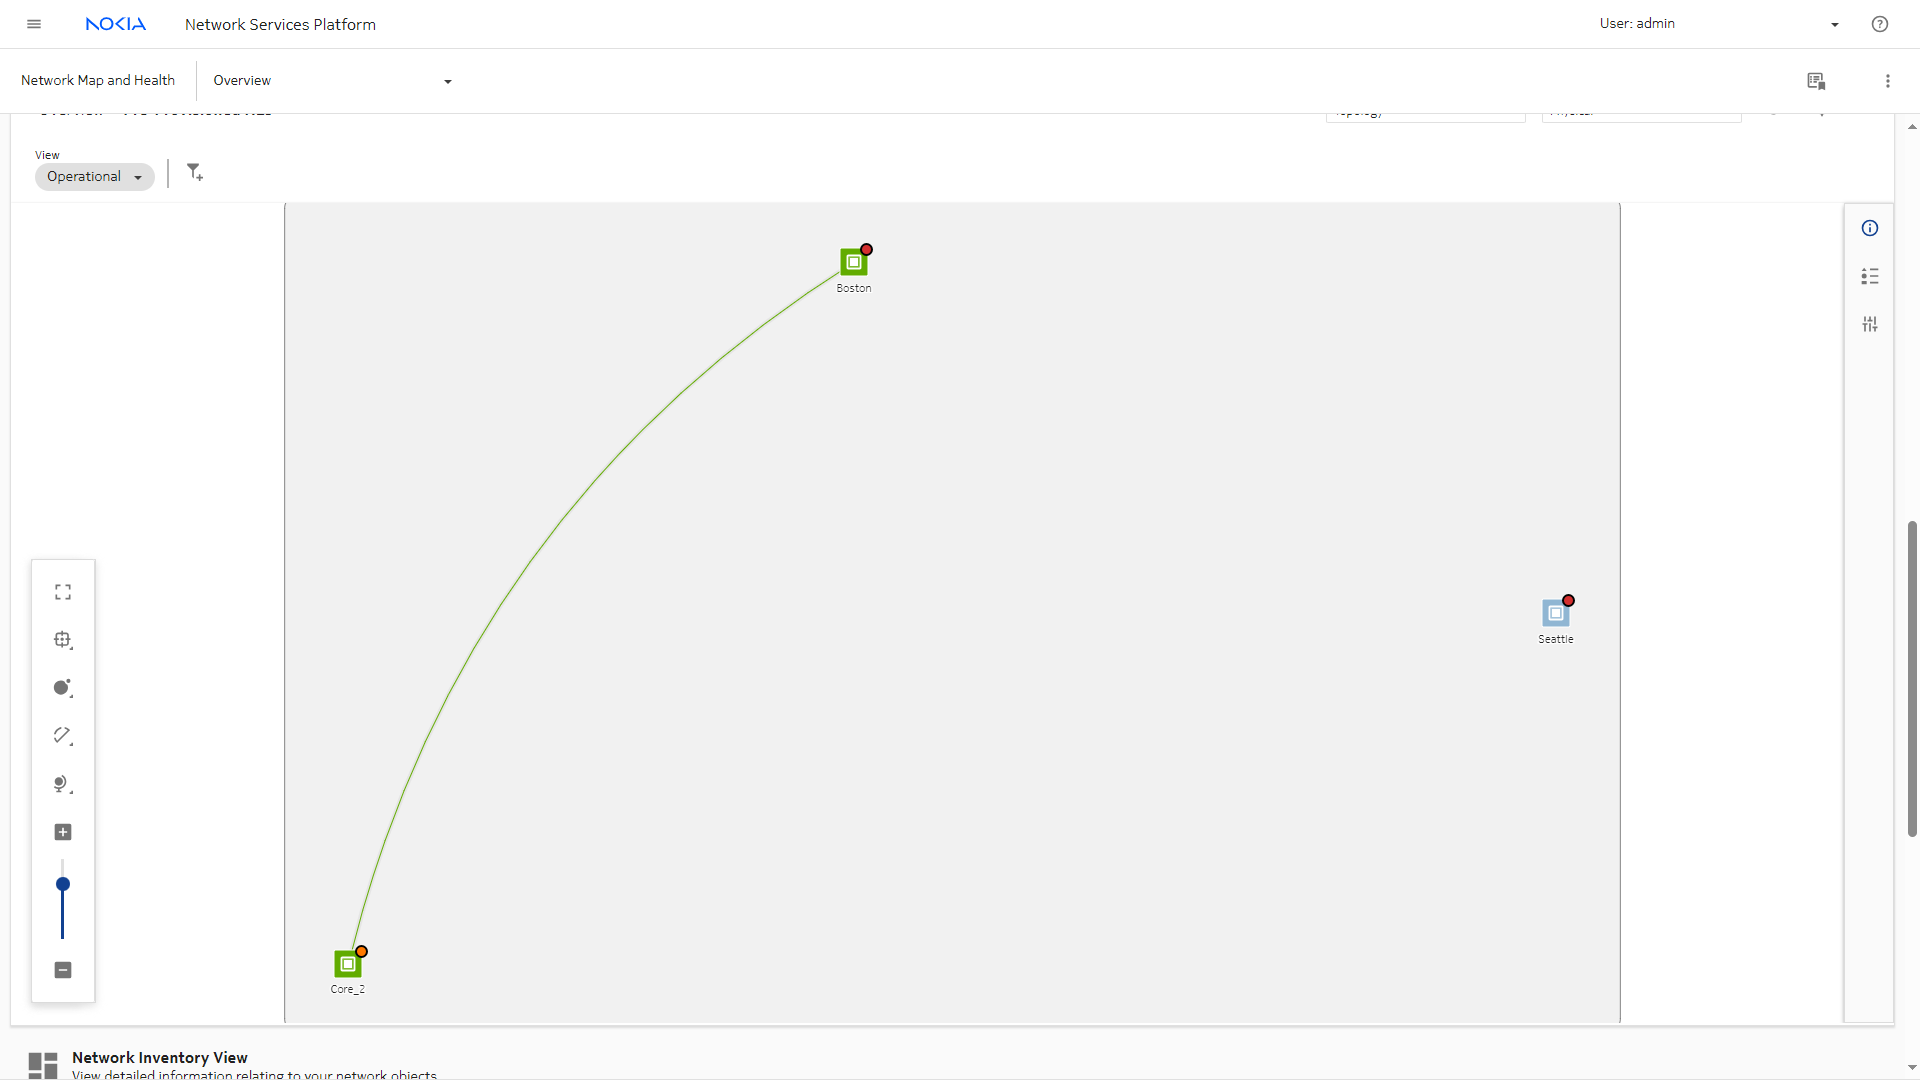
Scroll down to see the Map View. Double-click on Pre-Provisioned NEs to show our NE, with the link that we created by configuring the router interface.
|
3 |
Scroll further down to see further information provided by the dashlets.
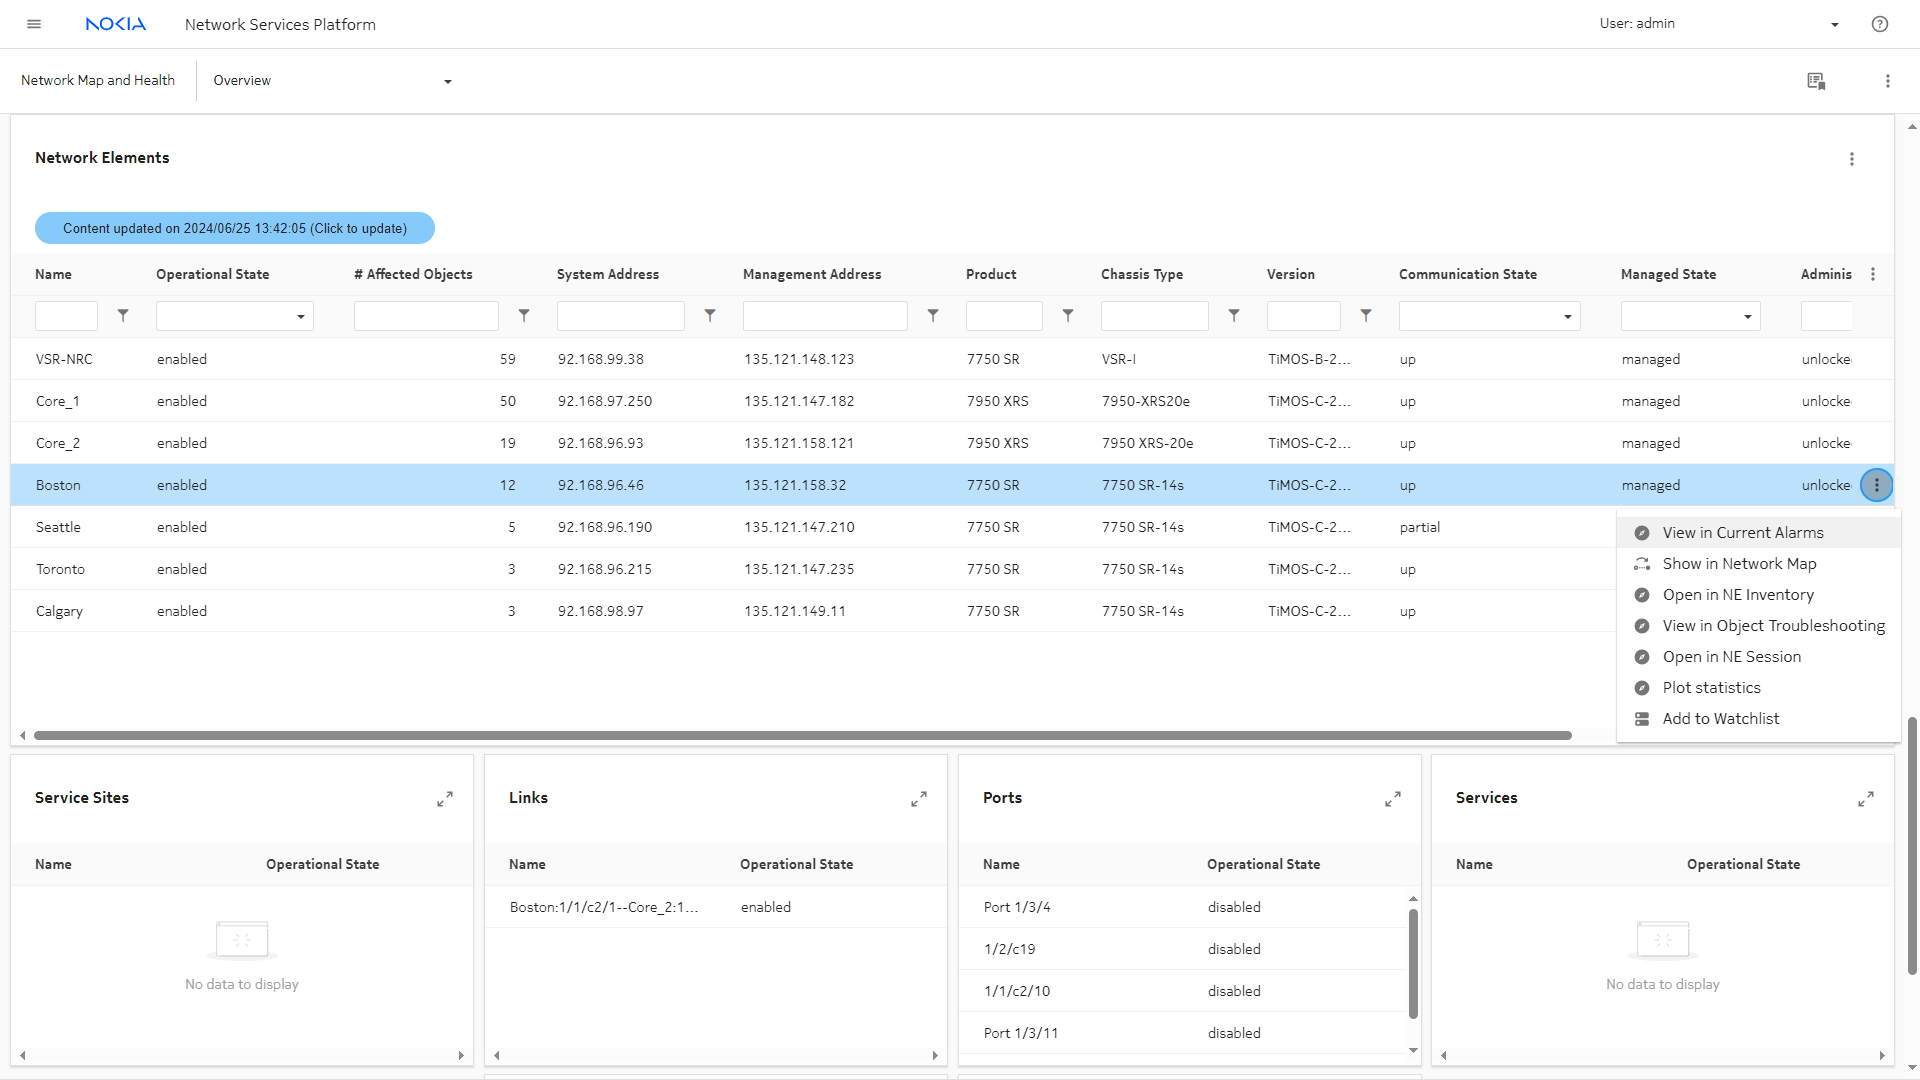
Expand the Network Elements dashlet to see the list of NEs. The Table row actions menu shows options. We’ll choose Open in Current Alarms.
|
4 |
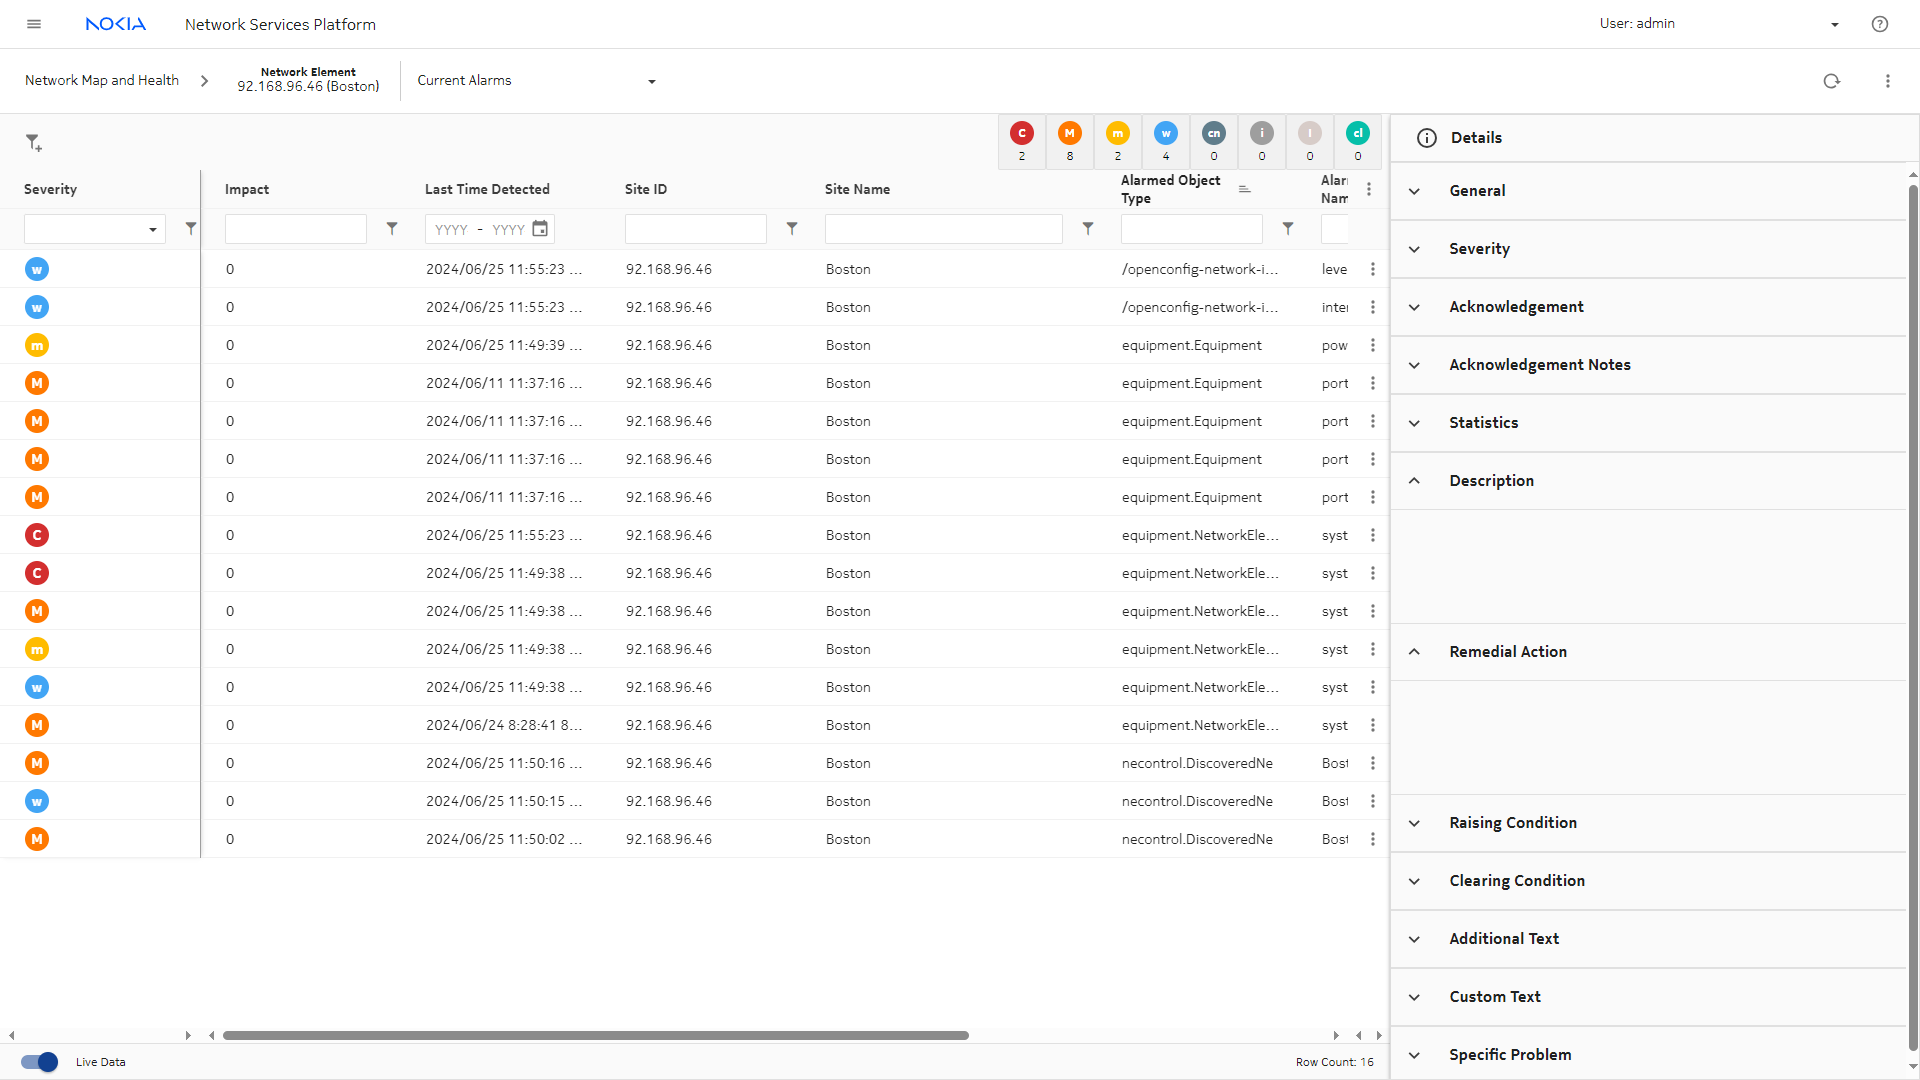
The Current Alarms view opens, filtered to show the alarms on the NE of interest. We can further filter the list if needed.
|
5 |
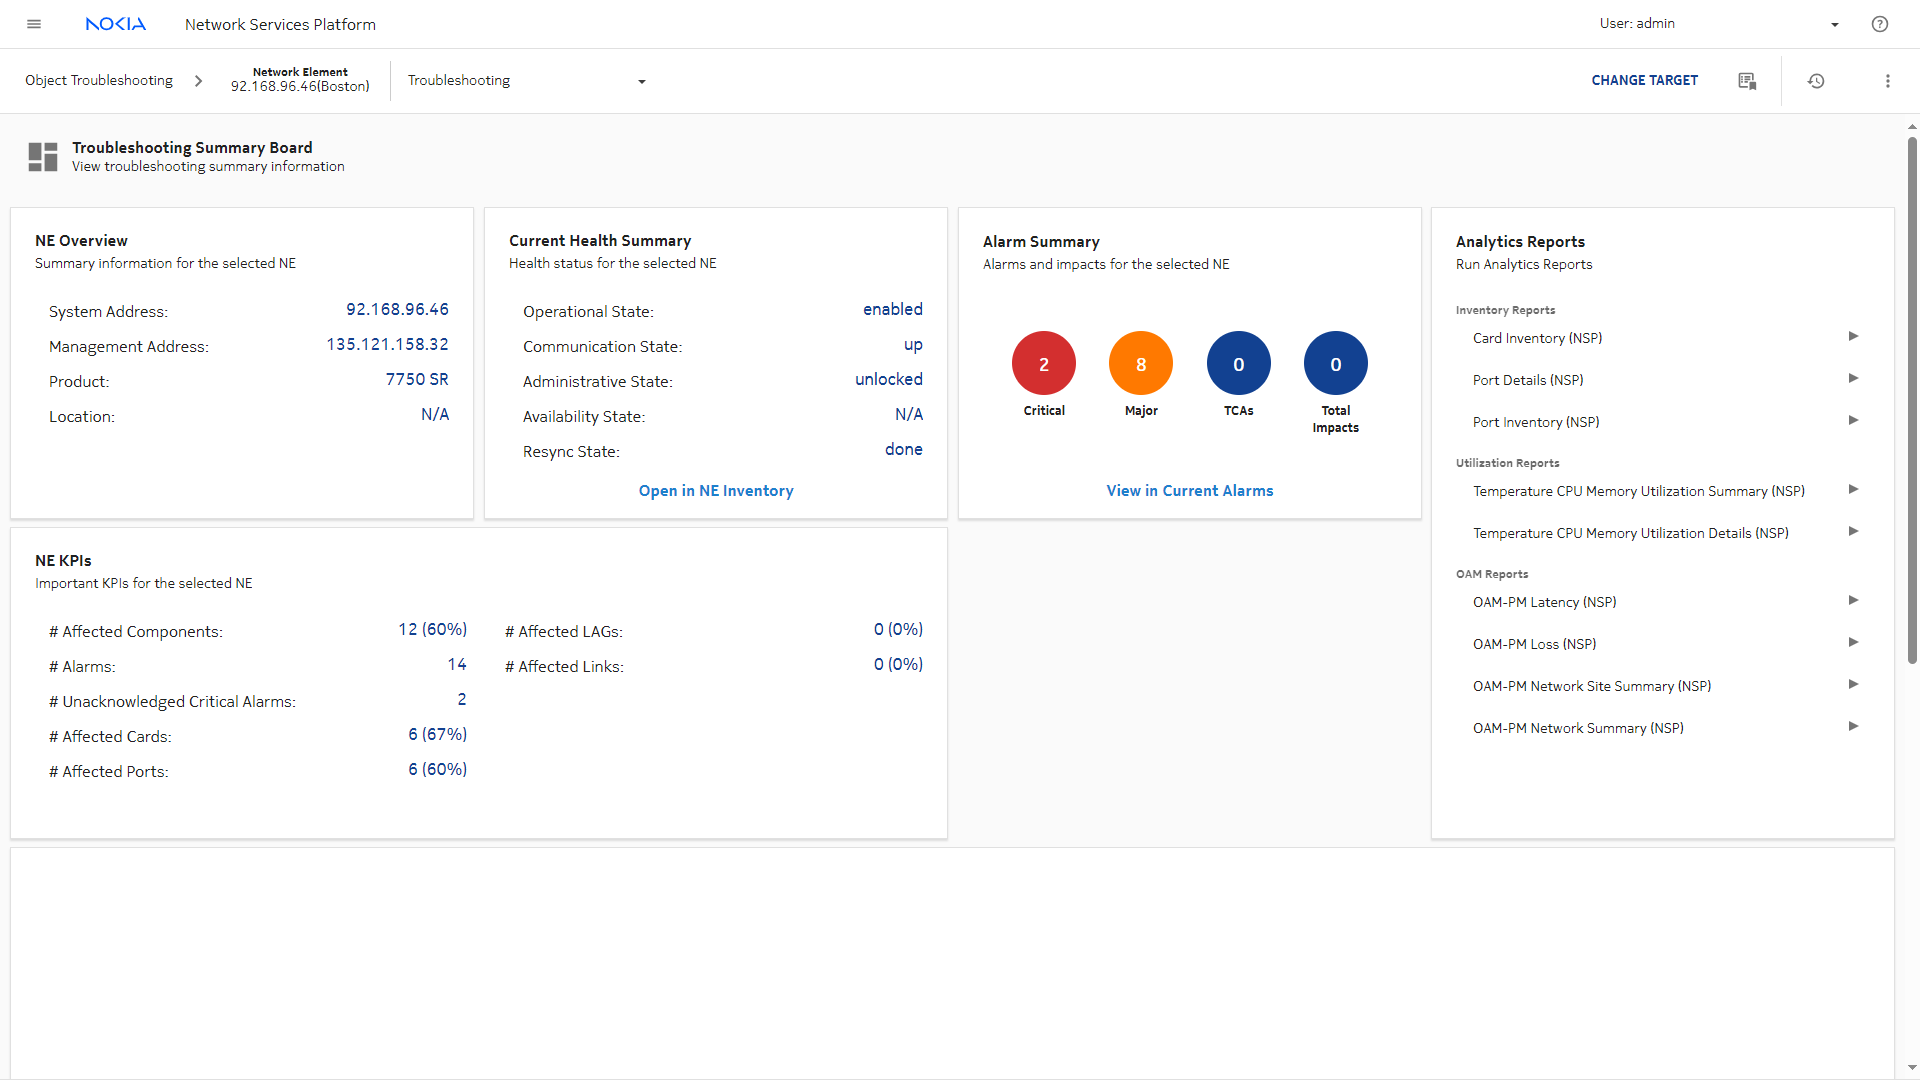
Returning to the Network Elements dashlet, we can also view the NE in the Object Troubleshooting dashboard. The Object Troubleshooting dashboard provides specific performance information about the selected NE.
|
6 |
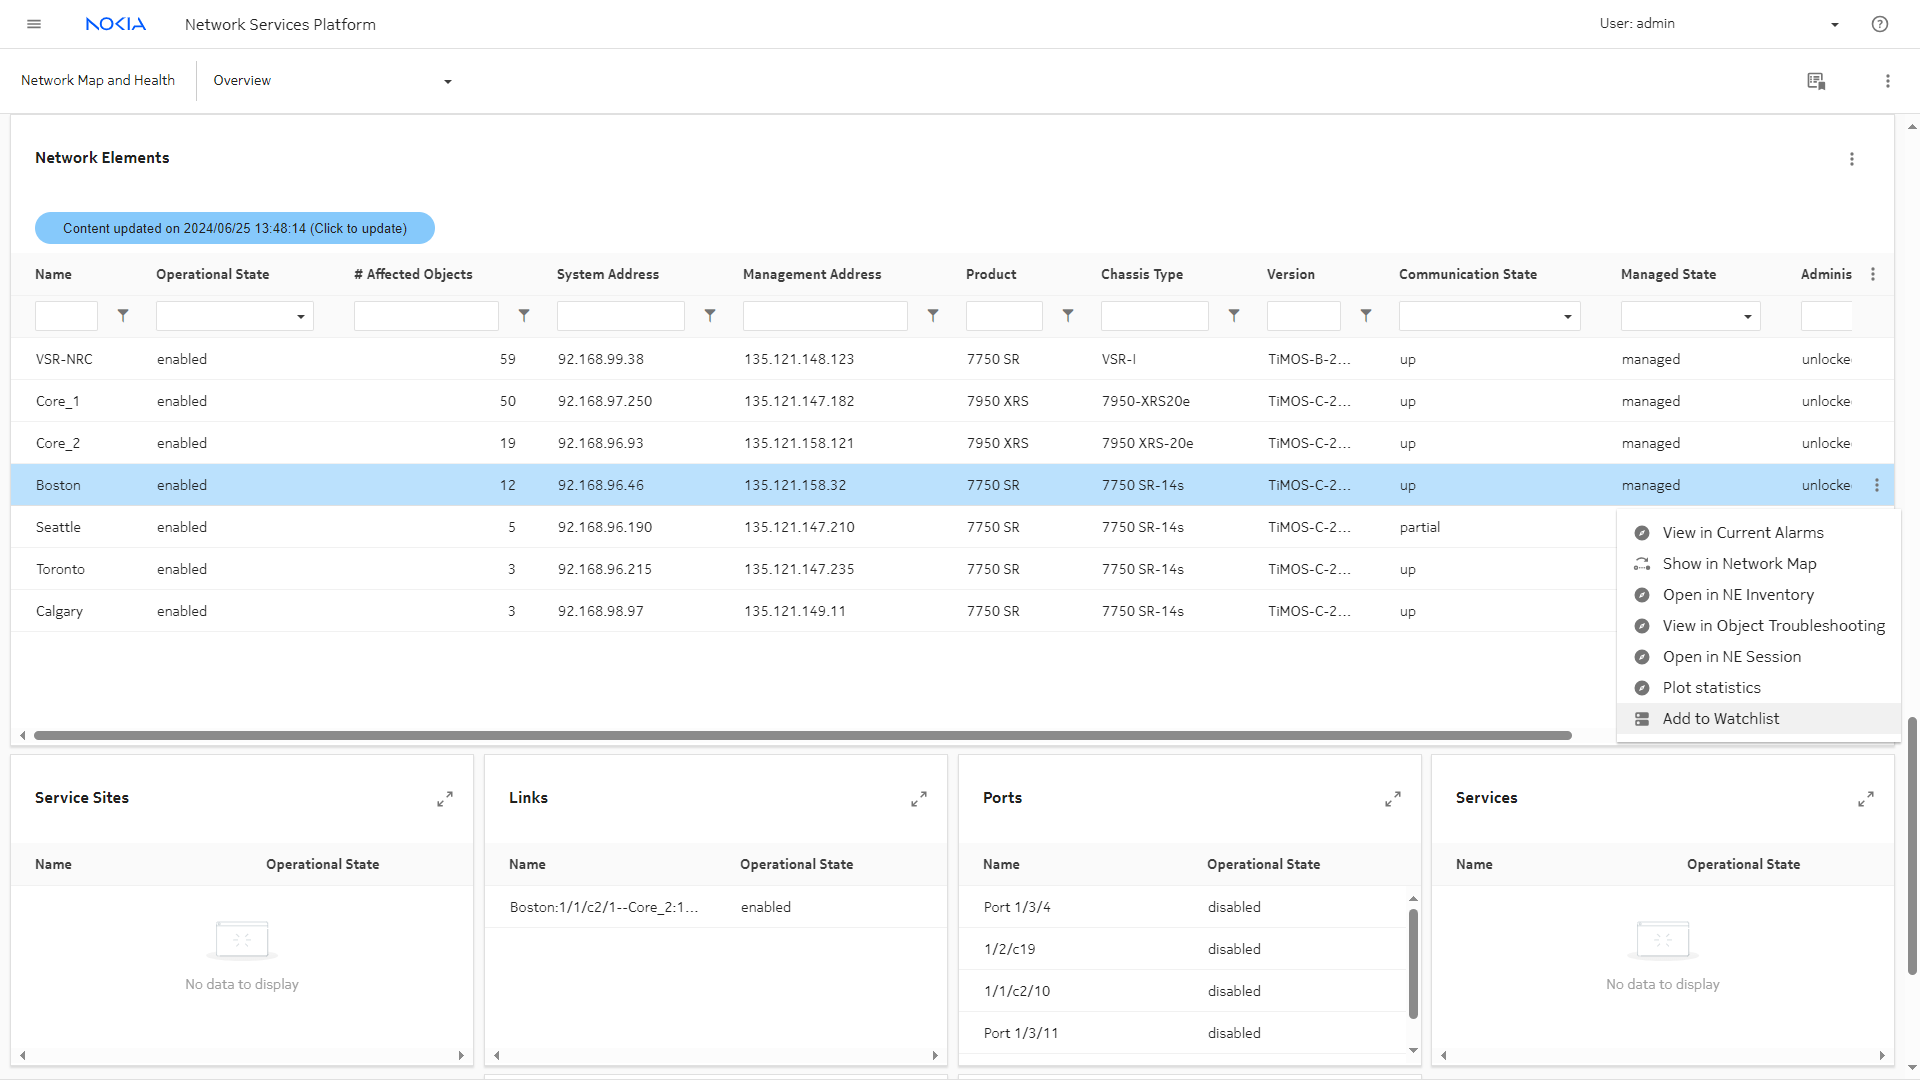
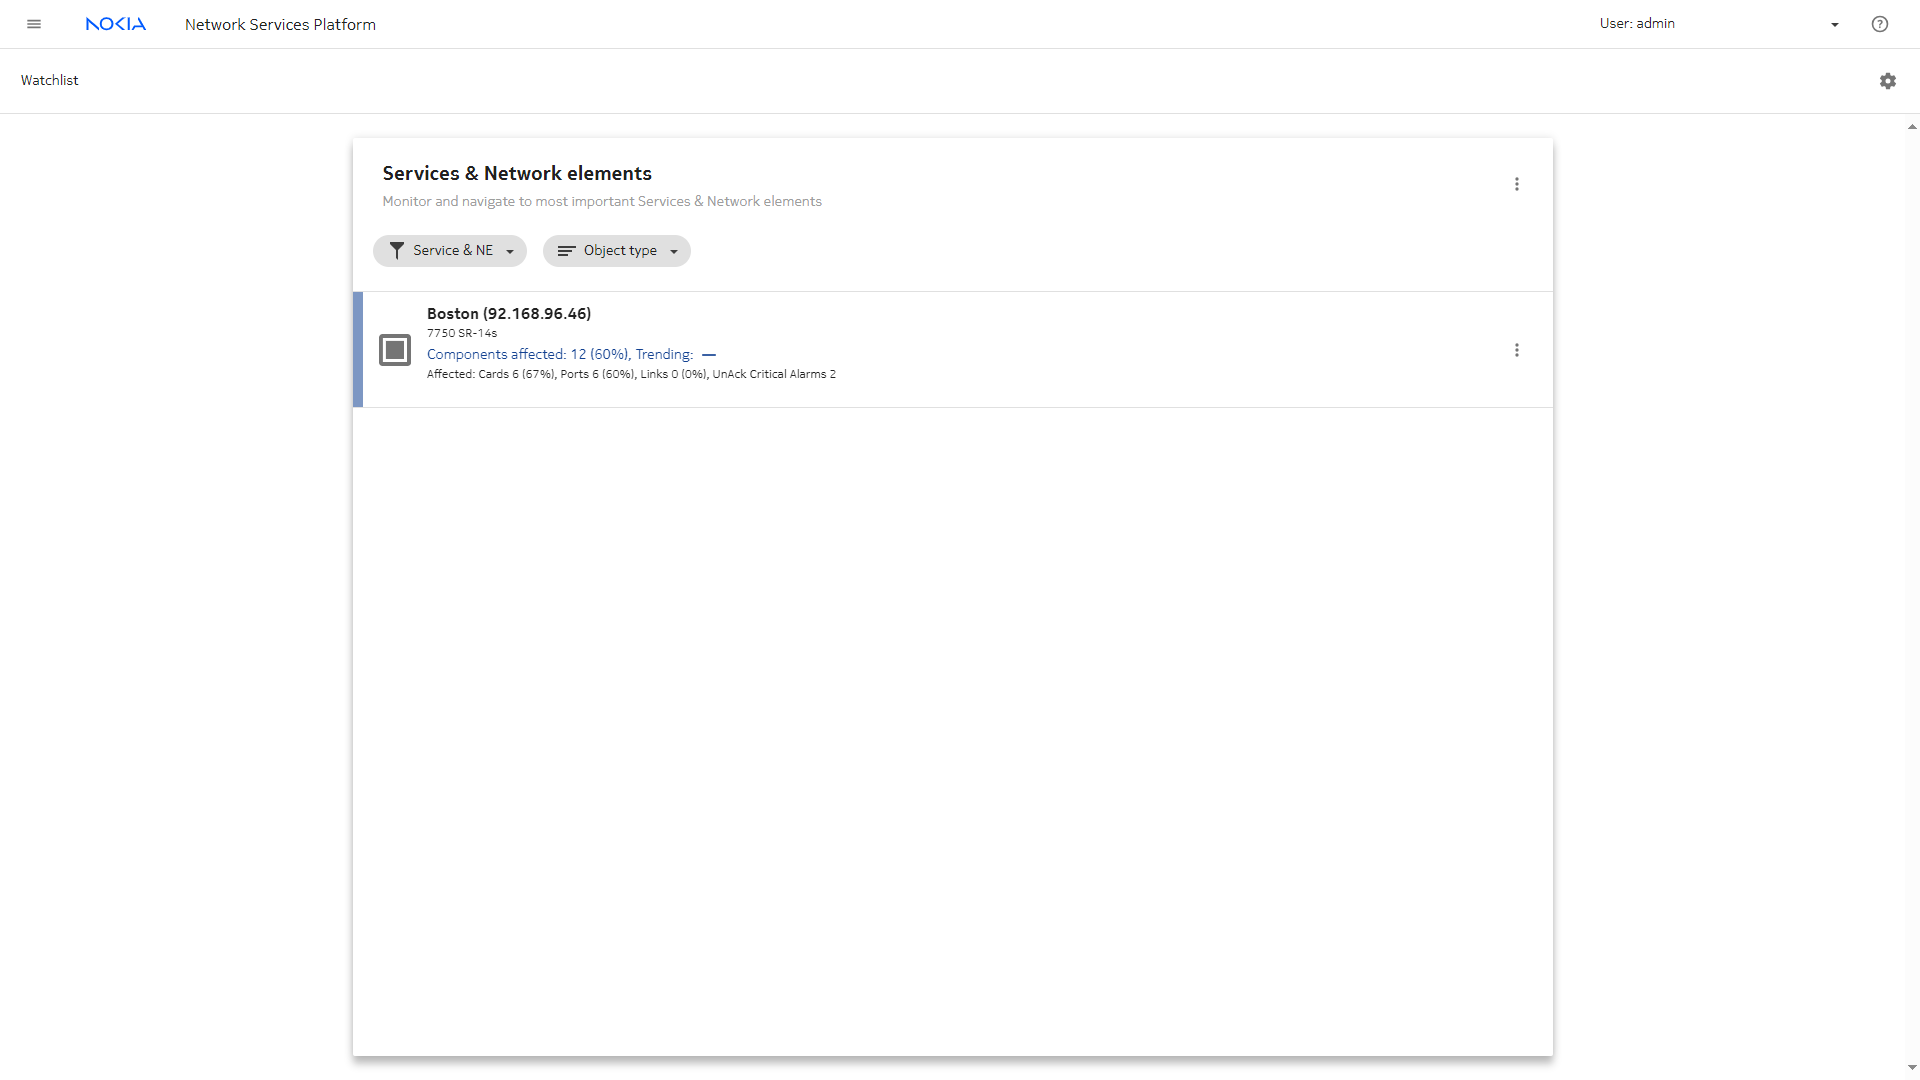
Returning again to the Network Elements dashlet, we can add the NE to the Watchlist to navigate to it easily in future. Choose Add to Watchlist from the Table row actions menu.
|
7 |
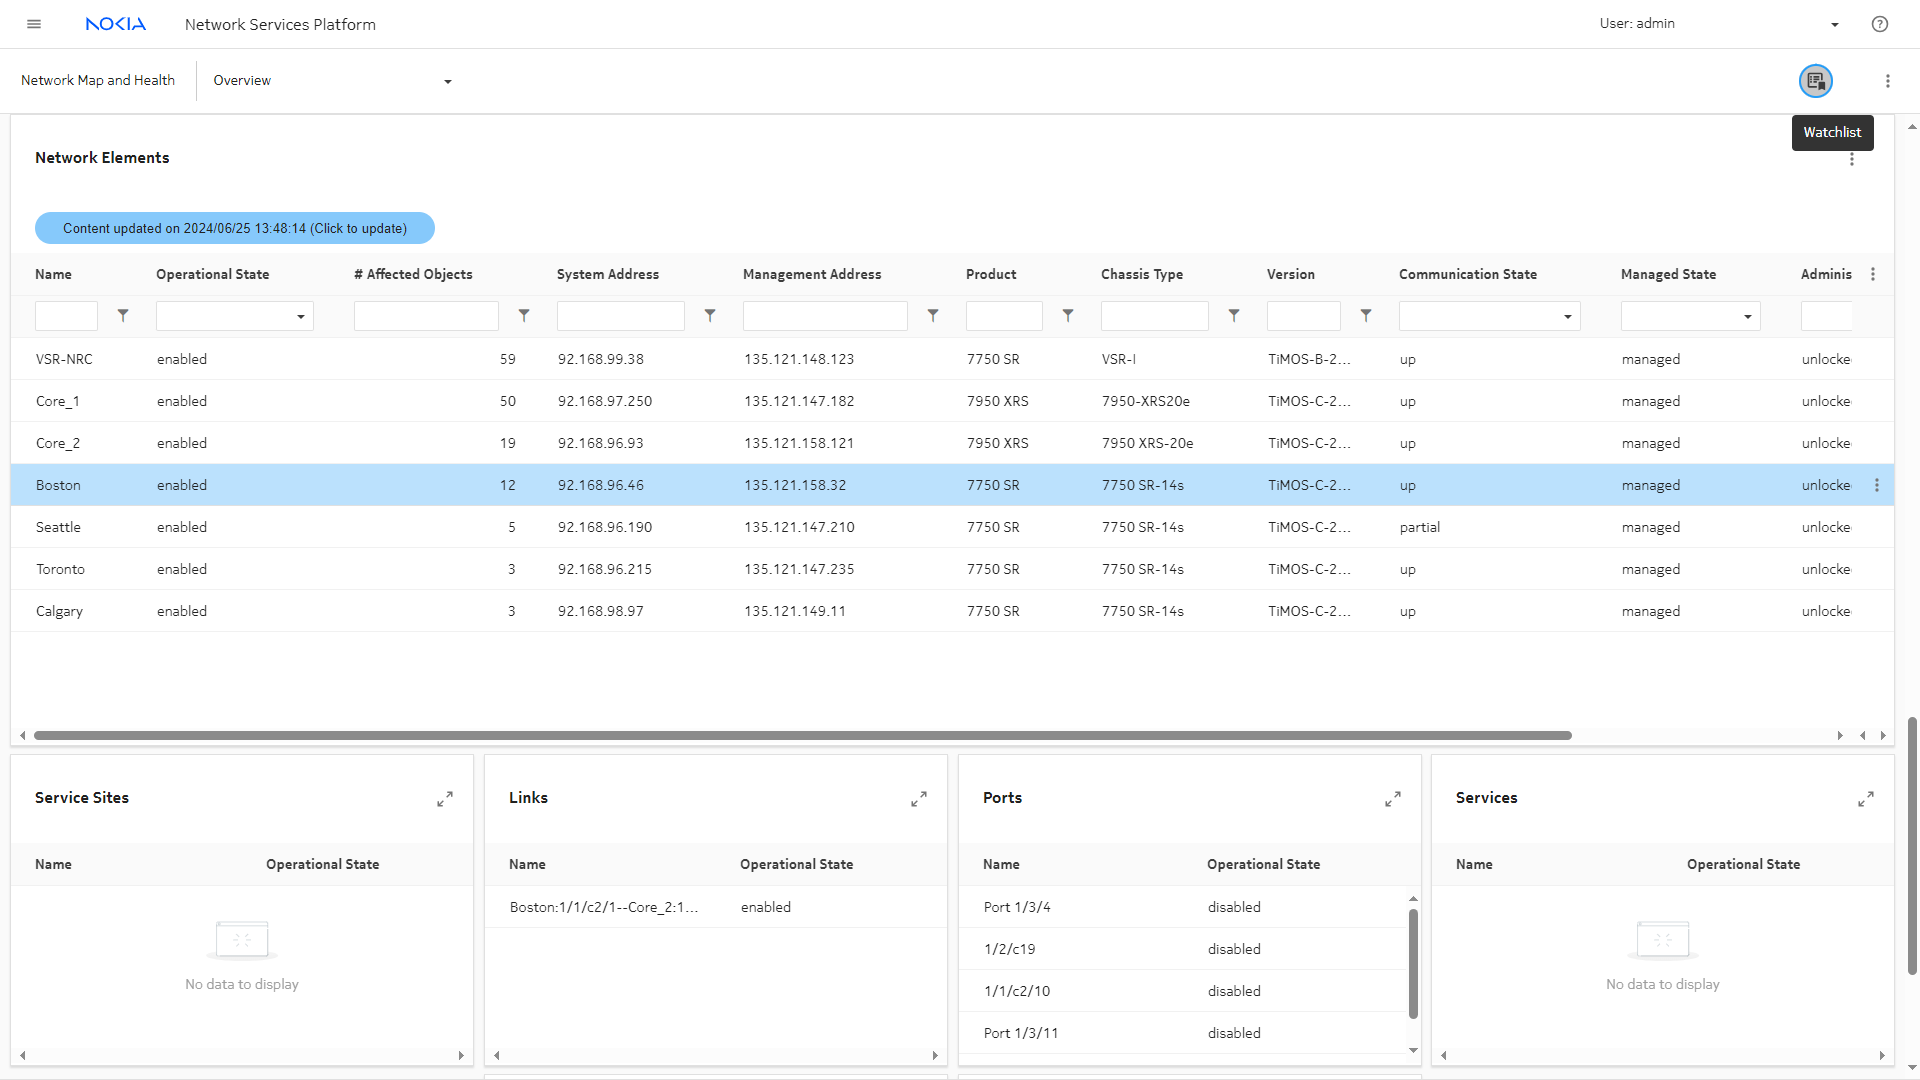
Click Watchlist at the top of the page to navigate to the watchlist.
|
8 |
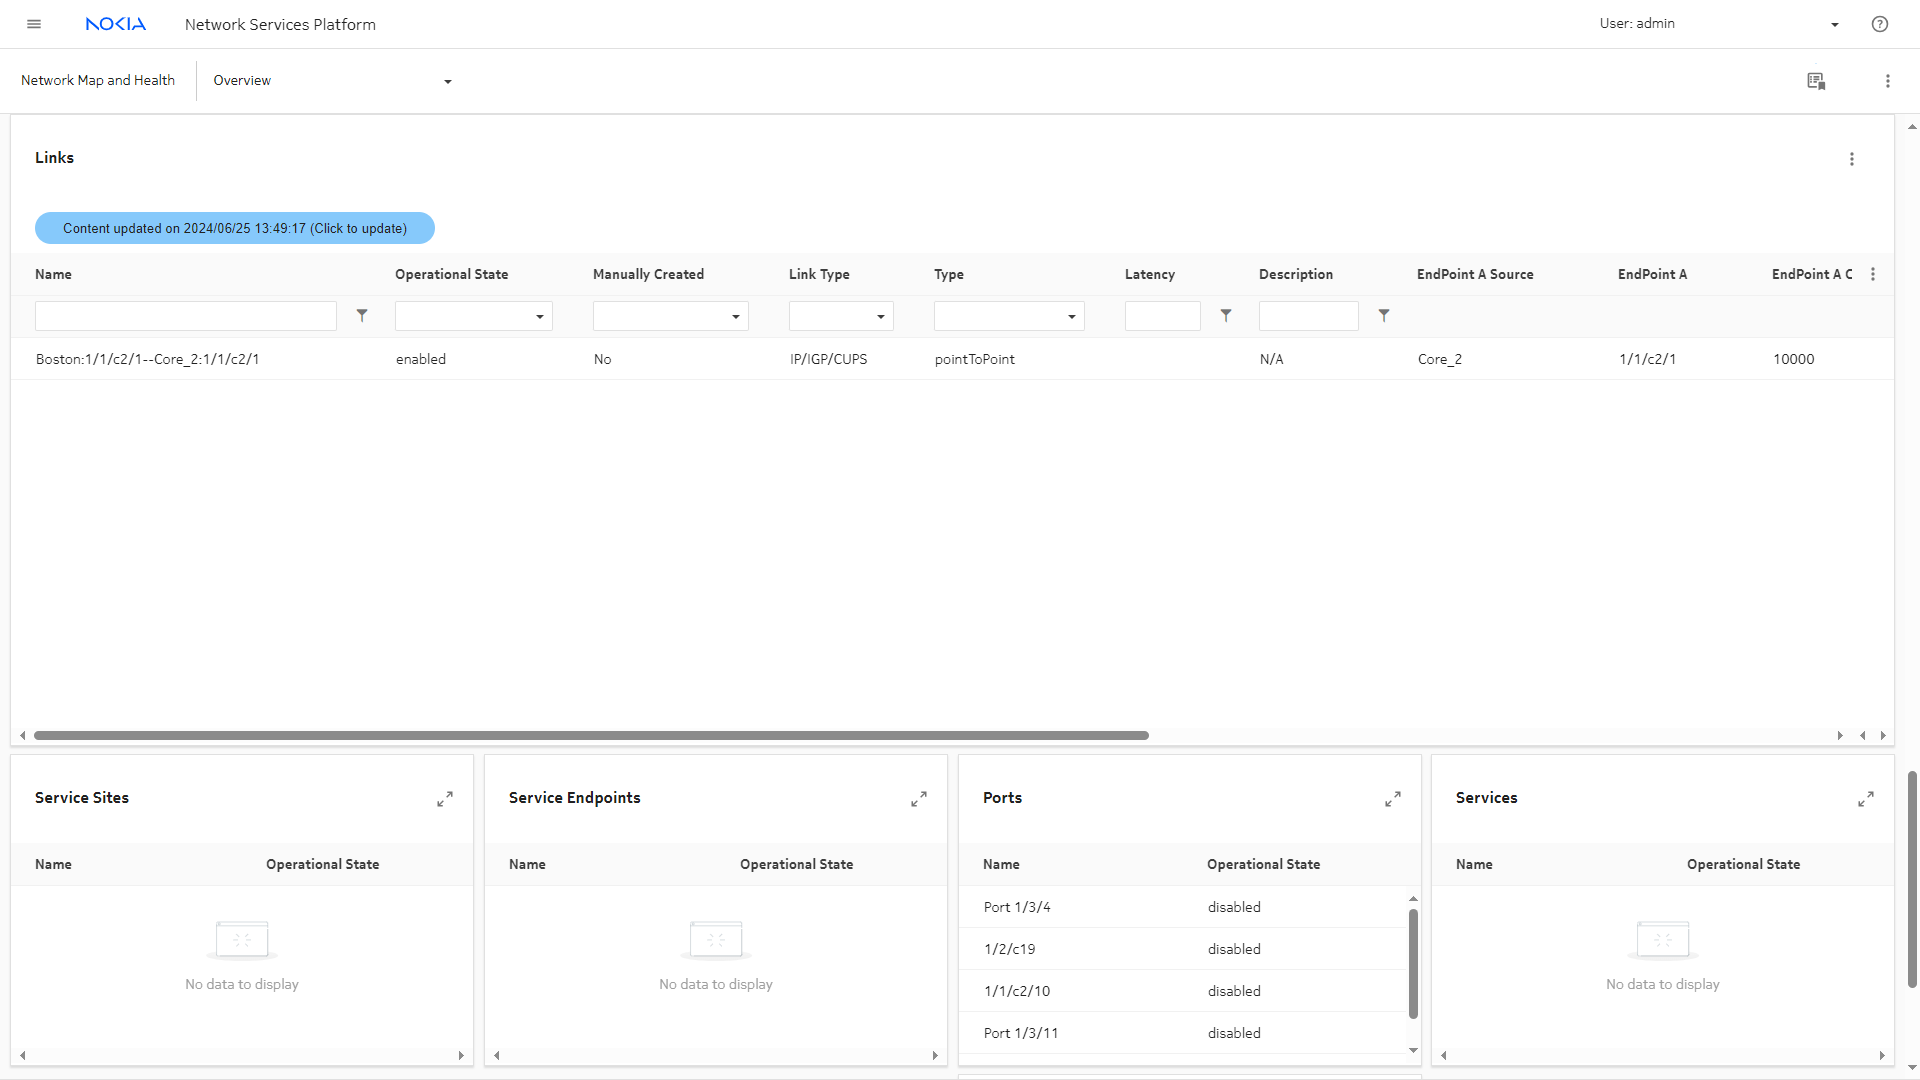
Let’s take a look at other information available on the Network Health dashboard. The Links dashlet shows a list of links configured on the system, showing their attributes.
|
9 |
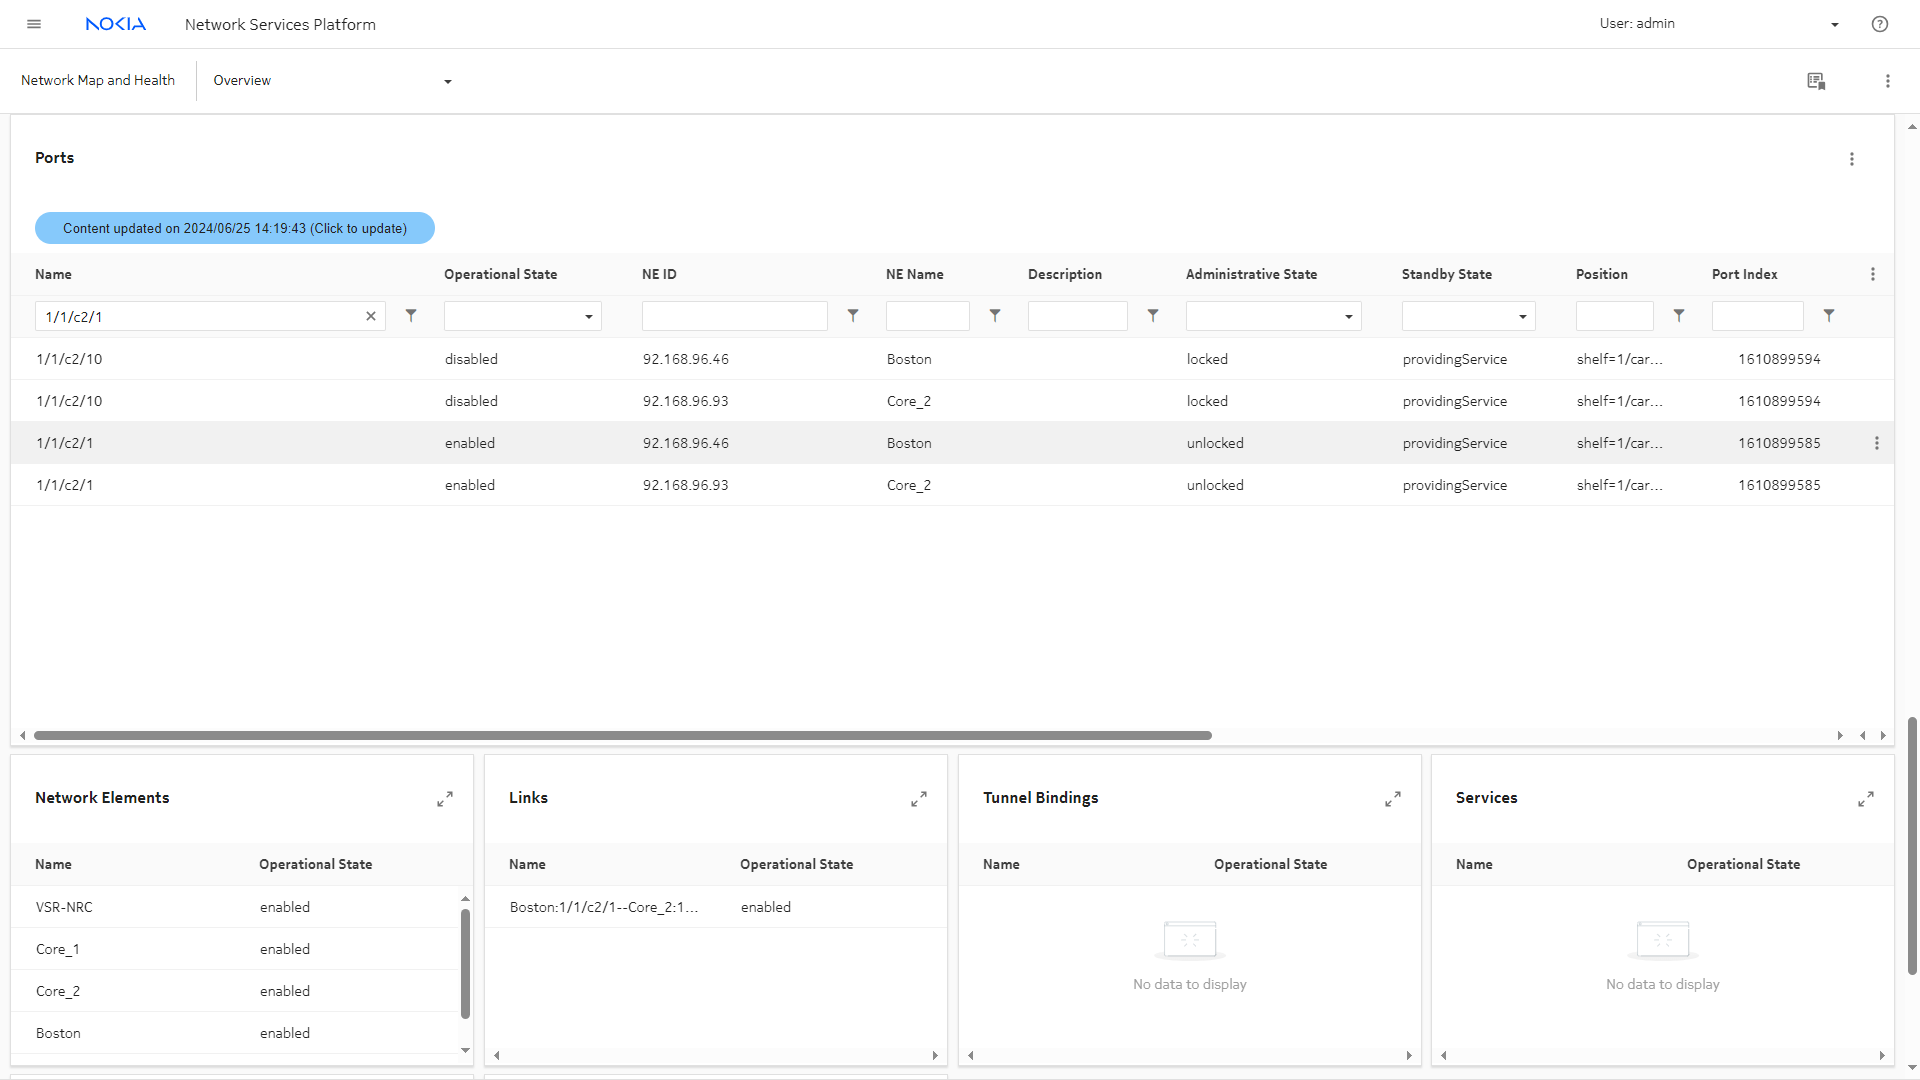
We can access more information from the Ports dashlet.
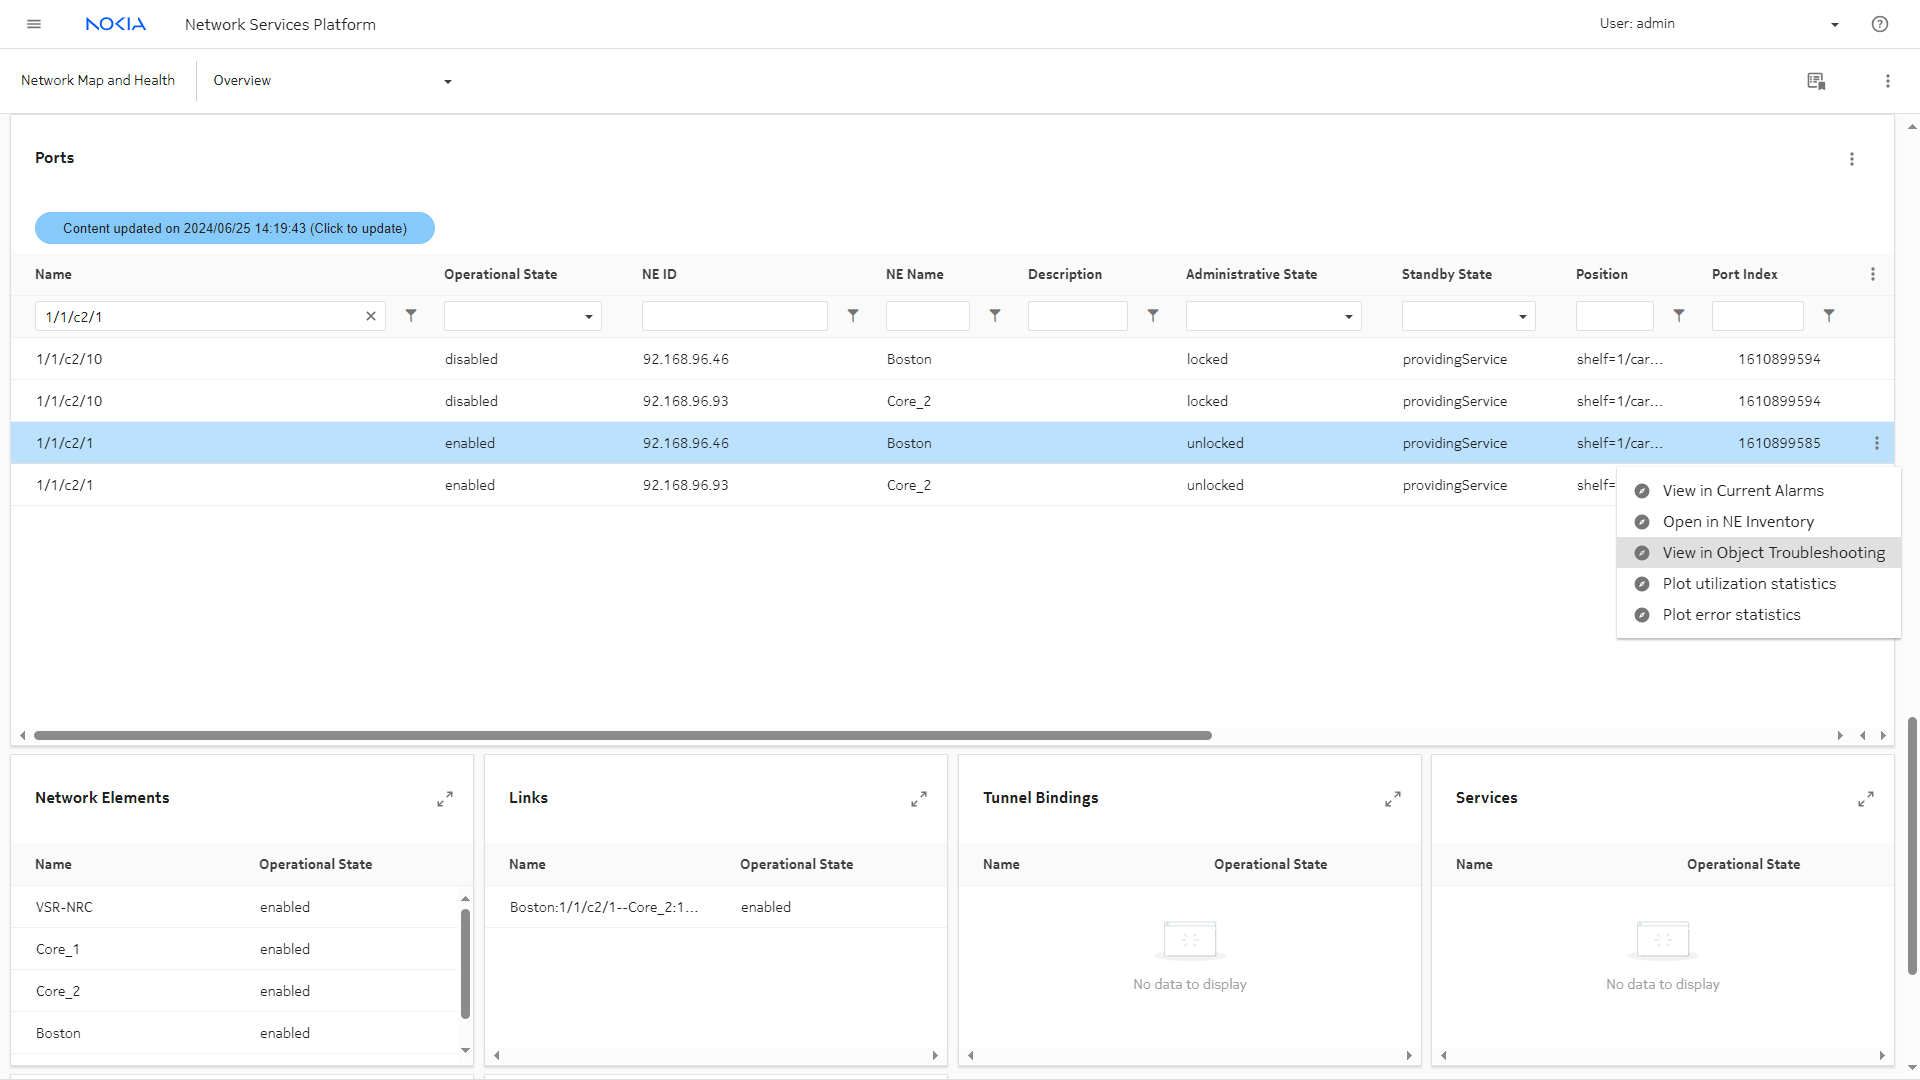
Expand the Ports dashlet and filter the list to show a port of interest.
|
10 |
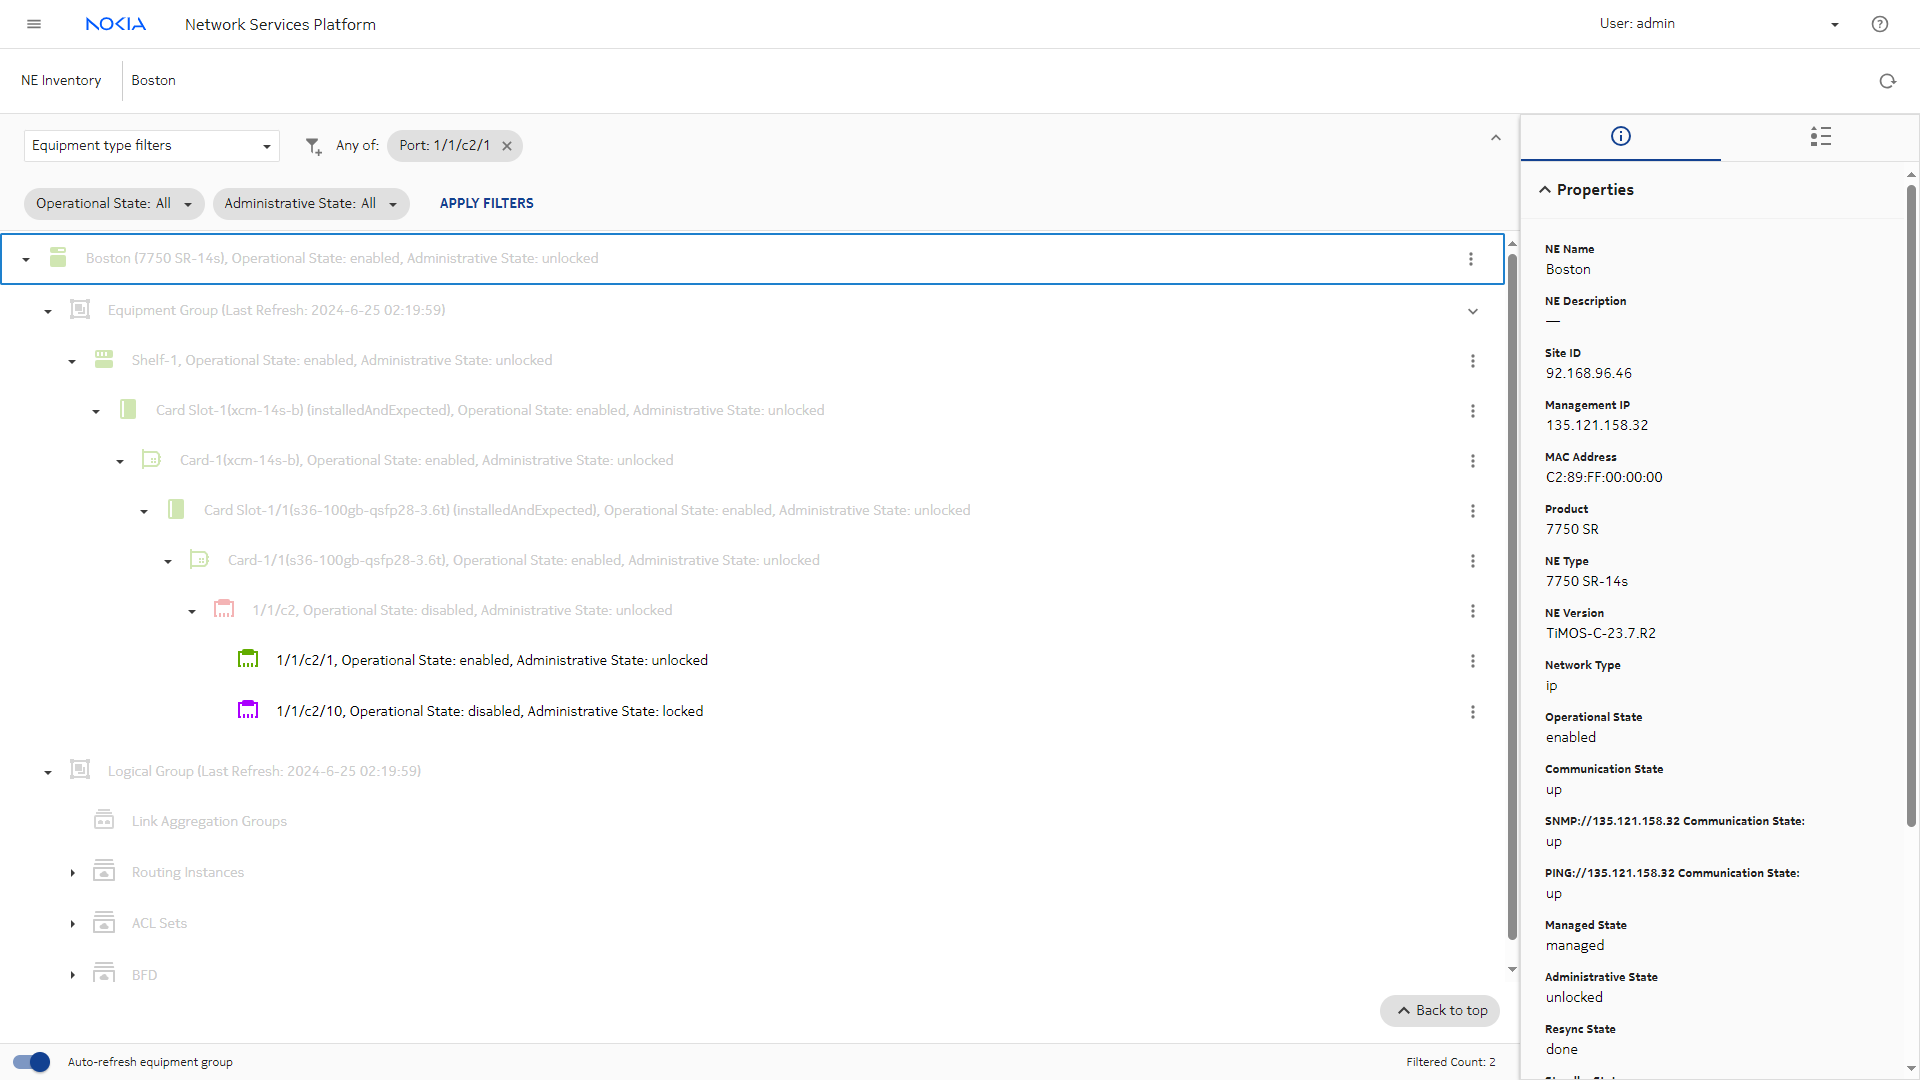
Select the port and choose Open in NE Inventory from the Table row actions menu (). An NE Inventory view opens in a new tab, filtered to show the selected port.
|
11 |
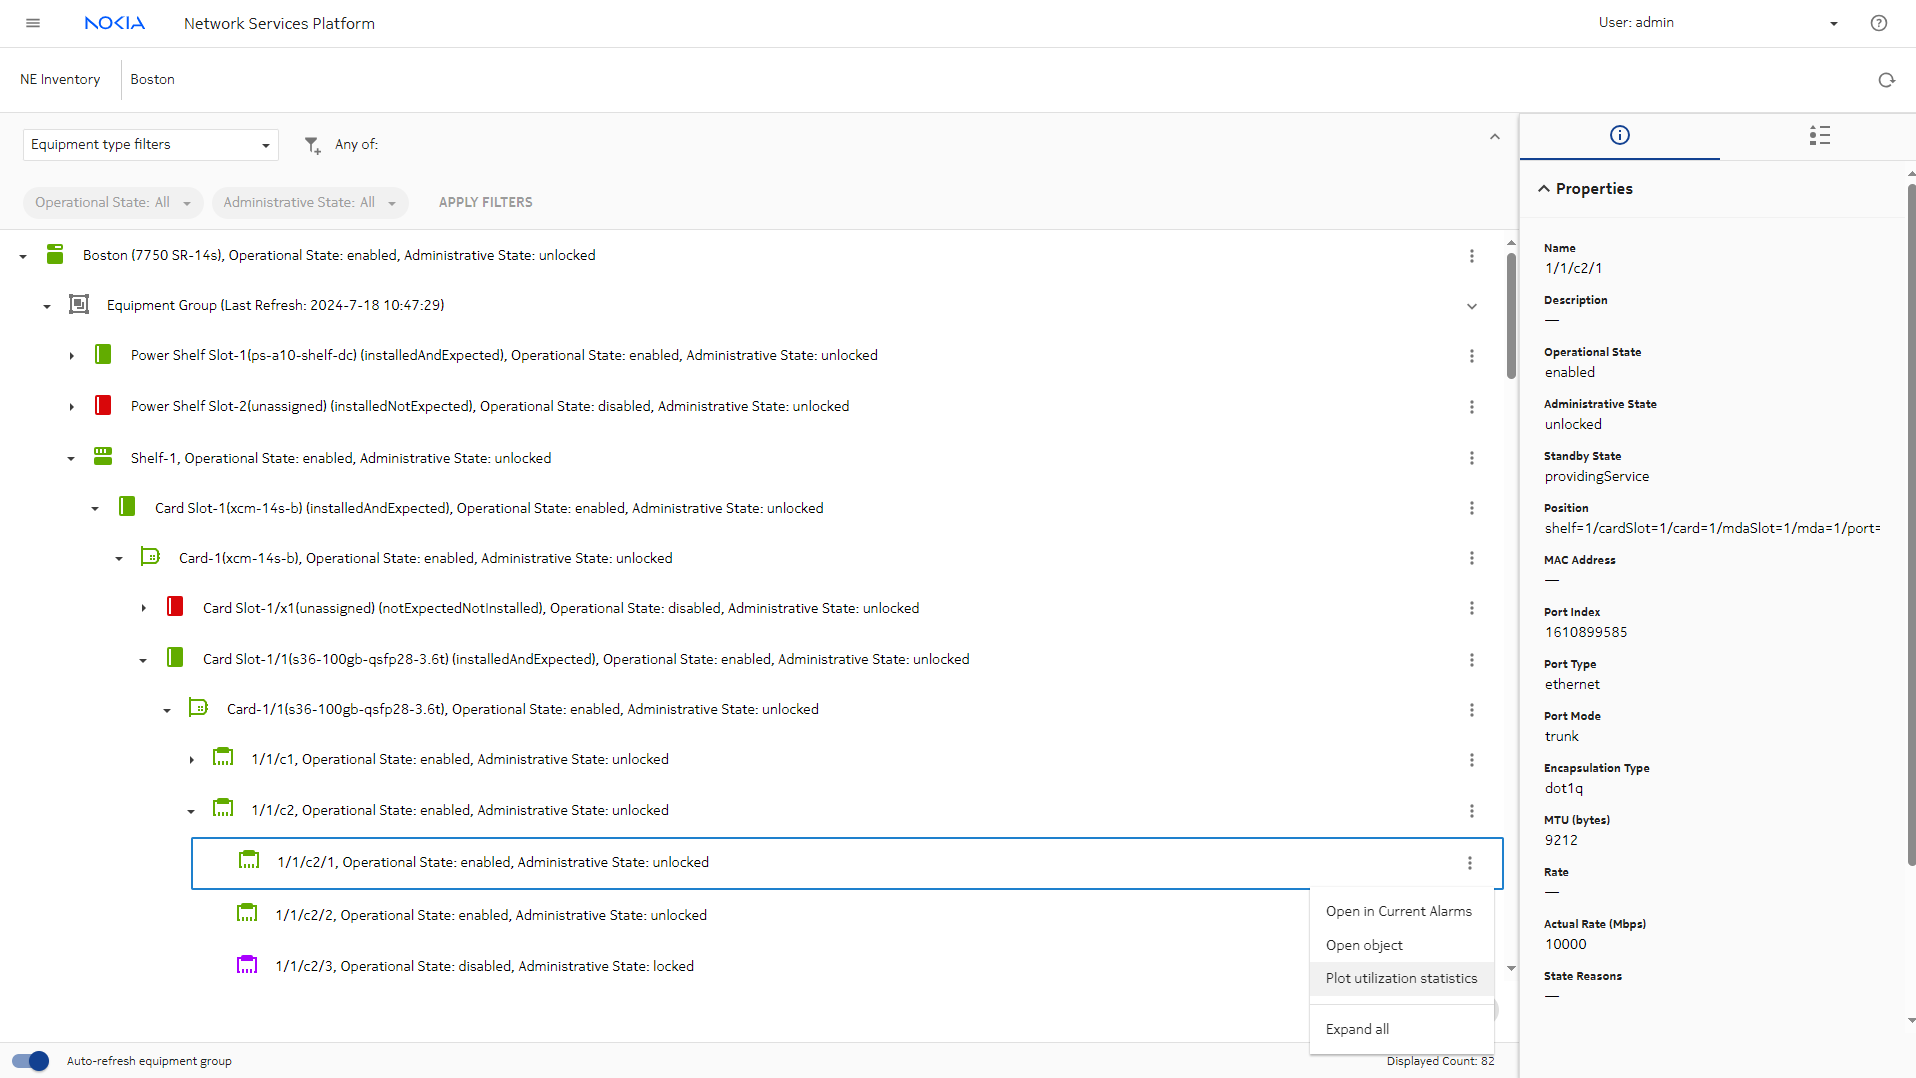
From the NE Inventory, we can plot utilization statistics for the port. This will show that traffic is flowing.
From the port level in the equipment tree, choose Plot utilization statistics from the More menu ().
|
12 |
The Data Collection and Analysis Visualizations view opens in a new tab, showing a plot of utilization statistics for the port.
|
13 |
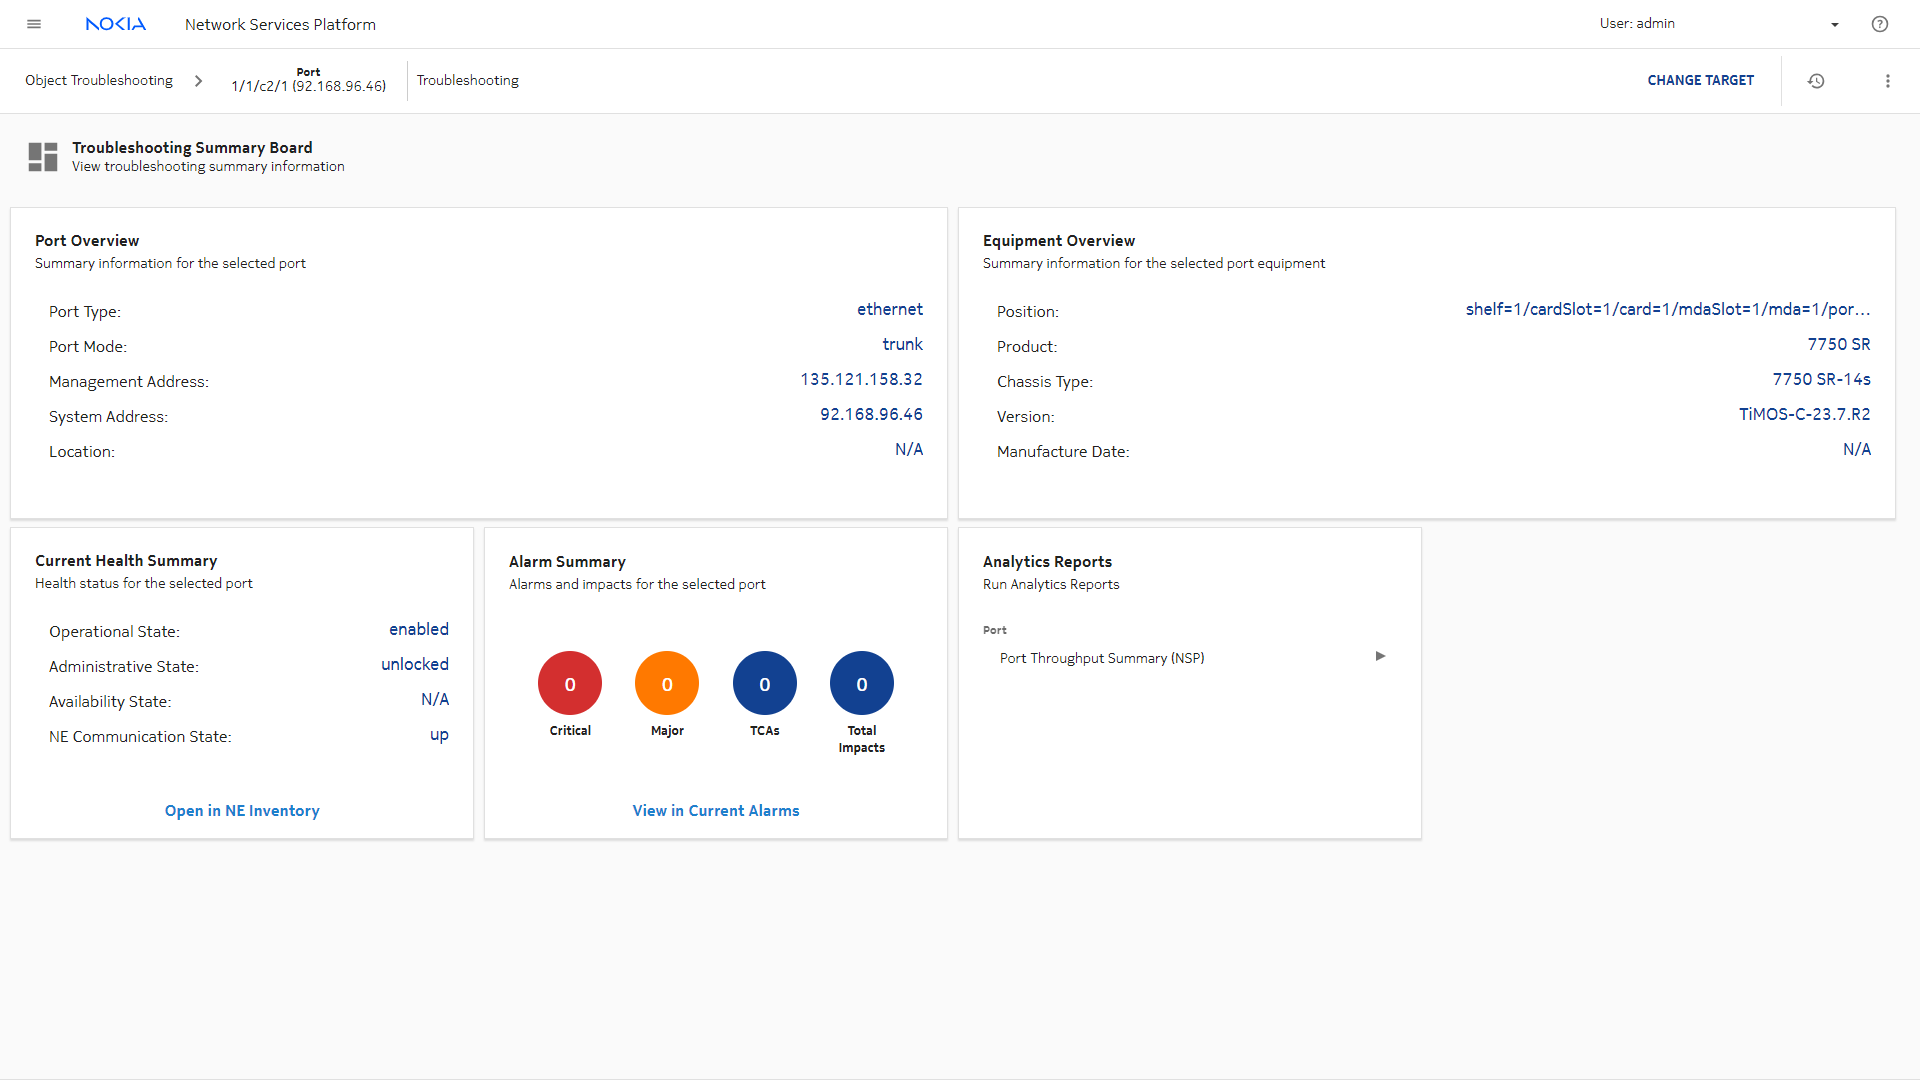
We can close the chart and inventory tabs, and return to the Ports dashlet. Select Open in Object Troubleshooting to see a summary of configuration and health information for the port.
|
14 |
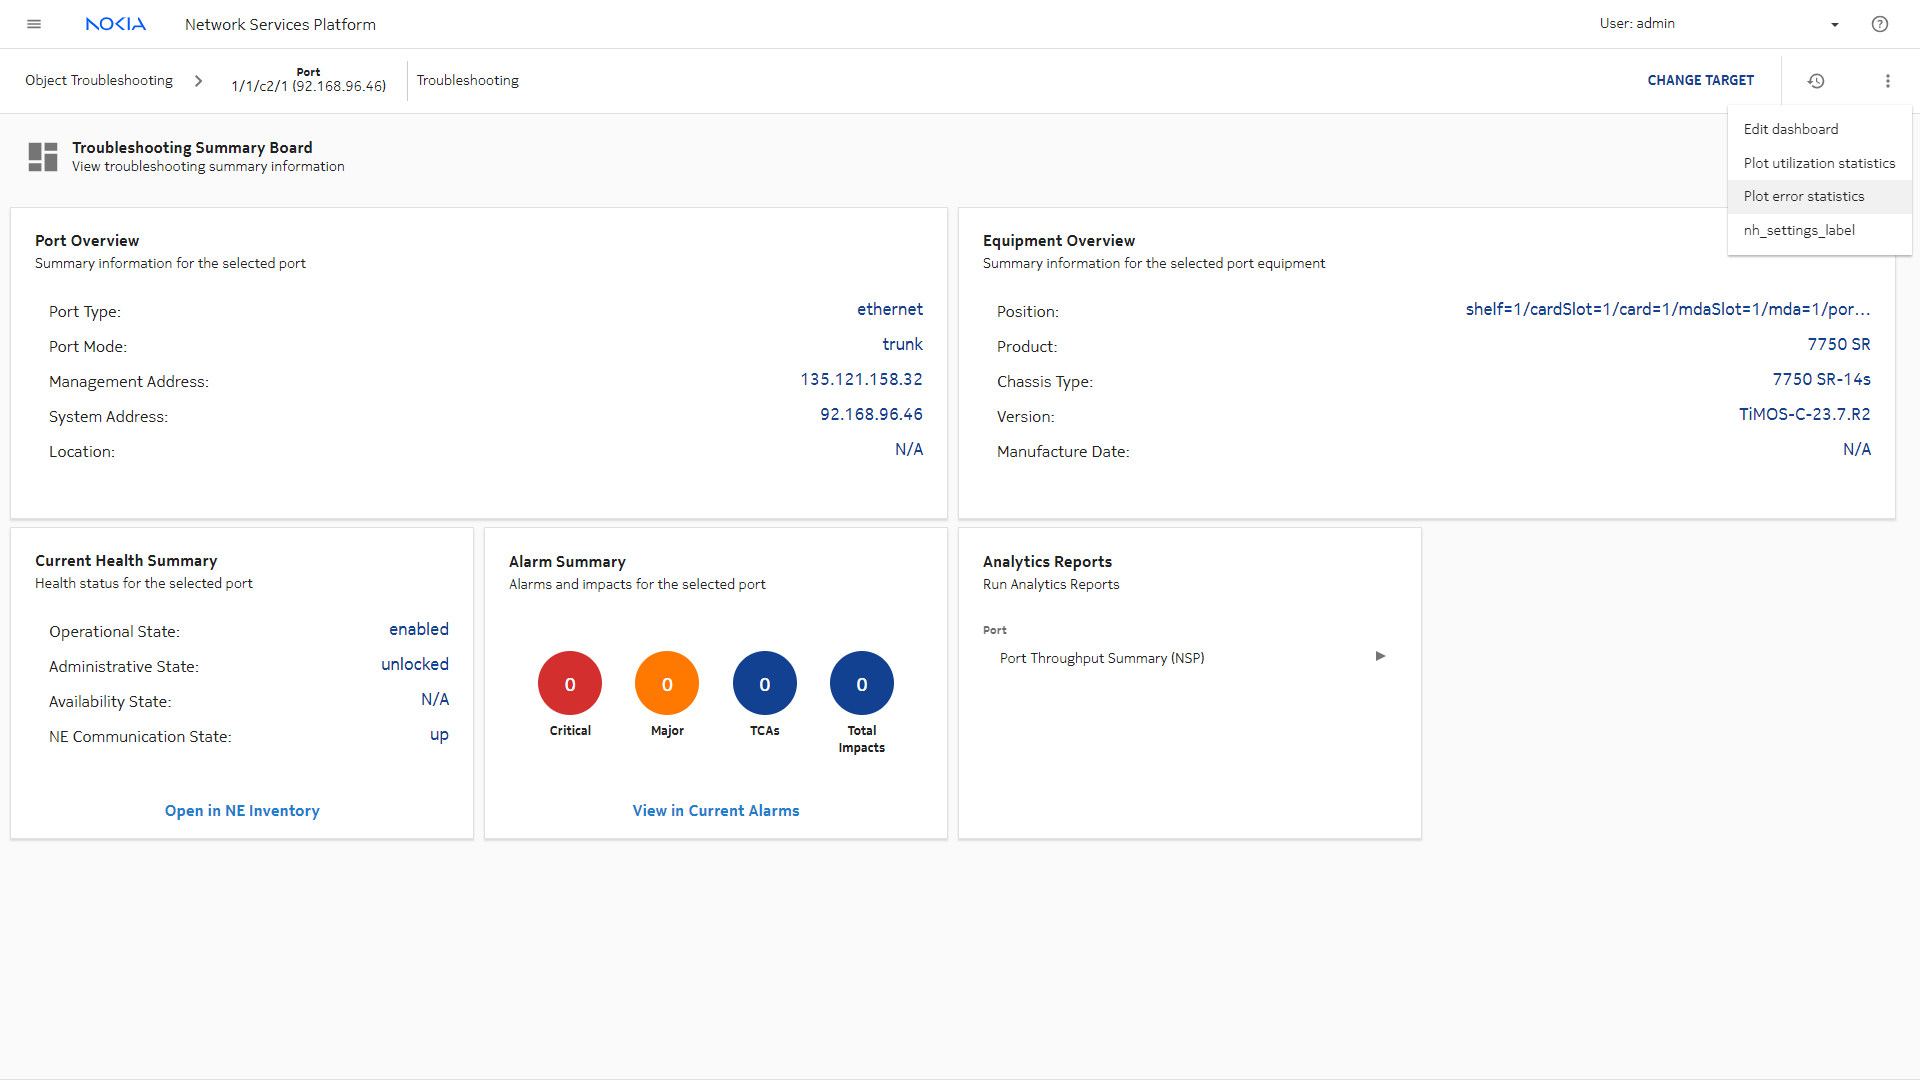
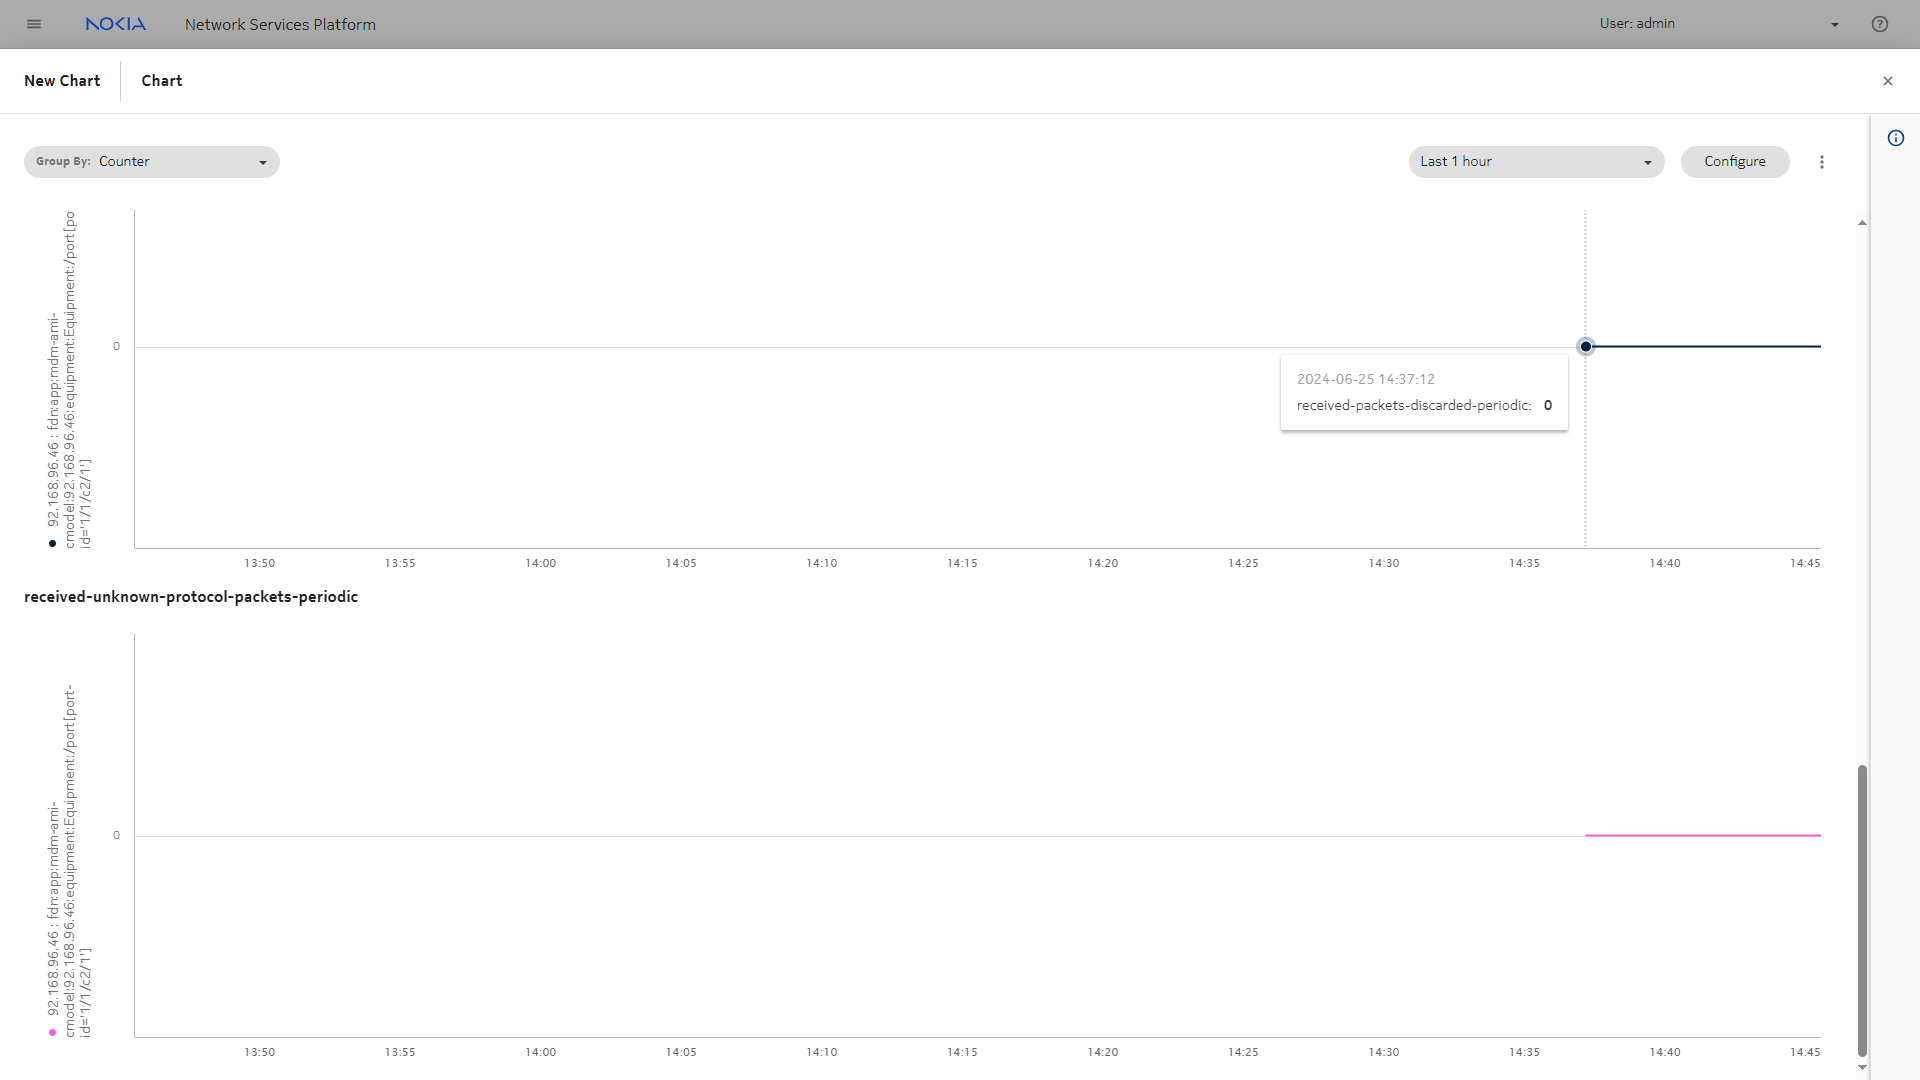
From here, we can plot error statistics to see if problems are occurring on the port.
The plot shows no errors.
|
Perform OAM tests
|
|
1 |
Performing OAM tests will provide another way to confirm connectivity of the NE.
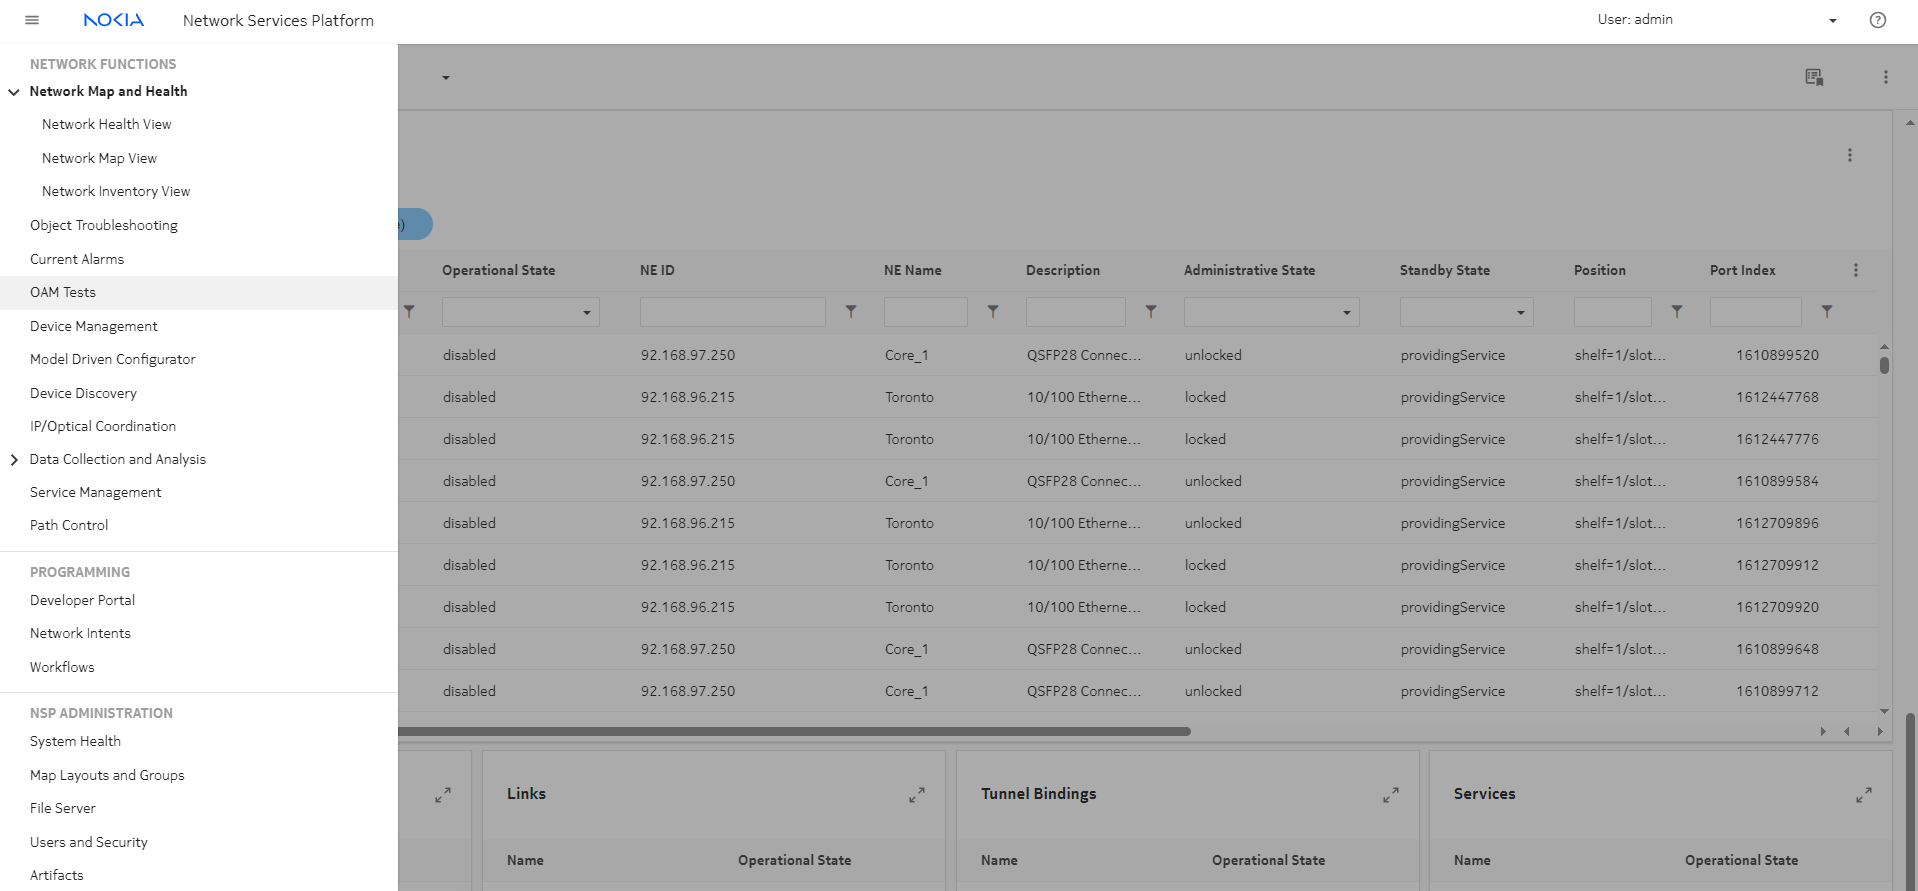
Click OAM Tests from the NSP main menu.
|
2 |
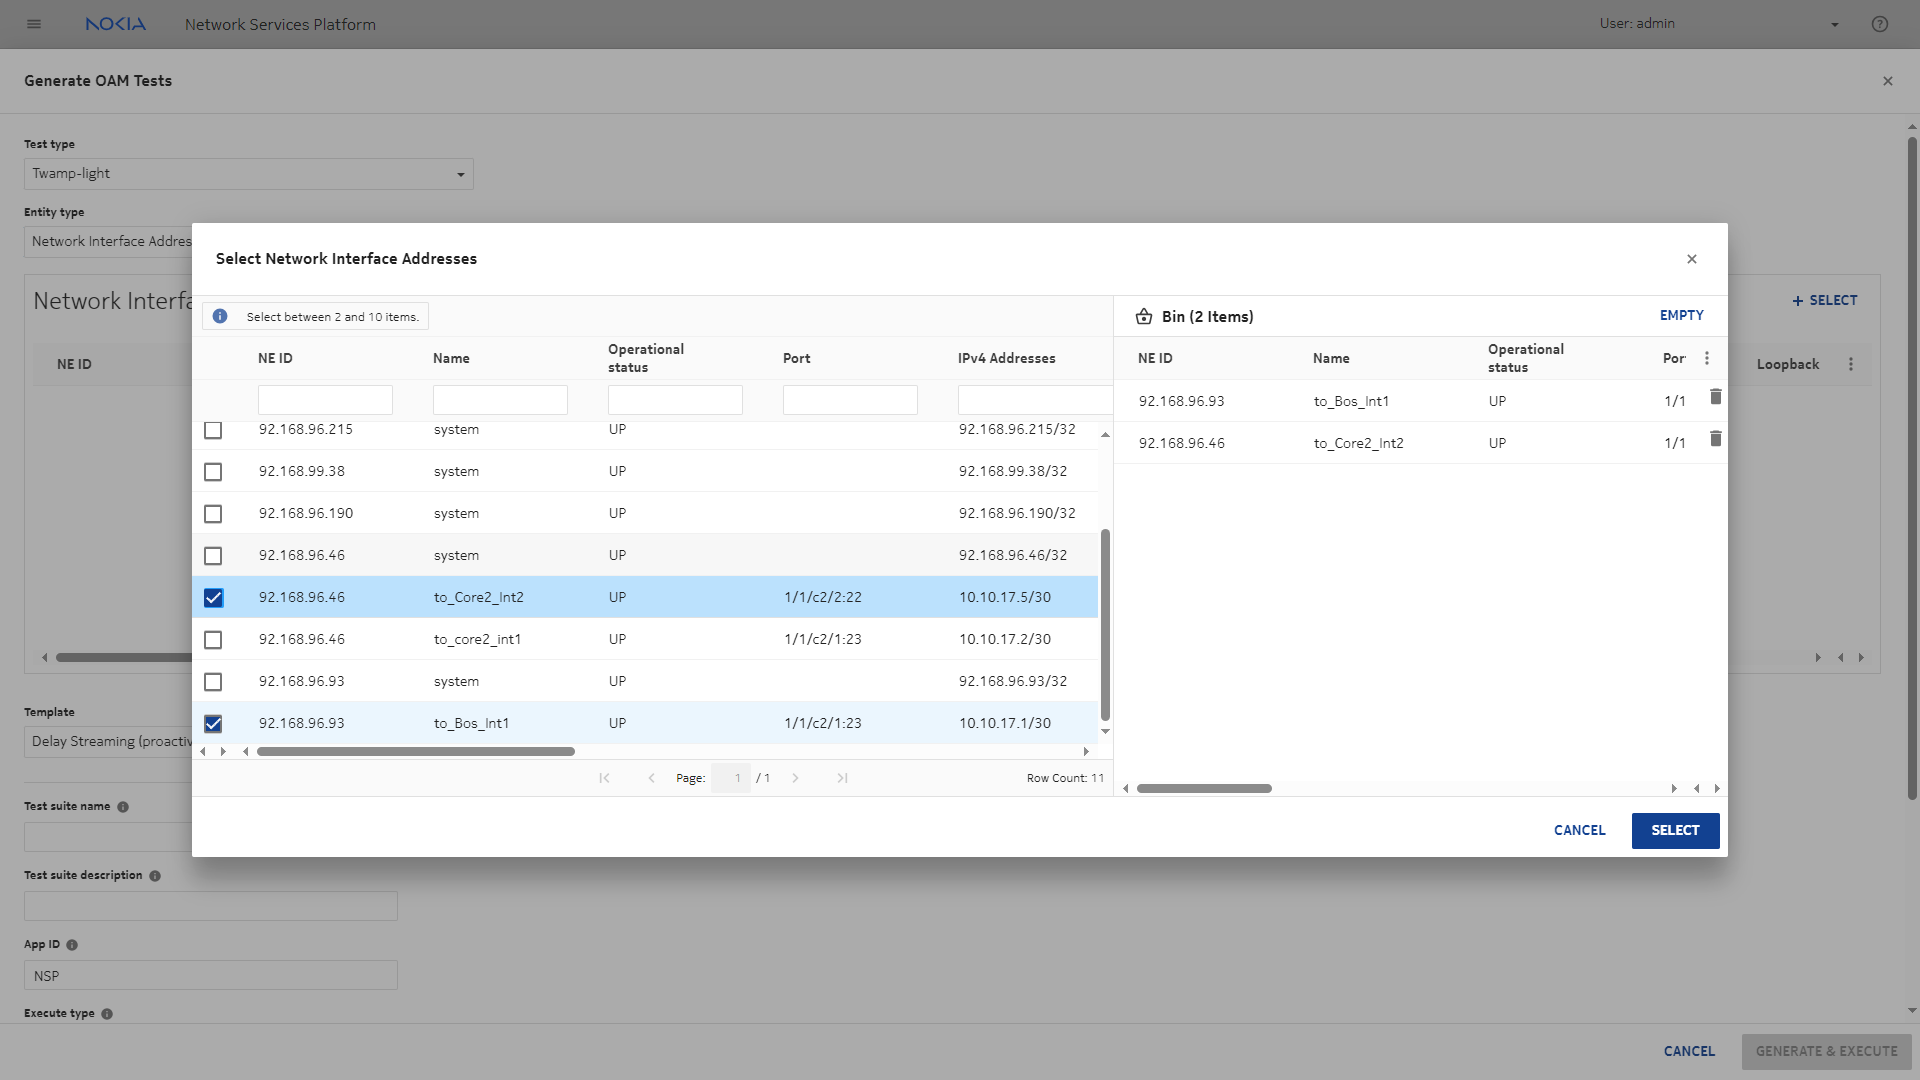
We’ll create TWAMP Light tests for the interfaces we created:
-
In the Data Collection and Analysis Management, Test Suites view, click SUITE.
-
In the form that opens, select Twamp-light from the Test type drop-down.
-
Select Network Interface Address in the Entity type drop-down.
-
In the form that opens, select the interfaces we configured earlier in this process, and click SELECT.
-
Click GENERATE & EXECUTE to run the tests immediately.
|
3 |
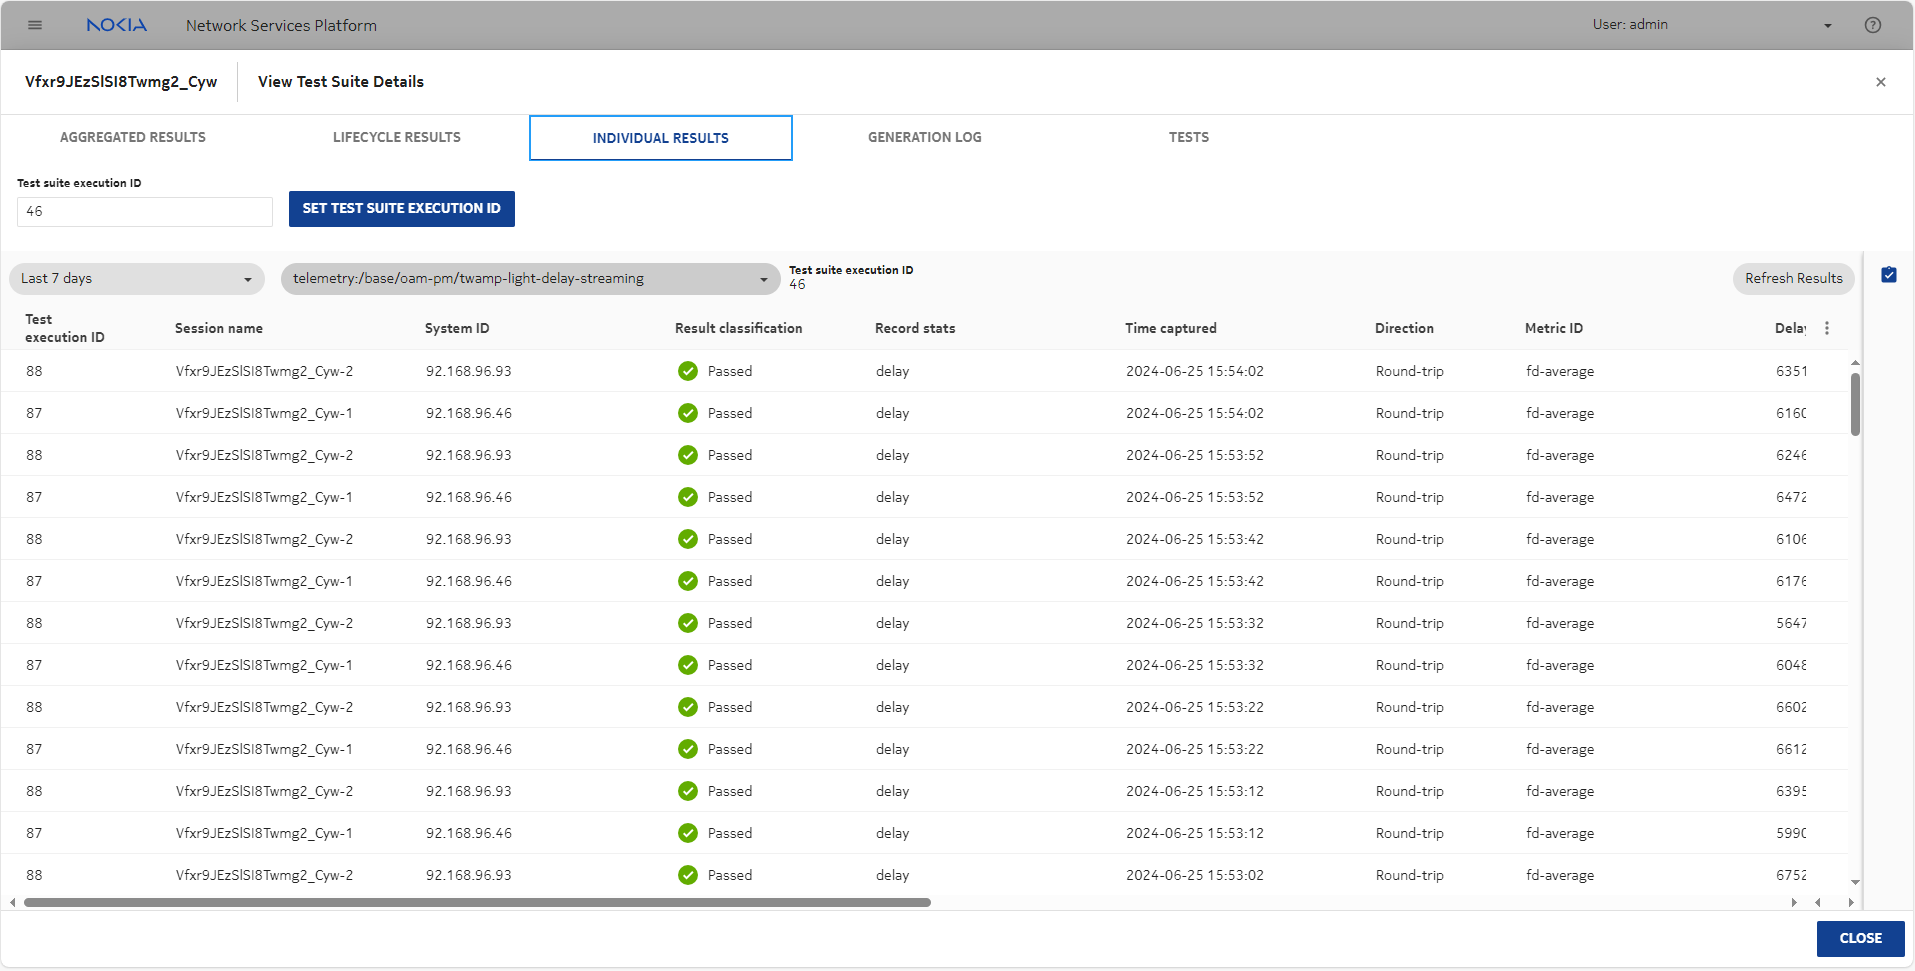
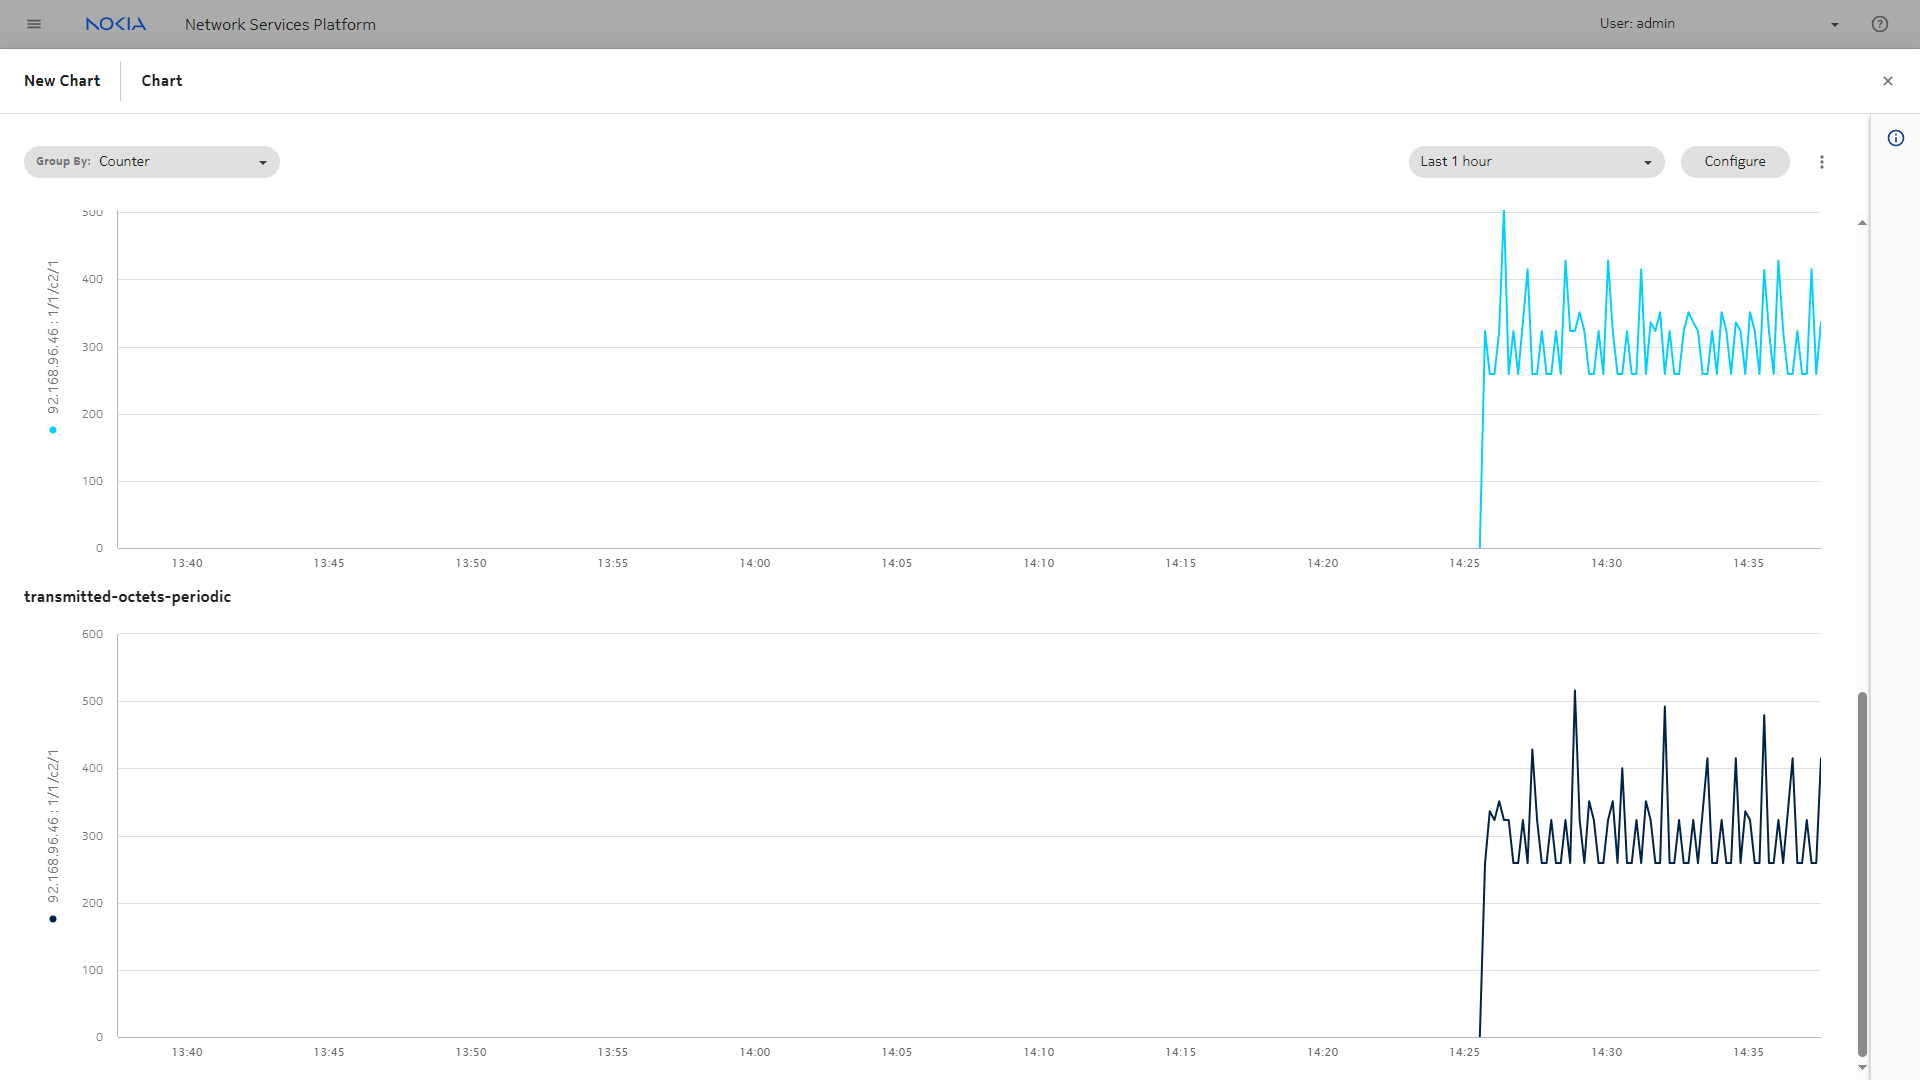
Double click on the test suite to see the results. All tests are passing, verifying connectivity over the link.
|
Restore the NE configuration
|
|
1 |
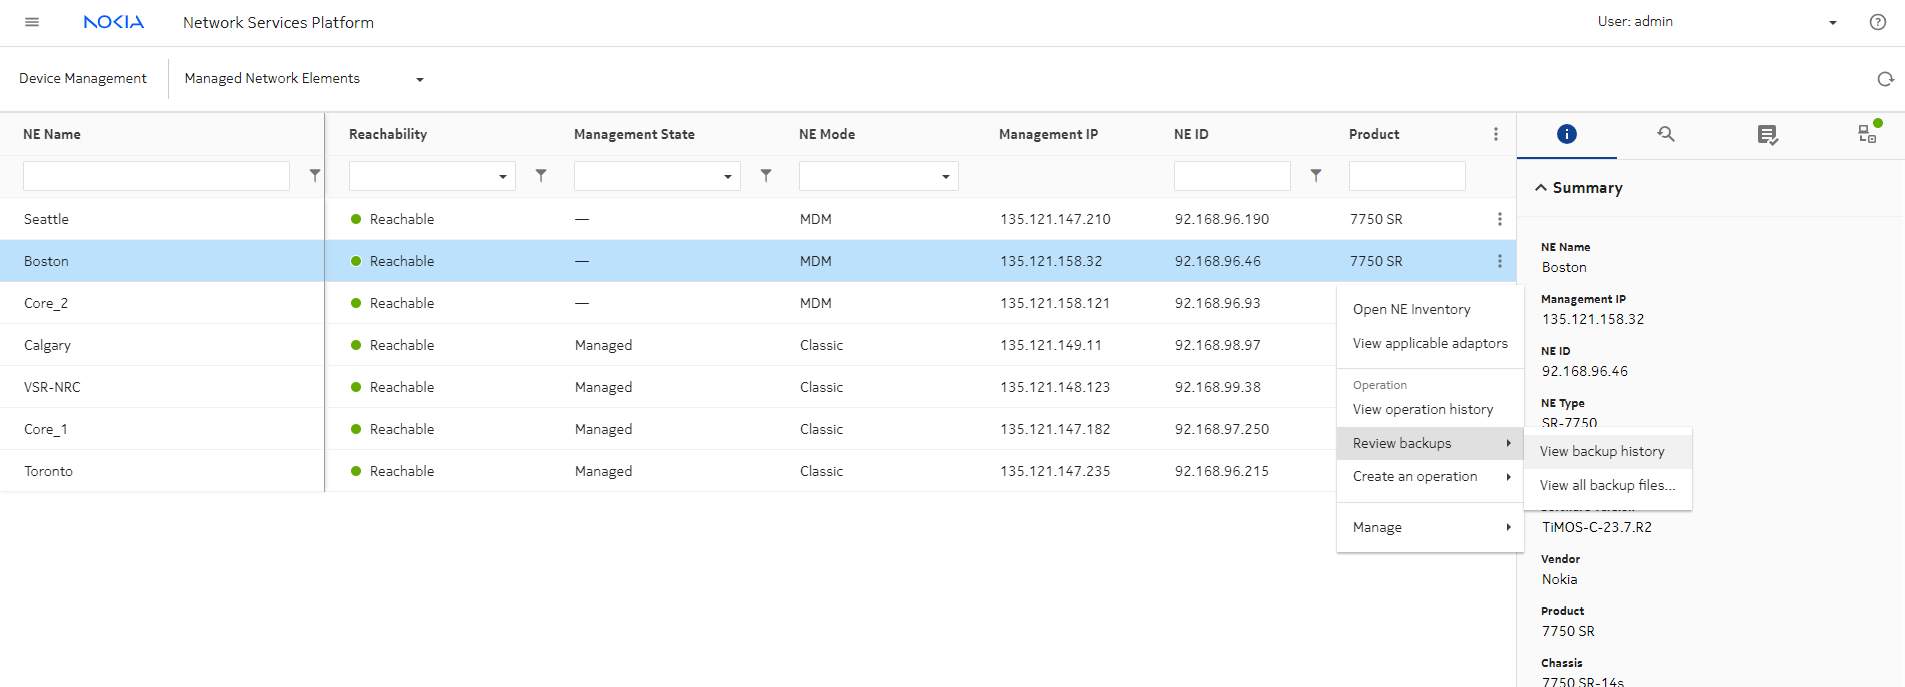
Finally, we can perform an optional restore operation. Returning to the Device Management, Managed Network Elements view, choose Review backups, View backup history from the Table row actions menu ()
|
2 |
Select the most recent backup and choose Restore from the Table row actions menu ().
|
3 |
When the restore is completed, select the NE and click Manage, Resync.
The NE is working and is ready for further configuration. |