Monitor latency
Monitoring LSPs in Path Control
Open the Path Control, LSPs and select an LSP.
-
The Hops panel in the Info panel shows the LSP paths. Pay close attention to the current path the LSPs of interest are taking to reach the destination.
-
The Latency column shows the measured latency in microseconds.
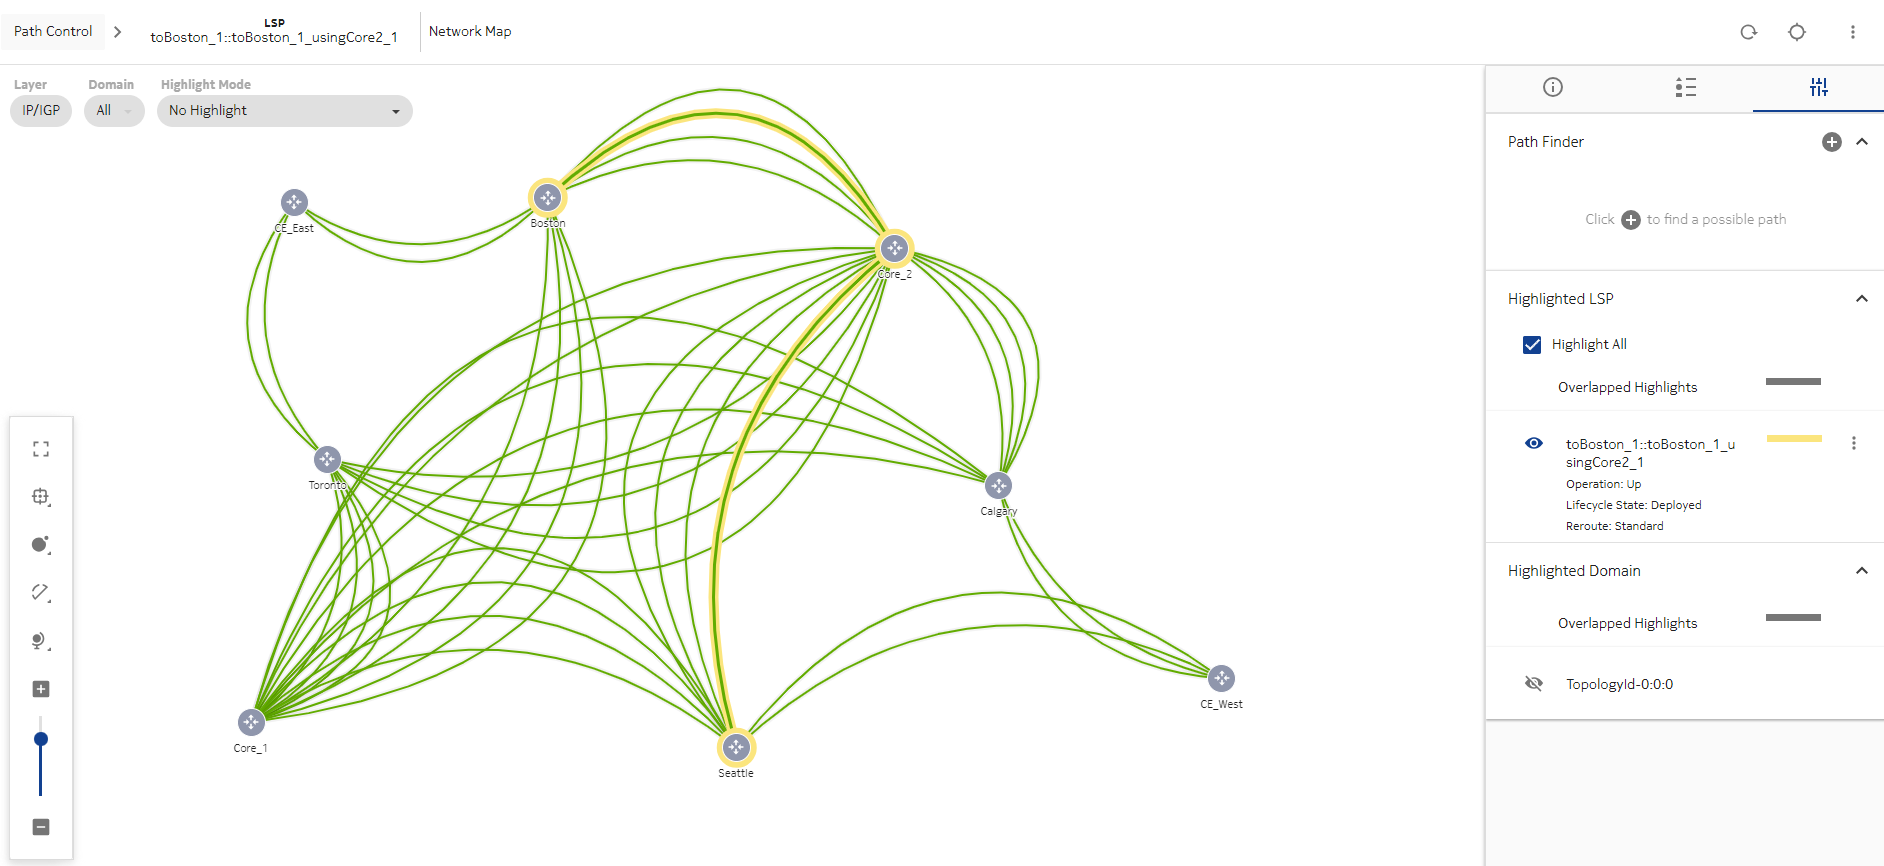
Click ![]() (Table row actions), Show on map to display the LSP in a network map format.
(Table row actions), Show on map to display the LSP in a network map format.
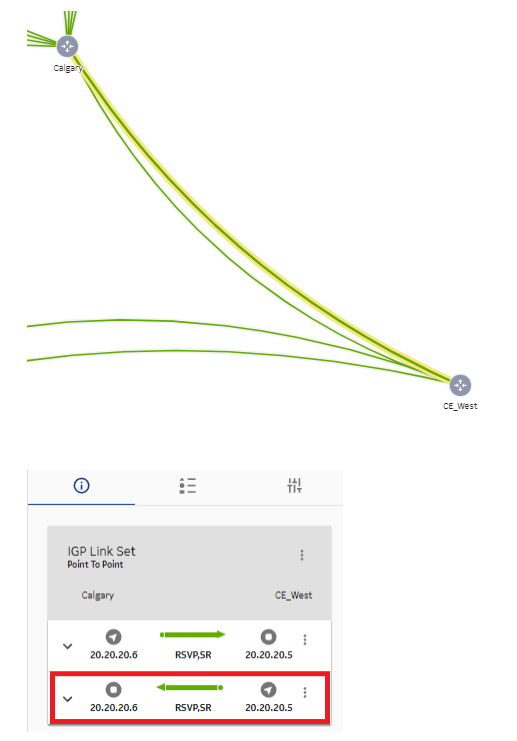
Click on a link to display link information in the Info panel.
Monitoring links in Path Control
From the network map view of the LSP, click on a highlighted link to display link information in the Info panel.

Open the Path Control, Links view and select a link.
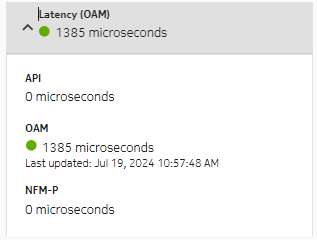
The Latency column shows the measured latency in microseconds. The Latency information in the Info panel provides further details about recorded latency measurements. Path Control considers three possible sources (API, OAM, and NFM-P). The measurements shown in this example are coming from MD-OAM, as expected.
Furthermore, as shown here, latency values can be configured manually via APIs. If latency values are coming from both API and OAM/NFM-P sources, latency values or measurements from API calls will take precedence over OAM and NFM-P.

From the selected link, click ![]() (Table row actions), LSPs on Link to see the list of LSPs on the selected link.
(Table row actions), LSPs on Link to see the list of LSPs on the selected link.

