To resolve a split-brain DR setup with autoFailover set to false

Overview

Note: All CLI commands should be run on either node1 or node2, i.e. a control-node.

This procedure assumes the following scenario:

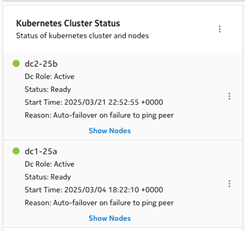
  1. The DR setup has a split-brain situation where both clusters are acting as an active role. This can be checked by logging into both clusters using the clusters’ VIP. In the NSP System Administration System Health dashboard, under the Kubernetes Cluster Status, both clusters should have the “Dc Role” set to “Active”:

    cluster dc1-25a

    graphic

    cluster dc2-25b

    graphic
  2. The autoFailiover property is set to disabled on both sites. This can be checked by running the following CLI command on both clusters:

    kubectl exec -n $(kubectl get pods -A | awk '/spos-asm/ {print $1;exit}') -it $(kubectl get pods -A | awk '/nspos-asm/ {print $2;exit}') -c nspos-asm-app -- /opt/nsp/os/asm/bin/asmctl autoFailoverStatus

    Sample output:

    Current Auto-failover is: False

  3. Communication between both clusters is fine, and there is no StandbyServerDown alarm shown on either clusters’ current alarms list.

To change an active cluster to standby under the above scenario:
 

Select a cluster to become the “new” standby cluster. Ideally, it should be the original standby cluster before the split-brain occurred.


Log into the cluster using its VIP and navigate to the System Administration System Health dashboard. Under the Kubernetes Cluster Status, select the cluster on top and select png3.png Make standby to make the current log-in cluster become standby.

View the figure

Note: Although the “Make standby” command is available for both clusters, the command does not consider which cluster it is initiated from and will always automatically change the current log-in cluster (i.e. the top cluster) to standby.


Once the “Make standby” command is issued, the setup should settle with an active cluster and a standby cluster. The Kubernetes Cluster Status should update to show this change, and users should only be able to log into the active cluster to view the System Heath dashboard.

View the figure

End of steps