Temperature, CPU, Memory Utilization Summary report
Temperature, CPU, Memory Utilization Summary report overview
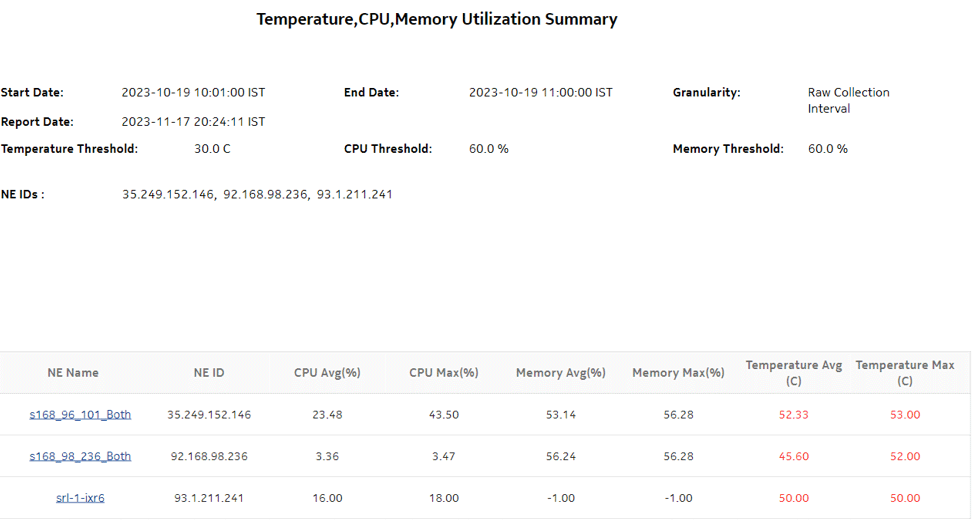
The Temperature, CPU, Memory Utilization Summary report shows the maximum and average temperature and memory and CPU usage for selected NEs. The default display is a table displaying details. By default, the table is sorted according to the NE Name column. Table sorting is enabled for the CPU Memory Average and Maximum columns. The report includes throughput data for NEs managed by the NFM-P only, MDM (model-driven Nokia) only, or NFM-P+MDM-mediated NEs.
The temperature in the report is at the NE level, since the temperature readings from all of the card sensors are averaged at the NE level as the NE temperature.
To generate meaningful average temperature data, Nokia recommends using raw or hourly interval statistics.
Memory Usage is computed in the report using the following formula: [memory in use / (allocated memory + available memory) * 100]. The calculation is displayed at the footnote section of the reports.
If no telemetry subscriptions are enabled for CPU, Memory, and Temperature, the report shows -1 values for CPU and Memory and N/A for Temperature.
Utilization results are colored red when utilization reaches or exceeds user-defined thresholds. Thresholds are defined separately. The default value for the temperature threshold is 30°C. The default value for the memory and CPU thresholds is 60%.
The following temperatures can be reported by the NE when no temperature sensor is available. These temperatures are invalid and will not be displayed in the report.
Limitations
Report limitations include:
-
Minimum and maximum throughput aggregation cannot be compared with the minimum and maximum throughput values generated from raw granularity.
-
Some table columns cannot be sorted and filtered; see Which report table columns cannot be sorted and filtered?.
-
There is a limitation in the length of string which is passed when you choose Select All for the display name for some report inputs; in particular, when you multiselect a report input, you cannot exceed a string length of 65,000 octets.
Prerequisites
The following table describes the aggregation rules that must be enabled and telemetry subscriptions that must be configured for the NEs on which statistics are to be collected. The aggregation rules must be enabled to view the report for granularities other than raw data; see How do I configure analytics aggregation?. Enable aggregation and configure telemetry subscriptions; see the Telemetry information on the Network Developer Portal and the NSP Data Collection and Analysis Guide.
See information in the NSP NFM-P Statistics Management Guide about creating or modifying a specific MIB statistics policy using a bottom-up method.
Table 19-27: Temperature, CPU, Memory Utilization Summary report prerequisites
|
Aggregator name |
Monitored object class |
Statistics class |
Statistics collection |
NE types |
|---|---|---|---|---|
|
md-aggr:/md-aggr-base/telemetry-system-info/system |
Card Memory pool Shelf |
telemetry:/base/system-info/system |
Telemetry statistics |
7220 IXR D3 (SRL) 7250 IXR-6 (SRL) 7250 IXR-6e (SRL) 7750 MD SR Classic NE with gRPC telemetry collection enabled Cisco IOS-XR (NCS 7.6.2) Cisco XRV 7.6.2 Juniper vMX Junos 21.4R1.12 |
|
md-aggr:/md-aggr-base/telemetry-hardware/temperature |
Card Port Shelf |
telemetry:/base/hardware/temperature |
Telemetry statistics |
7220 IXR D3 (SRL) 7250 IXR-6 (SRL) 7250 IXR-6e (SRL) 7750 MD SR Classic NE with gRPC telemetry collection enabled Cisco NCS 7.6.2 Cisco XRV 7.6.2 Juniper vMX Junos 21.4R1.12 |
Report characteristics
The following table lists the principal report characteristics.
Table 19-28: Temperature, CPU, Memory Utilization Summary report characteristics
Note: If there is no data for the input date and range, the report displays -1.00 in the table columns.
