Pathway: install and locate specific telemetry types
Purpose
This process shows how to use NSP to set up and locate the telemetry types needed for a sample scenario.
In this scenario, we want to start monitoring the aggregate-dropped packet count for egress traffic on VPRN SAPs on SR OS 24.10 devices. We need to install the required files and confirm the telemetry types we’ll need to create subscriptions for.
This scenario assumes that the adaptation artifact bundle for SR OS 24.10 with the current NSP release has been installed. This installation populates the vendor agnostic and accounting adaptation for SR OS.
This scenario also requires that SR OS device telemetry definitions and telemetry adaptation bundles are downloaded from the Nokia Support Portal; see the artifact guide for the filenames and download paths.
For example, in the first iteration of Release 25.8, the filenames are nsp-telemetry-yang-sros-25_8.zip and nsp-telemetry-cr-ct-sros-4.1.0-rel.0.zip.
Stages
1 |
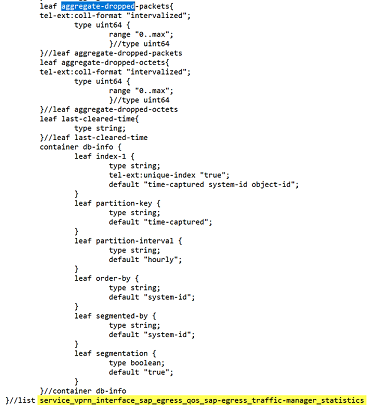
Check the Telemetry Statistic Search Tool:
For our example, the telemetry type we need is not in the NSP definition. Next, we’ll need to see if it’s defined in the device telemetry YANG definitions. |
2 |
Extract the files from the telemetry YANG zip and look for the telemetry types:
|
3 |
Install the sros-service-vprn-telemetry.yang file using yang-file.bash; see “How do I manage MDM model definitions?” in the NSP System Administrator Guide. |
4 |
Now that the YANG file we need has been installed, we can install device adaptation files. For this example, the device adaptation bundle is nsp-telemetry-cr-ct-sros-4.1.0-rel.0.zip. Install the bundle from the Artifacts, Artifact Bundles view; see “How do I install an artifact bundle?” in the NSP Network Automation Guide. |
5 |
Check the Telemetry Statistic Search Tool:
|
We’re done
The counters we need are available in the NSP, and we have the information we need to configure a subscription.