OAM Performance Management Infrastructure
This chapter describes the OAM Performance Management Infrastructure.
Topics in this chapter include:
Applicability
The chapter is initially written for SR OS Release 16.0.R7, but the MD-CLI in the current edition is based on SR OS Release 25.3.R2. This chapter provides information for the configuration of base OAM Performance Management (OAM-PM) components, common to all the supported tests. This chapter does not describe technology-specific test criteria.
Overview
OAM-PM infrastructure provides a common methodology to launch test PDUs that have been purpose-built for delay and loss metrics. The implementation provides a set of transmission, reception, processing, and reporting mechanisms for performance tools supported under the infrastructure. This common infrastructure allows for performance reporting of consistent metrics at the service and network level, regardless of service type (Layer 2 or Layer 3) or transport (Ethernet, IP, or MPLS).
Delay metric results are mapped to counters that represent configured bins, each of which contain a range of results. In addition to the binning function, various delay metrics report minimum, averages, and maximums. Results are reported and mapped for round-trip, forward, and backward measurements. The three key metrics for delay include:
-
Frame Delay (FD): Time between applicable timestamps
-
InterFrame Delay Variation (IFDV): Difference in delay between adjacent PDUs. This value represents the absolute value of the result.
-
Frame Delay Range (FDR): PDU distances from the minimum measured or estimated in that measurement interval
Single-ended loss tools measure both forward and backward directions between peers, representing a unidirectional result. Frame Loss Ratio (FLR) reports the minimum and maximum observed values for the small samples used for loss comparison, and the average covering the overall measurement interval. Reliability metrics comprise availability, unavailability, high-loss intervals (sample slices "delta-t" where loss exceeds the configured threshold), and consecutive high-loss intervals. The reliability metrics are meant to enhance existing availability operational methods that use trouble tickets, alerts, alarms, correlation, and so on, to determine availability. Lost packets that cause recognized unavailability times, including undetermined times, are not included in FLR because they are counted toward unavailability.
Threshold Crossing Alarms (TCAs) can be configured for both delay and loss results, with the possibility to exclude outlying delay values based on the unique requirements of the network.
Results are stored in volatile system memory, written as discrete non-overlapping data sets that align with the configured measurement interval. The results stored in volatile memory may be polled. The completed session results can be recorded to non-volatile memory using accounting policies. These non-volatile results are stored in XML files and can be retrieved using file transfer protocols. The number of measurement intervals stored in non-volatile memory is configurable. The file system and accounting process are mentioned for completeness, but are not the focus of this chapter.
OAM-PM sessions are the basis for configuring and linking all the test-specific information in one location.
Common reporting nomenclature is used regardless of the configured test family. Although technologies may use different terminology, such as packet versus frame, the OAM-PM infrastructure uses single common normalized terms. This commonality simplifies the storage, reporting, collection, and the integration and higher-level analytics. The common approach provides significant operational and management optimization.
Configuration
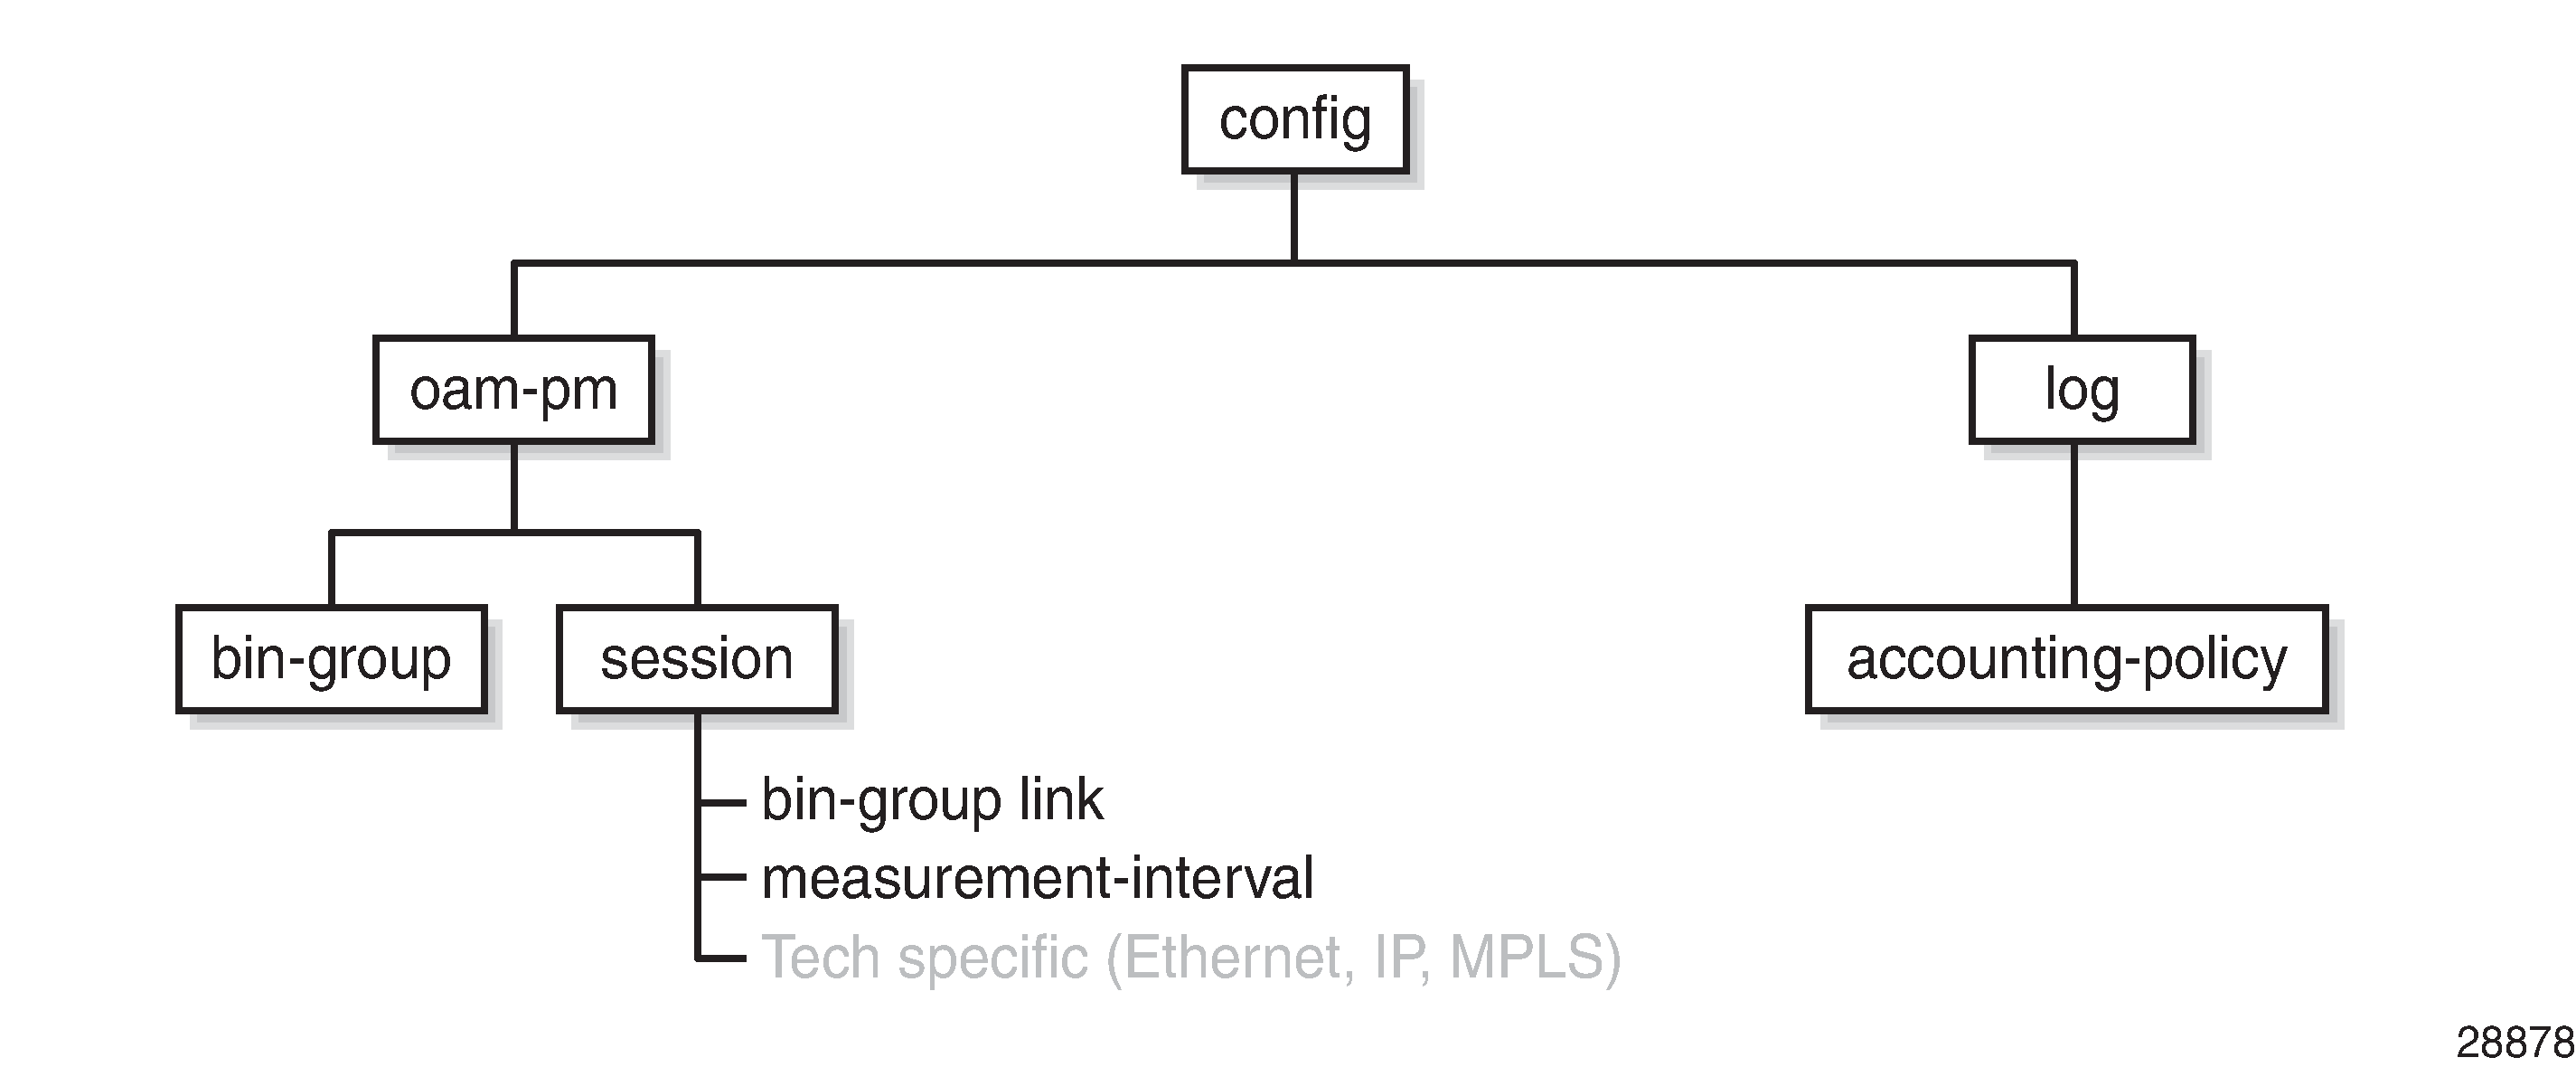
Most of the configuration elements for the infrastructure components are directly located under the OAM-PM hierarchy. However, there are some linkages to other optional subsystems, such as accounting policies. Configuration tree provides the topics that are included in the configuration section. The "Tech specific (Ethernet, IP, MPLS)" block has been grayed out, because it is not included in this chapter.
Bin groups
The configurable ranges are based on the unique requirements of the session: delay metrics, direction (round-trip, forward, or backward), measurements of interest, critical measurement markers, network behavior, thresholds of concern, and likely many more operator-specific requirements. Bin groups are only used to store delay metric results.
A bin group can belong to multiple sessions. A session refers to only one bin group.
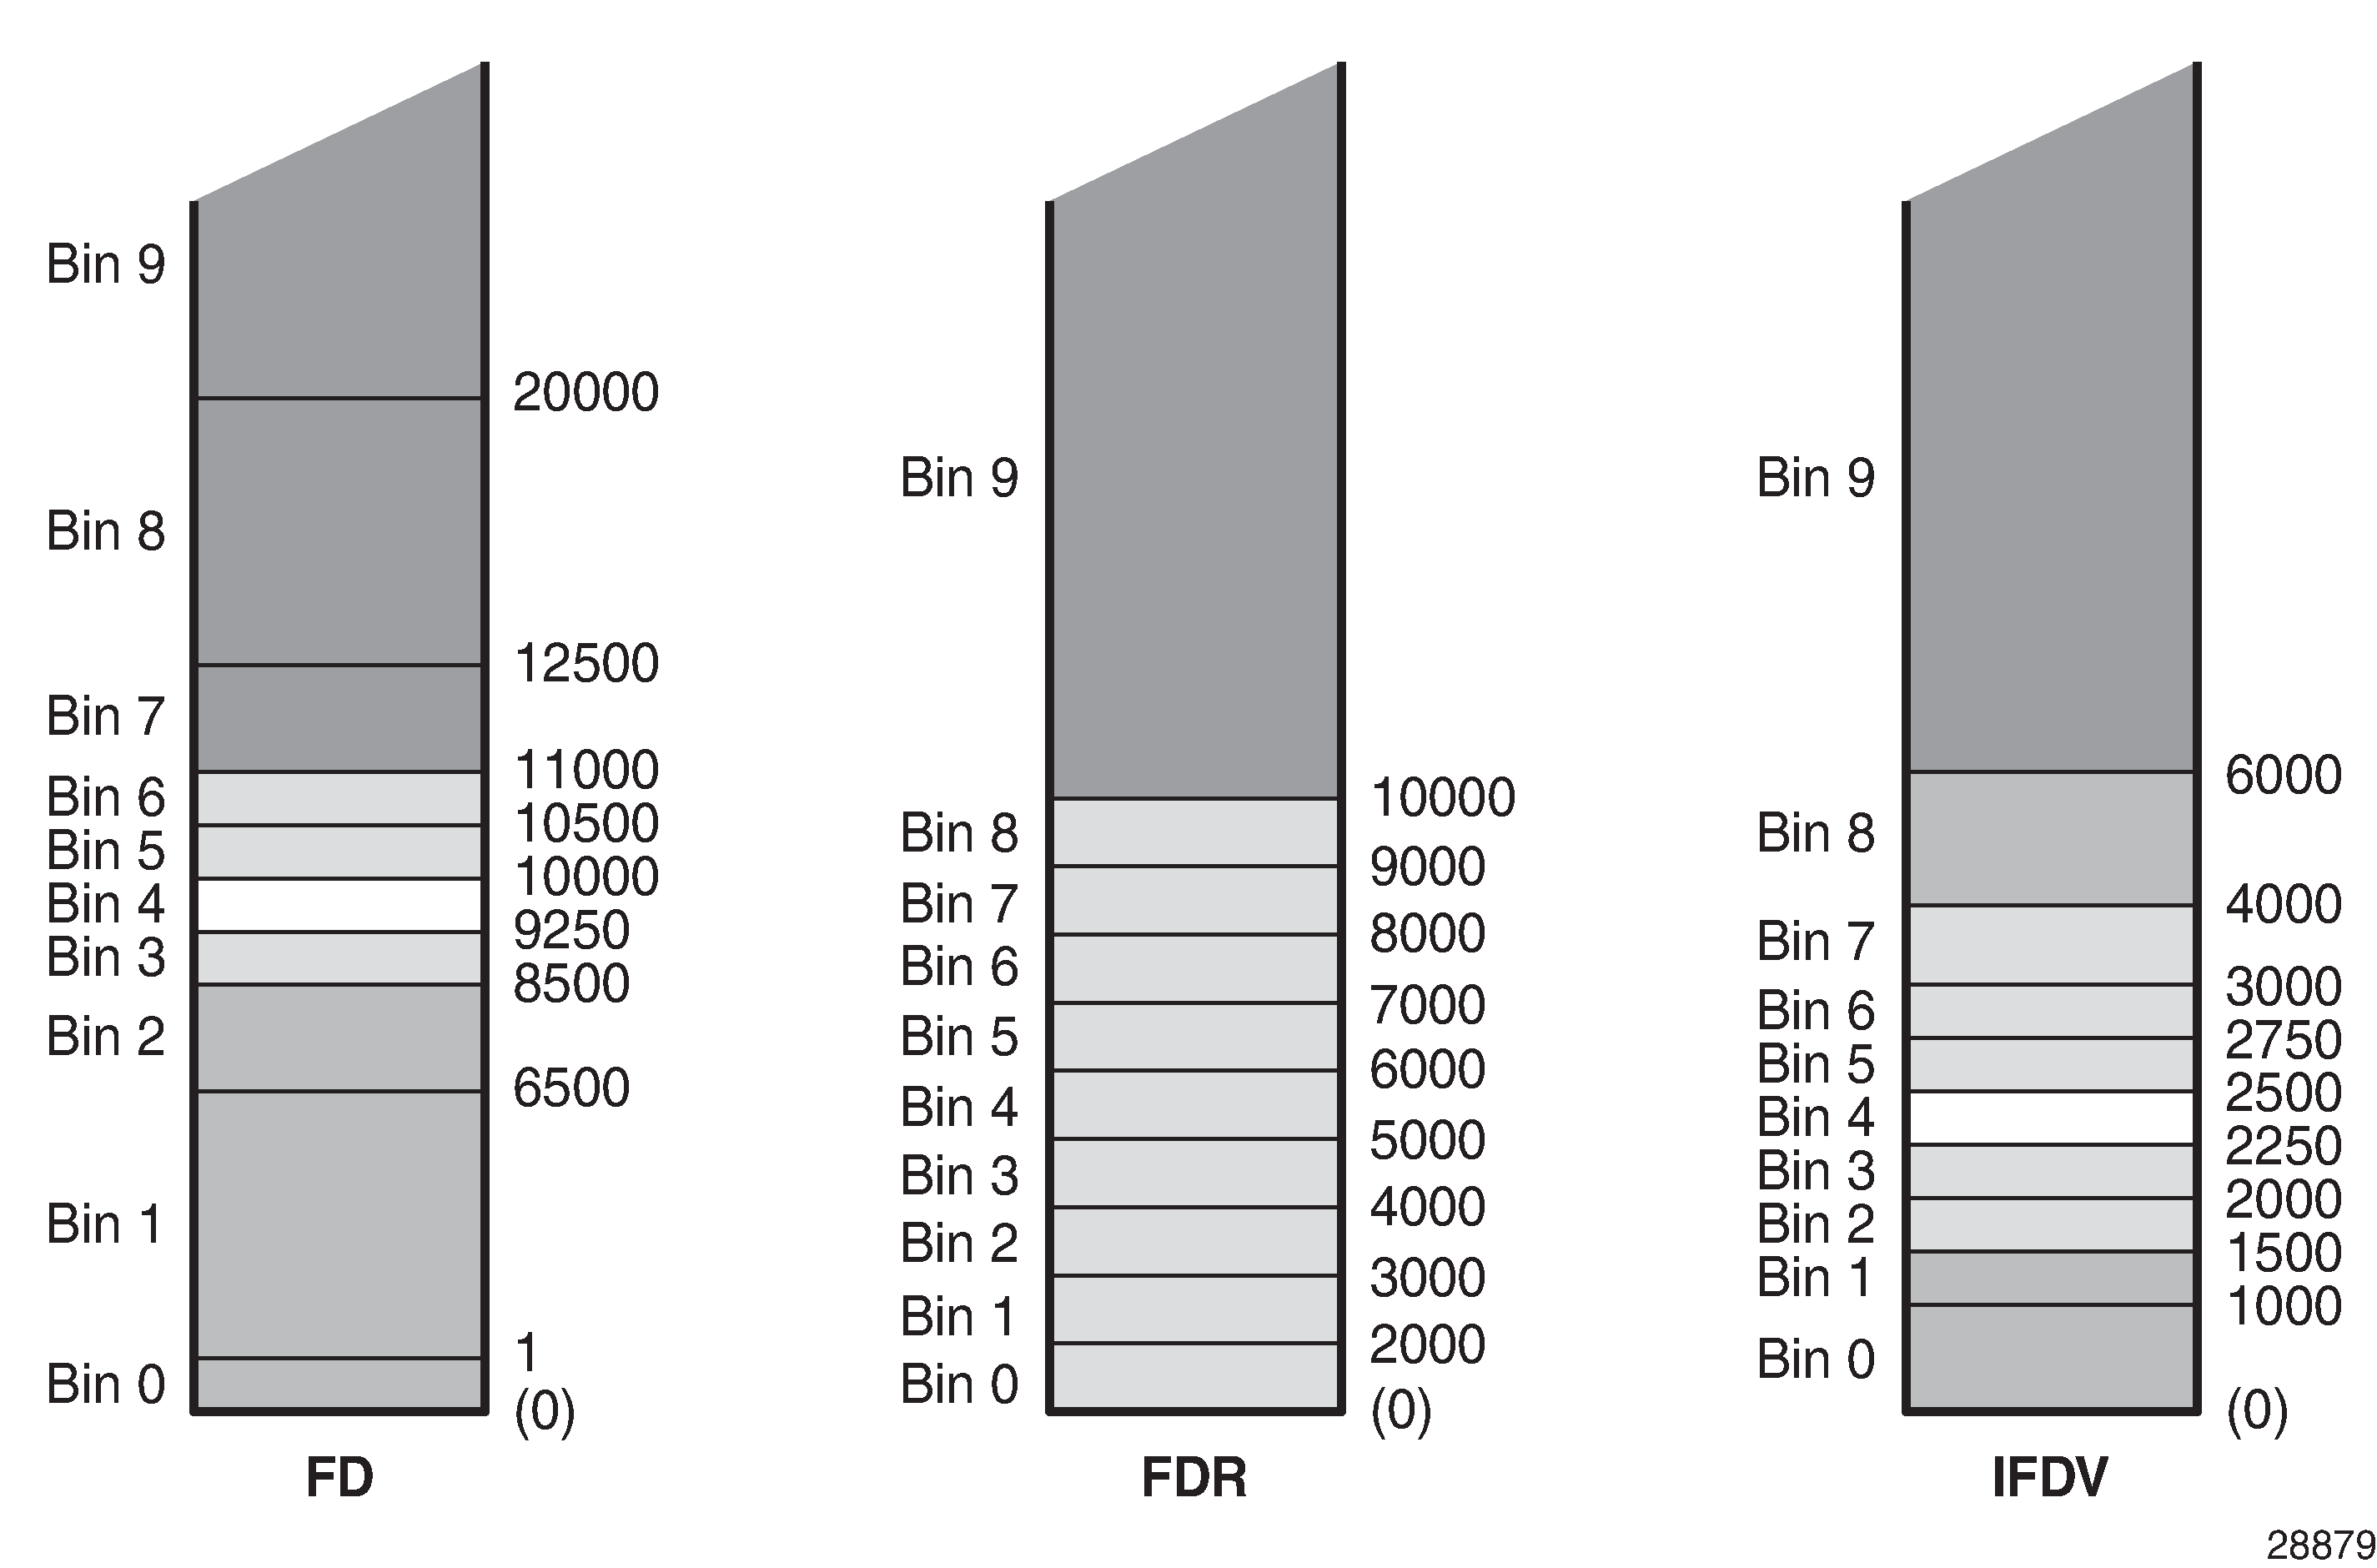
Per delay metric (FD, IFDV, and FDR), each bin group contains a maximum of ten bins. Higher-numbered bins must have higher ranges than lower-numbered bins. Default ranges for unconfigured bins within the bin count defaults are 5000 microseconds times the bin number. The range of results stored in the bin is based on the lower bound of that bin and the lower bound of the next higher adjacent bin, with bin 0 having an unchangeable implicit lower bound 0.
Graphical representation of bin group 3 includes shading to demonstrate the importance of the bins. Dark gray shows the results furthest from the objective. These results, although very important to overall reporting and declaration for meeting the objective, should be judged differently than the light gray results. The light gray results are near enough to the objective that adjusting various network options may cause these results to fall into the objective range. The unshaded area of the range represents the objective range. In this case, FDR is only being recorded for interest purposes and has no directives.
The configuration commands required to create the preceding representation are as follows:
configure {
    oam-pm {
        bin-group 3 {
            admin-state enable
            bin-type fd {
                bin 1 {
                    lower-bound 1
                }
                bin 2 {
                    lower-bound 6500
                }
                bin 3 {
                    lower-bound 8500
                }
                bin 4 {
                    lower-bound 9250
                }
                bin 5 {
                    lower-bound 10000
                }
                bin 6 {
                    lower-bound 10500
                }
                bin 7 {
                    lower-bound 11000
                }
                bin 8 {
                    lower-bound 12500
                }
                bin 9 {
                    lower-bound 20000
                }
            }
            bin-type fdr {
                bin 1 {
                    lower-bound 2000
                }
                bin 2 {
                    lower-bound 3000
                }
                bin 3 {
                    lower-bound 4000
                }
                bin 4 {
                    lower-bound 5000
                }
                bin 5 {
                    lower-bound 6000
                }
                bin 6 {
                    lower-bound 7000
                }
                bin 7 {
                    lower-bound 8000
                }
                bin 8 {
                    lower-bound 9000
                }
                bin 9 {
                    lower-bound 10000
                }
            }
            bin-type ifdv {
                bin 1 {
                    lower-bound 1000
                }
                bin 2 {
                    lower-bound 1500
                }
                bin 3 {
                    lower-bound 2000
                }
                bin 4 {
                    lower-bound 2250
                }
                bin 5 {
                    lower-bound 2500
                }
                bin 6 {
                    lower-bound 2750
                }
                bin 7 {
                    lower-bound 3000
                }
                bin 8 {
                    lower-bound 4000
                }
                bin 9 {
                    lower-bound 6000
                }
            }
        }
In addition to the basic configuration, three advanced features expand the binning infrastructure:
-
Delay TCA (delay-event) against a threshold
-
Exclude bin counts from the delay TCA (exclude-lowest-bin)
-
Exclude bins from the computed averages (exclude-from-avg)
Individual results are still mapped and accounted for in the appropriate bins. However, excluded results are counted toward the event threshold or included in the rolling average, if explicitly configured to exclude. The following command configures the delay event:
configure {
    oam-pm {
        bin-group 3 {
            bin-type fd {
                delay-event {forward|backward|round-trip} {
                    lowest-bin <bin-number>
                    raise-threshold <raise-threshold>
                    clear-threshold <clear-threshold>
The delay TCA is per bin type (FD, IFDV, FDR), and requires the direction {forward | backward | round-trip}, the lowest-bin <bin-number>, the raise-threshold <raise-threshold>, and a declaration of stateful [clear-threshold <clear-threshold>] or stateless (omission of the clear-threshold option).
The lowest-bin <bin-number> is the result count including the specified bin and all higher bins. When the total count in that bin and all higher bins equals the configured threshold, the TCA is triggered.
Stateful processing requires a subsequent measurement interval to complete with a count in the specified bin and all higher bins at or below the clear threshold. If the clear threshold option is omitted, the TCA is stateless. Stateless TCA events are not carried over to subsequent measurement intervals. Each measurement interval is unique unto itself. Individual TCAs are raised once at the time of the event during a measurement interval.
The delay-event-exclusion allows bins to be removed from the event count. This configuration is per bin type (FD, IFDV, FDR), and requires the direction {forward|backward|round-trip} and the lowest-bin <bin-number>. The lowest-bin excludes the specified bin and all higher bins from the event count.
The following configuration expands bin-group 3 bin-type fd to include delay-event TCA and a delay-event-exclusion. When a test using bin group 3 counts 30 results in bin 7 and 8, it generates a log event indicating that the threshold has been reached. Bin 9 results are not considered against the delay event TCA because of the exclusion statement.
configure {
    oam-pm {
        bin-group 3 {
            bin-type fd {
                delay-event round-trip {
                    lowest-bin 7
                    raise-threshold 30
                    clear-threshold 0
                    exclude-lowest-bin 9
                }
Some networks include elements with software clocks and possible transmission style equipment that performs circuit establishment on first packet reception. Because these can provide non-representative delay results, these results are typically excluded from the computed averages.
The exclude-from-avg configuration is per bin type (FD, IFDV, FDR) and requires the direction (forward, backward, or round-trip) and the bins with their bin numbers. The results in these bins are specifically excluded from the computed average. The bins to be excluded should include the bins that have been configured to track obvious anomalies.
The following configuration further expands bin-group 3 bin-type fd to exclude-from-avg bins 0 and 9.
configure {
    oam-pm {
        bin-group 3 {
            bin-type fd
                exclude-from-avg round-trip {
                    bins "0,9"
The complete configuration for bin group 3, including the TCA and exclude configuration, is shown here for completeness.
[ex:/configure oam-pm bin-group 3]
A:admin@PE-1# info
    admin-state enable
    bin-type fd {
        delay-event round-trip {
            lowest-bin 7
            raise-threshold 30
            clear-threshold 0
            exclude-lowest-bin 9
        }
        exclude-from-avg round-trip {
            bins "0,9"
        }
        bin 1 {
            lower-bound 1
        }
        bin 2 {
            lower-bound 6500
        }
        bin 3 {
            lower-bound 8500
        }
        bin 4 {
            lower-bound 9250
        }
        bin 5 {
            lower-bound 10000
        }
        bin 6 {
            lower-bound 10500
        }
        bin 7 {
            lower-bound 11000
        }
        bin 8 {
            lower-bound 12500
        }
        bin 9 {
            lower-bound 20000
        }
    }
    bin-type fdr {
        bin 1 {
            lower-bound 2000
        }
        bin 2 {
            lower-bound 3000
        }
        bin 3 {
            lower-bound 4000
        }
        bin 4 {
            lower-bound 5000
        }
        bin 5 {
            lower-bound 6000
        }
        bin 6 {
            lower-bound 7000
        }
        bin 7 {
            lower-bound 8000
        }
        bin 8 {
            lower-bound 9000
        }
        bin 9 {
            lower-bound 10000
        }
    }
    bin-type ifdv {
        bin 1 {
            lower-bound 1000
        }
        bin 2 {
            lower-bound 1500
        }
        bin 3 {
            lower-bound 2000
        }
        bin 4 {
            lower-bound 2250
        }
        bin 5 {
            lower-bound 2500
        }
        bin 6 {
            lower-bound 2750
        }
        bin 7 {
            lower-bound 3000
        }
        bin 8 {
            lower-bound 4000
        }
        bin 9 {
            lower-bound 6000
        }
    }
There are several show commands that provide display-level information for bin groups. The power of some of the show commands is revealed when tests are mapped to the bin group. Background tests outside the scope of this chapter have been added to enhance the usefulness of this section.
The show oam-pm bin-group <bin-group-number> detail command provides information about the configured bin groups.
The base command with no options shows the following bin group information; the description, the admin state, and the ranges for each configured bin type (FD, FDR, IFDV) are displayed.
[/]
A:admin@PE-1# show oam-pm bin-group

-------------------------------------------------------------------------------
Configured Lower Bounds for Delay Tests, in microseconds
-------------------------------------------------------------------------------
Group Description                    Admin Bin     FD(us)    FDR(us)   IFDV(us)
-------------------------------------------------------------------------------
1     OAM PM default bin group (not*    Up   0          0          0          0
                                             1       5000       5000       5000
                                             2      10000          -          -
-------------------------------------------------------------------------------
2                                       Up   0          0          0          0
                                             1       1000       1000        500
                                             2       2000       1500        750
                                             3       3000       2000       1000
                                             4       4000       2500       1250
                                             5       5000       3000       1500
                                             6       6000       3500       1750
                                             7       7000       4000       2000
                                             8       8000       4500       2250
                                             9       9000       5000       2500
-------------------------------------------------------------------------------
3                                       Up   0          0          0          0
                                             1          1       2000       1000
                                             2       6500       3000       1500
                                             3       8500       4000       2000
                                             4       9250       5000       2250
                                             5      10000       6000       2500
                                             6      10500       7000       2750
                                             7      11000       8000       3000
                                             8      12500       9000       4000
                                             9      20000      10000       6000
-------------------------------------------------------------------------------
* indicates that the corresponding row element may have been truncated.
To display TCA and exclude information, filter on a single bin-group-number and include the detail option, as follows:
[/]
A:admin@PE-1# show oam-pm bin-group 3 detail

-------------------------------------------------------------------------------
Configured Lower Bounds for Delay Tests, in microseconds
-------------------------------------------------------------------------------
Group Description                    Admin Bin     FD(us)    FDR(us)   IFDV(us)
-------------------------------------------------------------------------------
3                                       Up   0          0          0          0
                                             1          1       2000       1000
                                             2       6500       3000       1500
                                             3       8500       4000       2000
                                             4       9250       5000       2250
                                             5      10000       6000       2500
                                             6      10500       7000       2750
                                             7      11000       8000       3000
                                             8      12500       9000       4000
                                             9      20000      10000       6000
-------------------------------------------------------------------------------

---------------------------------------
Bins Excluded from Average
---------------------------------------
Bin Type     Direction            Bins
---------------------------------------
FD          round-trip             0,9
---------------------------------------

--------------------------------------------------------------------------
Delay Events Configured
--------------------------------------------------------------------------
Bin Type    Direction    Lowest Bin    Lower Bound (us)    Raise    Clear
--------------------------------------------------------------------------
FD         round-trip             7               11000       30        0
--------------------------------------------------------------------------

--------------------------------------------------------------------
Bins Excluded from Delay Event Count
--------------------------------------------------------------------
Bin Type     Direction     Lowest Excluded Bin     Lower Bound (us)
--------------------------------------------------------------------
FD          round-trip                       9                20000
--------------------------------------------------------------------
The show oam-pm bin-group-using [bin-group <bin-group-number>] command shows a mapping of sessions to bin groups. The base command shows all mappings, as follows. Adding the optional bin-group <bin-group-number> command limits the output to the specified bin group.
[/]
A:admin@PE-1# show oam-pm bin-group-using

=========================================================================
OAM Performance Monitoring Bin Group Configuration for Sessions
=========================================================================
Bin Group       Admin   Session                            Session State
-------------------------------------------------------------------------
1               Up      ip-rtr-telemetry-streaming                   Act
-------------------------------------------------------------------------
2               Up      mpls-dm-rsvp-PE-2-PE-1                       Act
                        mpls-dm-static-PE-2-PE-1                     Act
                        mpls-dm-rsvp-PE-2-PE-1-hop1                  Act
                        mpls-dm-rsvp-auto-PE-2-PE-1                  Act
                        mpls-dm-static-PE-2-PE-1-hop1                Act
-------------------------------------------------------------------------
3               Up      ip-lpb101-RSVP-LSP                           Act
                        ip-lpb111-SR-TE-LSP                          Act
                        ip-rtr-int-PE-1-PE-2                         Act
                        eth-port-int-PE-2-P-3                        Act
                        ip-circuit-service-vprn2                     Act
                        eth-circuit-service-vpls3                    Act
                        eth-circuit-service-epipe1                   Act
                        eth-circuit-service-epipe1-2                 Act
                        eth-circuit-service-epipe1-3                 Act
-------------------------------------------------------------------------
=========================================================================
In summary, the bin group contains three configurable bin types: FD, IFDV, and FDR. Results are mapped to the counter in the appropriate bin, considering any configured TCA or event exclusions. The various delay metric average computations can be influenced by an optional configuration that excludes specific results from the calculation.
Session
The session is the container bringing the individual testing elements together. The session <session-name> identifies the collection as one comprehensive entity. The test family choice <ethernet|ip|mpls> defines the type of technology test that can be configured within that session and enforces various technology-specific configuration rules. The rules ensure that only technology relevant to the configuration parameter matching the test family can be configured.
*[ex:/configure oam-pm session "test"]
A:admin@PE-1# ?

 Immutable fields      - session-type

 apply-groups          - Apply a configuration group at this level
 apply-groups-exclude  - Exclude a configuration group at this level
 bin-group             - Bin group for the session
 description           - Text description
 measurement-interval  + Enter the measurement-interval list instance
 session-type          - Session type

 Mandatory choice: test-family-choice
 ethernet             :+ Enable the ethernet context
 ip                   :+ Enable the ip context
 mpls                 :+ Enable the mpls context
The session-type {proactive|on-demand} (as follows) defines whether the session is always on, proactive, or must be started manually using the oam oam-pm session <session-name> test-type {dm|dmm|lmm|slm|twamp-light} action {start|stop} command, on demand.
*[ex:/configure oam-pm session "test"]
A:admin@PE-1# session-type ?

 session-type <keyword>
 <keyword> - (proactive|on-demand)
 Default   - proactive

 'session-type' is: immutable

    Session type

    Warning: Modifying this element recreates 'configure oam-pm session "test"'
             automatically for the new value to take effect.
A bin group can be assigned to the session. If no bin group is specified, the default bin group bin-group 1 is used. A session can support multiple different tests from the same test family. If the test being configured is a loss only test, there is no need to add a bin group to the session. Loss tests do not use bin groups. The following configuration defines a session "ip-rtr-int-PE-1-PE-2" with session type proactive, bin group 3, and test family IP:
configure {
    oam-pm {
        session "ip-rtr-int-PE-1-PE-2" {
            session-type proactive
            bin-group 3
            ip {
            ---snip---        # technology-specific test parameters are outside the scope
            }
A description can be added to the session to provide more administrative information, as follows:
configure {
    oam-pm {
        session "ip-rtr-int-PE-1-PE-2" {
            description "ip circuit connecting PE-1 to PE-2"
The final step before configuring the technology-specific test parameters within the session is defining the size of the sample window: the measurement interval. Each session requires at least one measurement interval to be assigned. There are five fixed-size measurement intervals, typical for service level agreement: measurement-interval {15-mins|1-hour|1-day|5-mins|1-min}.
It is possible to assign more than one measurement interval to a session. Each measurement interval is updated independently and maintains its own statistics and memory allocation. Nokia recommends that only a single measurement interval be configured per session to avoid unnecessary processing and memory consumption. The value of configuring multiple measurement intervals is negligible. Higher-level systems can perform the necessary analytics and data merges.
The raw measurement interval is an always-on, never-ending collection of samples since the start or last clearing of the raw measurement interval. If the operator does not configure a measurement interval within the session, the raw measurement interval is the only one applied. An example of configuring the measurement interval is as follows:
configure {
    oam-pm {
        session "ip-rtr-int-PE-1-PE-2" {
            measurement-interval 5-mins {
The results are stored in volatile system memory, written as discrete non-overlapping datasets that align with the measurement interval time configuration.
The following does not apply to the raw measurement interval. This measurement interval has no configuration options and is only stored in non-volatile memory. Its intent is for troubleshooting, not SLA measurement.
The number of stored completed datasets in non-volatile memory is configurable. The results stored in volatile memory are available through polling tools. Optionally, but highly recommended, the completed session results can be written to the file system. The file system and accounting process are not the focus of this chapter. However, the following basic context is provided for completeness.
Accounting policies are defined as part of the logging function. The location defines where to store the file. The collection interval defines how often the process collects the completed records. The record type indicates the types of records to be collected, in the case of OAM-PM complete-pm is required. The rollover defines when the file is closed. The retention defines how long the closed file is kept.
This chapter provides the following basic sample configuration with mandatory requirements to write the appropriate OAM-PM record and maintain the file.
configure {
    log {
        file "19" {
            description "oam-pm file maintenance options id 19"
            rollover 30
            retention 2
            compact-flash-location {
                primary cf3
            }
        }
        accounting-policy 9 {
            admin-state enable
            description "oam-pm accounting policy 19"
            collection-interval 10
            record complete-pm
            destination {
                file "19"
            }
        }
After the accounting policy is configured, the session can use that configuration, as follows:
configure {
    oam-pm {
        session "ip-rtr-int-PE-1-PE-2" {
            description "ip circuit connecting PE-1 to PE-2"
            session-type proactive
            bin-group 3
            ip {
---snip---        # technology-specific test parameters outside the scope of the chapter
            }
            measurement-interval 5-mins {
                accounting-policy 9
            }
The amount of system memory consumed by intervals stored in volatile memory can be reduced if write to file is the selected collection method. It is then possible to reduce the number of intervals stored because the reliance on data collection routines from volatile memory is reduced. The data is available from the non-volatile files system and remains for the interval-stored <intervals> count.
When the allocation reaches the maximum configured value, the oldest dataset is removed to make room for the newest. Nokia suggests using accounting policy to reduce the intervals stored when writing results to the XML file, balancing the requirements of the environment. The following configuration shows that 24 five-minute measurement intervals are stored in volatile memory.
configure {
    oam-pm {
        session "ip-rtr-int-PE-1-PE-2" {
            description "ip circuit connecting PE-1 to PE-2"
            session-type proactive
            bin-group 3
            ip {
---snip---
            }
            measurement-interval 5-mins {
                accounting-policy 9
                intervals-stored 24
            }
The alignment of the measurement interval to the timing reference is determined by the boundary-type {clock-aligned | test-relative}. Tests start based on their operational state: enabled for proactive, or oam oam-pm session <session-name> test-type {dm|dmm|lmm|slm|twamp-light} action start for on-demand. Clock-aligned measurement intervals align to wall clock time (time of day), starting and stopping on that specific time. For example, a five-minute measurement interval that is clock aligned stops on every five-minute clock occurrence: 5, 10, 15, 20, 25, 30, and so on. A test-relative alignment means that the measurement interval time starts when the test becomes operational, and runs for the length of that interval. For example, if a test becomes operational at two minutes after the hour, the five-minute measurement intervals stops at 7, 12, 17, 22, 27, 32, and so on.
Clock-aligned measurement intervals are typical for proactive sessions. Test-aligned measurement intervals are typically used for on demand sessions. The default boundary-type is shown in the following output.
configure {
    oam-pm {
        session "ip-rtr-int-PE-1-PE-2" {
            description "ip circuit connecting PE-1 to PE-2"
            session-type proactive
            bin-group 3
            ip {
---snip---
            }
            measurement-interval 5-mins {
                accounting-policy 9
                boundary-type clock-aligned     # default value
                intervals-stored 24
            }
The first completed clock-aligned measurement interval typically has the suspect flag set, if it started ten or more seconds after a normally scheduled measurement interval. The suspect flag is also set if a test is stopped ten or more seconds before the end of the regular measurement interval.
The clock-offset option allows for a divergence to be configured from the natural clock starting time. The option provides a method to stagger the measurement interval start with a number of seconds, using the following command:
[ex:/configure oam-pm session "ip-rtr-int-PE-1-PE-2" measurement-interval 5-mins]
A:admin@PE-1# clock-offset ?

 clock-offset <number>
 <number> - <0..86399> - seconds
 Default  - 0

    Offset for a clock-aligned measurement interval
A session allows one of its configured measurement intervals to monitor configured TCA events. Delay events are configured under the bin group and were described earlier. Loss events are configured under the technology-specific test type and not part of this chapter.
Event monitoring reporting can be modified while the bin group is enabled. On modification, existing events and the ability to compute new TCAs wait for the start of a subsequent measurement interval when changes are made during an active measurement interval. If the modification is made in near proximity to the completion of one measurement interval, the introduction of the new TCA may require a further measurement interval to implement the change and restart the TCA computations.
The following configuration example shows that event monitoring is enabled for delay-events and disabled for loss-events, under the measurement-interval 5-min.
configure {
    oam-pm {
        session "ip-rtr-int-PE-1-PE-2" {
            description "ip circuit connecting PE-1 to PE-2"
            bin-group 3
            ip {
---snip---        # technology-specific parameters are outside the scope of the chapter
            }
            measurement-interval 5-mins {
                accounting-policy 9
                boundary-type clock-aligned     # default value
                clock-offset 0                  # default value
                intervals-stored 24
                threshold-cross-alerts {        # event monitoring
                    admin-state enable
                    delay-events true
                    loss-events false            # default value
                }
            }
        }
The infrastructure OAM-PM components are now configured.
The test family attributes are technology-specific parameters that define the test parameters and influence the PDUs. This test-specific configuration is stored under the technology type: IP, Ethernet, or MPLS. Usually, the configuration parameters under this hierarchy include quality of service (QoS), source and destination, interval, padding, transport-specific parameters, and the type of test packet to be transmitted and processed. Technology-specific configurations are outside the scope of this chapter, which is specific to the OAM-PM infrastructure.
There are several show commands that provide display-level information for sessions. The power of some of the show commands are revealed when complete session configurations with technology-specific tests are available. Background tests outside the scope of this chapter have been added to enhance the usefulness of this section.
The command show oam-pm sessions [test-family {ethernet|ip|mpls}] [detectable-tx-errors|event-mon] provides information about the sessions that are configured.
The base command with no options shows the following session information sorted by test family: session name, admin state, mapped bin group, session type, and test types configured under the session. When the test-family option is included, the output is limited to that family.
[/]
A:admin@PE-1# show oam-pm sessions

============================================================================
OAM Performance Monitoring Session Summary for the Ethernet Test Family
============================================================================
Session                          State   Bin Group   Sess Type   Test Types
----------------------------------------------------------------------------
eth-port-int-PE-2-P-3              Act           3   proactive  DMM
eth-circuit-service-vpls3          Act           3   proactive  DMM     SLM
eth-circuit-service-epipe1         Act           3   proactive  DMM LMM SLM
eth-circuit-service-epipe1-2       Act           3   proactive  DMM     SLM
eth-circuit-service-epipe1-3       Act           3   proactive  DMM     SLM
============================================================================

============================================================================
OAM Performance Monitoring Session Summary for the IP Test Family
============================================================================
Session                          State   Bin Group   Sess Type   Test Types
----------------------------------------------------------------------------
ip-lpb101-RSVP-LSP                 Act           3   proactive          TWL
ip-lpb111-SR-TE-LSP                Act           3   proactive          TWL
ip-rtr-int-PE-1-PE-2               Act           3   proactive          TWL
ip-circuit-service-vprn2           Act           3   proactive          TWL
ip-rtr-telemetry-streaming         Act           1   proactive          TWL
============================================================================

============================================================================
OAM Performance Monitoring Session Summary for the MPLS Test Family
============================================================================
Session                          State   Bin Group   Sess Type   Test Types
----------------------------------------------------------------------------
mpls-dm-rsvp-PE-2-PE-1             Act           2   proactive           DM
mpls-dm-static-PE-2-PE-1           Act           2   proactive           DM
mpls-dm-rsvp-PE-2-PE-1-hop1        Act           2   proactive           DM
mpls-dm-rsvp-auto-PE-2-PE-1        Act           2   proactive           DM
mpls-dm-static-PE-2-PE-1-hop1      Act           2   proactive           DM
============================================================================
To display all sessions with detected transmission errors that prevent the transmission of test PDUs, the detectable-tx-errors filter can be added. The following output shows the Ethernet session eth-cfm-31-28-rtr1 with a detectable error "MEP not fully configured or admin down".
[/]
A:admin@PE-1# show oam-pm sessions detectable-tx-errors

===============================================================================
OAM Performance Monitoring Transmit Error Summary: Ethernet Test Family
===============================================================================
                                 Test
Session                          Type                Detectable Transmit Error
-------------------------------------------------------------------------------
eth-cfm-31-28-rtr1               DMM    MEP not fully configured or admin down
===============================================================================

===============================================================================
OAM Performance Monitoring Transmit Error Summary: IP Test Family
===============================================================================
                                 Test
Session                          Type                Detectable Transmit Error
-------------------------------------------------------------------------------
===============================================================================

===============================================================================
OAM Performance Monitoring Transmit Error Summary: MPLS Test Family
===============================================================================
                                 Test
Session                          Type                Detectable Transmit Error
-------------------------------------------------------------------------------
===============================================================================
To display the event monitoring configuration of all sessions, the event-mon filter can be added. The following output shows all the sessions and any related event monitoring configuration and state of the event.
[/]
A:admin@PE-1# show oam-pm sessions event-mon

===============================================================================
OAM Performance Monitoring Event Summary for the Ethernet Test Family
===============================================================================
Event Monitoring Table Legend:
F = Forward,  B = Backward,  R = Round Trip,  A = Aggregate,
- = Threshold Not Config,  c = Threshold Config,  * = TCA Active,  P = Pending
===============================================================================
                                 Test   FD FDR IFDV FLR CHLI HLI UNAV UDAV UDUN
Session                          Type  FBR FBR  FBR  FB  FBA FBA  FBA  FBA  FBA
-------------------------------------------------------------------------------
eth-port-int-PE-2-P-3             DMM  --c ---  ---
eth-circuit-service-vpls3         DMM  --c ---  ---
eth-circuit-service-vpls3         SLM                --  --- ---  ---  ---  ---
eth-circuit-service-epipe1        DMM  --c ---  ---
eth-circuit-service-epipe1        LMM                --  --- ---  ---  ---  ---
eth-circuit-service-epipe1        SLM                --  --- ---  ---  ---  ---
eth-circuit-service-epipe1-2      DMM  --c ---  ---
eth-circuit-service-epipe1-2      SLM                --  --- ---  ---  ---  ---
eth-circuit-service-epipe1-3      DMM  --c ---  ---
eth-circuit-service-epipe1-3      SLM                --  --- ---  ---  ---  ---
===============================================================================

===============================================================================
OAM Performance Monitoring Event Summary for the IP Test Family
===============================================================================
Event Monitoring Table Legend:
F = Forward,  B = Backward,  R = Round Trip,  A = Aggregate,
- = Threshold Not Config,  c = Threshold Config,  * = TCA Active,  P = Pending
===============================================================================
                                 Test   FD FDR IFDV FLR CHLI HLI UNAV UDAV UDUN
Session                          Type  FBR FBR  FBR  FB  FBA FBA  FBA  FBA  FBA
-------------------------------------------------------------------------------
ip-lpb101-RSVP-LSP                TWL  --c ---  ---  --  --- ---  ---  ---  ---
ip-lpb111-SR-TE-LSP               TWL  --c ---  ---  --  --- ---  ---  ---  ---
ip-rtr-int-PE-1-PE-2              TWL  --c ---  ---  --  --- ---  ---  ---  ---
ip-circuit-service-vprn2          TWL  --c ---  ---  --  --- ---  ---  ---  ---
ip-rtr-telemetry-streaming        TWL  --- ---  ---  --  --- ---  ---  ---  ---
===============================================================================

===============================================================================
OAM Performance Monitoring Event Summary for the MPLS Test Family
===============================================================================
Event Monitoring Table Legend:
F = Forward,  B = Backward,  R = Round Trip,  A = Aggregate,
- = Threshold Not Config,  c = Threshold Config,  * = TCA Active,  P = Pending
===============================================================================
                                 Test   FD FDR IFDV FLR CHLI HLI UNAV UDAV UDUN
Session                          Type  FBR FBR  FBR  FB  FBA FBA  FBA  FBA  FBA
-------------------------------------------------------------------------------
mpls-dm-rsvp-PE-2-PE-1             DM  --c ---  ---
mpls-dm-static-PE-2-PE-1           DM  --c ---  ---
mpls-dm-rsvp-PE-2-PE-1-hop1        DM  --c ---  ---
mpls-dm-rsvp-auto-PE-2-PE-1        DM  --c ---  ---
mpls-dm-static-PE-2-PE-1-hop1      DM  --c ---  ---
===============================================================================
The command show oam-pm session <session-name> [all|base|bin-group|event-mon|meas-interval] provides information about an individual session.
The base command with no options, which defaults to all, shows the configuration for the session, technology-specific parameters, the test, the measurement interval specifics, the bin group specifics and event information. The optional filters [all|base|bin-group|event-mon|meas-interval] are used to limit the output to a specific section of the overall output.
[/]
A:admin@PE-1# show oam-pm session "ip-rtr-int-PE-1-PE-2"

-------------------------------------------------------------------------------
Basic Session Configuration
-------------------------------------------------------------------------------
Session Name      : ip-rtr-int-PE-1-PE-2
Description       : ip circuit connecting PE-1 to PE-2
Test Family       : ip                  Session Type       : proactive
Bin Group         : 3
-------------------------------------------------------------------------------

-------------------------------------------------------------------------------
IP Configuration
-------------------------------------------------------------------------------
Source IP Address : 192.0.2.1
Dest IP Address   : 192.0.2.2
Confg Src UDP Port: (Not Specified)     In-Use Src UDP Port: 49154
Dest UDP Port     : 862                 Time To Live       : 255
Forwarding Class  : be                  Profile            : out
DSCP              : resolve             Allow Remark DSCP  : no
Router            : (Not Specified)     Bypass Routing     : no
Egress Interface  : (Not Specified)
Next Hop Address  : (Not Specified)
Do Not Fragment   : no                  Pattern            : 0
Router Instnce:Base
Tunnel Type       : none
-------------------------------------------------------------------------------

-------------------------------------------------------------------------------
TWAMP-Light Test Configuration and Status     Session Sender Type : TWAMP-Light
-------------------------------------------------------------------------------
Test ID           : 2147483648(auto)    Admin State        : Up
Oper State        : Up                  Pad Size           : 0 octets
Pad TLV Size      : Not Applicable      Timestamp Format   : NTP
On-Demand Duration: Not Applicable      On-Demand Remaining: Not Applicable
Interval          : 100 ms              Record Stats       : delay-and-loss
CHLI Threshold    : 5 HLIs              Frames Per Delta-T : 1 frames
Consec Delta-Ts   : 10                  FLR Threshold      : 50%
HLI Force Count   : no                  IPv6 UDP Checksum 0: Disallow
Detectable Tx Err : none
Session Sender ID : Not Applicable
STAMP U Flags Rx  : Not Applicable      STAMP M Flags Rx   : Not Applicable
Str Delay Tmpl:(Not Specified)
-------------------------------------------------------------------------------

-------------------------------------------------------------------------------
5-mins Measurement Interval Configuration
-------------------------------------------------------------------------------
Duration          : 5-mins              Intervals Stored   : 24
Boundary Type     : clock-aligned       Clock Offset       : 0 seconds
Accounting Policy : 9                   Event Monitoring   : enabled
Delay Event Mon   : enabled             Loss Event Mon     : disabled
-------------------------------------------------------------------------------

-------------------------------------------------------------------------------
Configured Lower Bounds for Delay Tests, in microseconds
-------------------------------------------------------------------------------
Group Description                    Admin Bin     FD(us)    FDR(us)   IFDV(us)
-------------------------------------------------------------------------------
3                                       Up   0          0          0          0
                                             1          1       2000       1000
                                             2       6500       3000       1500
                                             3       8500       4000       2000
                                             4       9250       5000       2250
                                             5      10000       6000       2500
                                             6      10500       7000       2750
                                             7      11000       8000       3000
                                             8      12500       9000       4000
                                             9      20000      10000       6000
-------------------------------------------------------------------------------

---------------------------------------
Bins Excluded from Average
---------------------------------------
Bin Type     Direction            Bins
---------------------------------------
FD          round-trip             0,9
---------------------------------------

--------------------------------------------------------------------
Bins Excluded from Delay Event Count
--------------------------------------------------------------------
Bin Type     Direction     Lowest Excluded Bin     Lower Bound (us)
--------------------------------------------------------------------
FD          round-trip                       9                20000
--------------------------------------------------------------------

-------------------------------------------------------------------------------
Delay Events for the TWAMP-Light Test
-------------------------------------------------------------------------------
Bin Type   Direction   LowerBound(us)    Raise    Clear          Last TCA (UTC)
-------------------------------------------------------------------------------
FD        round-trip            11000       30        0                    none
-------------------------------------------------------------------------------

-------------------------------------------------------------------------------
Loss Events for the TWAMP-Light Test
-------------------------------------------------------------------------------
Event Type               Direction      Raise      Clear         Last TCA (UTC)
-------------------------------------------------------------------------------
-------------------------------------------------------------------------------
The stored information in the volatile memory, intervals-stored, can be displayed using the show oam-pm statistics session <session-name> <dm|dmm|lmm|slm|twamp-light> meas-interval {raw|{5-mins|15-mins|1-hour|1-day} interval-number <interval-number> [loss | delay] command. The interval is with reference to the latest session data. The interval-number 1 is current, and previously completed results are incremented from 1, representing their position to current. The [loss|delay] options can only be used for tests that include both loss and delay as part of the PDU; for example, twamp-light. The interval-number is not required when the meas-interval raw is the selected option; there is only one.
[/]
A:admin@PE-1# show oam-pm statistics session "ip-rtr-int-PE-1-PE-2" twamp-light meas-interval 5-mins interval-number 2

------------------------------------------------------------------------------
Start (UTC)       : 2025/05/14 07:04:11          Status          : completed
Elapsed (seconds) : 300                          Suspect         : no
Frames Sent       : 3000                         Frames Received : 3000
------------------------------------------------------------------------------
===============================================================================
TWAMP-LIGHT DELAY STATISTICS

----------------------------------------------------------------------------
Bin Type     Direction     Minimum (us)   Maximum (us)   Average (us)   EfA
----------------------------------------------------------------------------
FD           Forward                205            899            440    no
FD           Backward                84            868            263    no
FD           Round Trip             457           1516            704   yes
FDR          Forward                  0            687            233    no
FDR          Backward                 0            784            179    no
FDR          Round Trip               0           1050            242    no
IFDV         Forward                  0            537             73    no
IFDV         Backward                 0            639             68    no
IFDV         Round Trip               0            680            108    no
----------------------------------------------------------------------------
EfA = yes: one or more bins configured to be Excluded from the Average calc.

---------------------------------------------------------------
Frame Delay (FD) Bin Counts
---------------------------------------------------------------
Bin      Lower Bound       Forward      Backward    Round Trip
---------------------------------------------------------------
0               0 us             0             0             0
1               1 us          3000          3000          3000
2            6500 us             0             0             0
3            8500 us             0             0             0
4            9250 us             0             0             0
5           10000 us             0             0             0
6           10500 us             0             0             0
7           11000 us             0             0             0
8           12500 us             0             0             0
9           20000 us             0             0             0
---------------------------------------------------------------

---------------------------------------------------------------
Frame Delay Range (FDR) Bin Counts
---------------------------------------------------------------
Bin      Lower Bound       Forward      Backward    Round Trip
---------------------------------------------------------------
0               0 us          3000          3000          3000
1            2000 us             0             0             0
2            3000 us             0             0             0
3            4000 us             0             0             0
4            5000 us             0             0             0
5            6000 us             0             0             0
6            7000 us             0             0             0
7            8000 us             0             0             0
8            9000 us             0             0             0
9           10000 us             0             0             0
---------------------------------------------------------------

---------------------------------------------------------------
Inter-Frame Delay Variation (IFDV) Bin Counts
---------------------------------------------------------------
Bin      Lower Bound       Forward      Backward    Round Trip
---------------------------------------------------------------
0               0 us          3000          3000          3000
1            1000 us             0             0             0
2            1500 us             0             0             0
3            2000 us             0             0             0
4            2250 us             0             0             0
5            2500 us             0             0             0
6            2750 us             0             0             0
7            3000 us             0             0             0
8            4000 us             0             0             0
9            6000 us             0             0             0
---------------------------------------------------------------
===============================================================================
===============================================================================
TWAMP-LIGHT LOSS STATISTICS

------------------------------------------------------
                    Frames Sent       Frames Received
------------------------------------------------------
Forward                    3000                  3000
Backward                   3000                  3000
------------------------------------------------------

----------------------------------------------
Frame Loss Ratios
----------------------------------------------
              Minimum     Maximum     Average
----------------------------------------------
Forward        0.000%      0.000%      0.000%
Backward       0.000%      0.000%      0.000%
----------------------------------------------

-------------------------------------------------------------------------------
Availability Counters (Und = Undetermined)
-------------------------------------------------------------------------------
           Available   Und-Avail Unavailable Und-Unavail        HLI       CHLI
-------------------------------------------------------------------------------
Forward         3000           0           0           0          0          0
Backward        3000           0           0           0          0          0
-------------------------------------------------------------------------------
===============================================================================
The meas-interval raw clear and statistics are as follows. It is the only measurement interval that may be cleared.
[/]
A:admin@PE-1# clear oam-pm session "ip-rtr-int-PE-1-PE-2" twamp-light

[/]
A:admin@PE-1# show oam-pm statistics session "ip-rtr-int-PE-1-PE-2" twamp-light meas-interval raw
------------------------------------------------------------------------------
Start (UTC)       : 2025/05/14 07:08:01          Status          : in-progress
Elapsed (seconds) : 24                           Suspect         : yes
Frames Sent       : 241                          Frames Received : 241
------------------------------------------------------------------------------
===============================================================================
TWAMP-LIGHT DELAY STATISTICS

----------------------------------------------------------------------------
Bin Type     Direction     Minimum (us)   Maximum (us)   Average (us)   EfA
----------------------------------------------------------------------------
FD           Forward                274            578            402    no
FD           Backward               147            571            260    no
FD           Round Trip             475            998            662   yes
FDR          Forward                  0            304            117    no
FDR          Backward                 0            424            112    no
FDR          Round Trip               0            516            178    no
IFDV         Forward                  0            247             64    no
IFDV         Backward                 0            334             61    no
IFDV         Round Trip               2            409            103    no
----------------------------------------------------------------------------
EfA = yes: one or more bins configured to be Excluded from the Average calc.

---------------------------------------------------------------
Frame Delay (FD) Bin Counts
---------------------------------------------------------------
Bin      Lower Bound       Forward      Backward    Round Trip
---------------------------------------------------------------
0               0 us             0             0             0
1               1 us           254           254           254
2            6500 us             0             0             0
3            8500 us             0             0             0
4            9250 us             0             0             0
5           10000 us             0             0             0
6           10500 us             0             0             0
7           11000 us             0             0             0
8           12500 us             0             0             0
9           20000 us             0             0             0
---------------------------------------------------------------

---------------------------------------------------------------
Frame Delay Range (FDR) Bin Counts
---------------------------------------------------------------
Bin      Lower Bound       Forward      Backward    Round Trip
---------------------------------------------------------------
0               0 us           262           262           262
1            2000 us             0             0             0
2            3000 us             0             0             0
3            4000 us             0             0             0
4            5000 us             0             0             0
5            6000 us             0             0             0
6            7000 us             0             0             0
7            8000 us             0             0             0
8            9000 us             0             0             0
9           10000 us             0             0             0
---------------------------------------------------------------

---------------------------------------------------------------
Inter-Frame Delay Variation (IFDV) Bin Counts
---------------------------------------------------------------
Bin      Lower Bound       Forward      Backward    Round Trip
---------------------------------------------------------------
0               0 us           261           261           261
1            1000 us             0             0             0
2            1500 us             0             0             0
3            2000 us             0             0             0
4            2250 us             0             0             0
5            2500 us             0             0             0
6            2750 us             0             0             0
7            3000 us             0             0             0
8            4000 us             0             0             0
9            6000 us             0             0             0
---------------------------------------------------------------
===============================================================================
===============================================================================
TWAMP-LIGHT LOSS STATISTICS

------------------------------------------------------
                    Frames Sent       Frames Received
------------------------------------------------------
Forward                     266                   266
Backward                    266                   266
------------------------------------------------------

----------------------------------------------
Frame Loss Ratios
----------------------------------------------
              Minimum     Maximum     Average
----------------------------------------------
Forward        0.000%      0.000%      0.000%
Backward       0.000%      0.000%      0.000%
----------------------------------------------

-------------------------------------------------------------------------------
Availability Counters (Und = Undetermined)
-------------------------------------------------------------------------------
           Available   Und-Avail Unavailable Und-Unavail        HLI       CHLI
-------------------------------------------------------------------------------
Forward          266           0           0           0          0          0
Backward         266           0           0           0          0          0
-------------------------------------------------------------------------------
===============================================================================
Conclusion
OAM-PM is a powerful performance management function. It uses a common architecture to configure, process, and report on technology-specific performance management tools for Ethernet, IP, and MPLS.