Node Availability Details report
Node Availability Details report overview
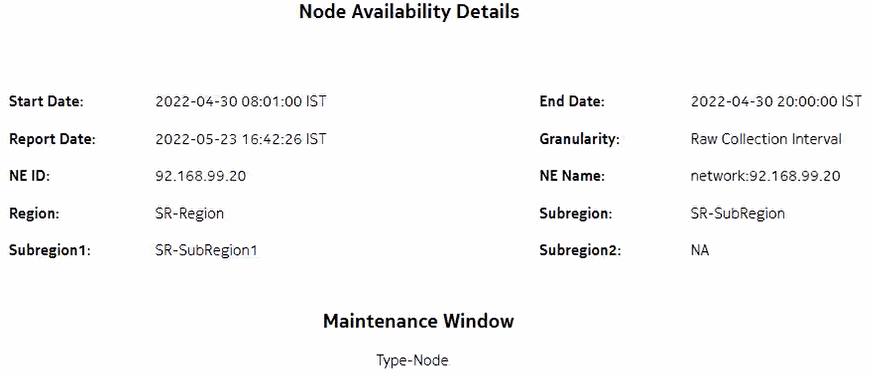
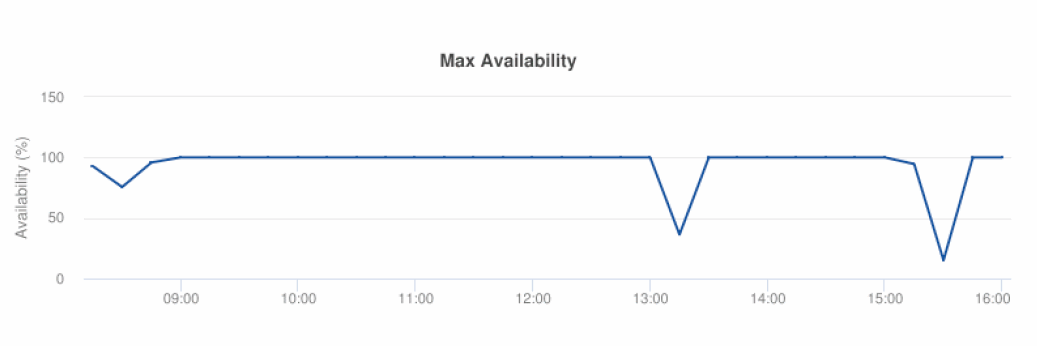
The Node Availability Details report shows availability information for NEs.
Use cases
Service level agreement—Use the report to validate that NE availability meets agreed targets.
Troubleshooting—Use the report to determine if an NE is currently, or has previously, been unavailable.
Prerequisites
To create the Node Availability Details report, NE availability must be determined. An availability framework computes periodic outage time and outage counts from state change records contained in the auxiliary database data dictionary. These periodic values are aggregated to determine the availability of an NE over a period of time. A periodic table tracks the activity state and availability of an NE. The availability framework supports the creation of an availability table that aggregates the data in the periodic table based on the periodic synchronization time configured on the system. The object synchronization interval for tables registered for periodic calculation can be configured to run every 15 min (separate from the regular object synchronization task) by configuring analyticsMODictPeriodicSyncTime in the nms-server.xml file.
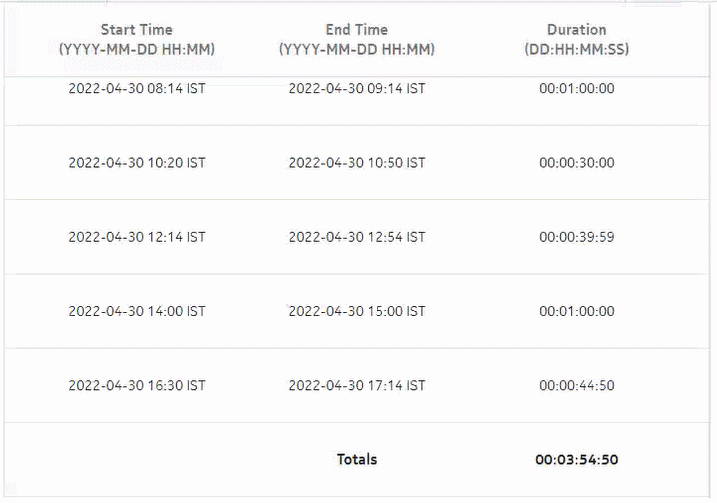
Populate the maintenance window table in the auxiliary database with details of NE and Service maintenance; see Analytics maintenance window table. The report will run if the table is not created or empty; however, maintenance windows are treated as down time when availability is calculated.
How do I synchronize the Analytics data dictionary table data with the NFM-P?
-
Open the nms-server.xml file using a plain-text editor.
Note: Service-disruption hazard
Contact your technical support representative before you attempt to modify the nms-server.xml file. Modifying the nms-server.xml file can have serious consequences that can include service disruption.
-
Add the following tag inside the <samauxdb> </samauxdb> tag:
<samauxdb analyticsMODictPeriodicSyncTime="15">
For example:
<samauxdb
AAkeysafe=”0”
analyticsMODictPeriodicSyncTime=”15”
enabled=”true”
ipaddress=”198.51.100.0”
oamTestResultEnabled=”true”
sysKeysafe=”0” />
-
If the main server is a standalone server, or the primary server is in a redundant deployment, enter the following:
bash$ ./nmsserver.bash read_config ↵
The main server reads the nms-server.xml file and puts the configuration change into effect.
End of steps
Report characteristics
The following table lists the principal report characteristics.


