Interface Utilization Details report
Interface Utilization Details report overview
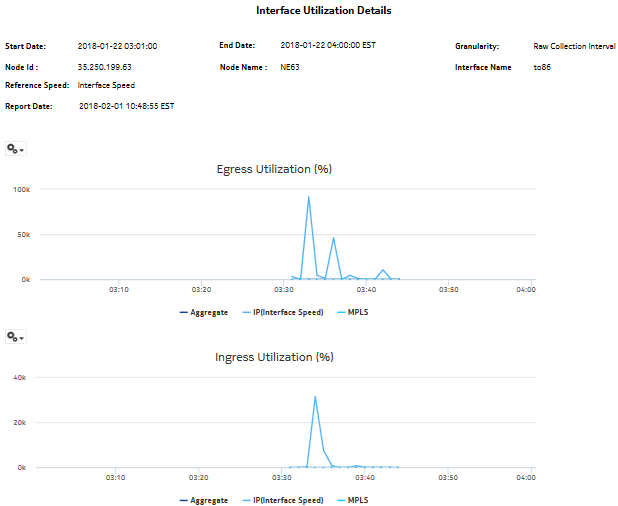
The Interface Utilization Details report shows utilization details for a selected IGP interface. The report can be run on its own or as a drill-down from a Link Utilization report.
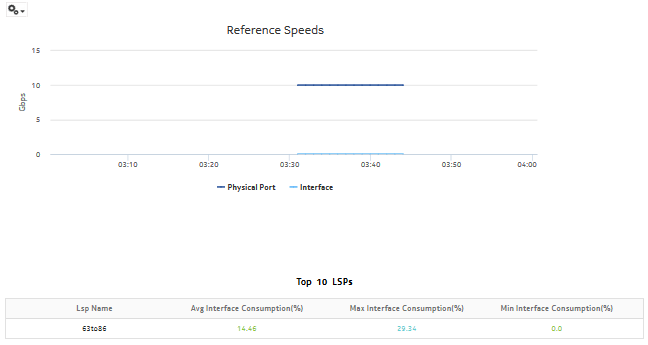
The default display is a set of graphs and a table showing ingress, egress utilization, reference speeds, and percentage interface consumption. By default the table is sorted by average egress interface consumption in decreasing value order (worst first).
Percentage interface consumption is based on average MPLS interface throughput divided by average LSP throughput.
The results in the table are colored based on interface consumption percentage ranges:
Use cases
Capacity planning—Use the report to examine interface utilization patterns for planning future capacity requirements.
Prerequisites
For an Interface Utilization Details Report to be created for an interface, the Prerequisites for a Link Utilization report must be performed.
To view the report for granularities other than raw data, the aggregation rules must be enabled; see How do I configure analytics aggregation?. The following table describes the aggregation rules and the accounting policies that must be configured for the NEs on which statistics are to be collected; see the NSP NFM-P Statistics Management Guide for information about configuring an accounting policy.
Table 14-29: Interface Utilization Details report prerequisites
|
Aggregator name |
Monitored object class |
Statistics class |
Statistics collection |
Details (MIB name) |
NE types |
|---|---|---|---|---|---|
|
Ip Interface Stats Aggregator |
rtr.Network Interface |
rtr.IpInterfaceStats |
Performance statistics |
vRtrIfStatsEntry |
7250 IXR 7750 SR Note: 7210 SAS is not supported |
|
Ip Interface Additional Stats Aggregator |
rtr.Network Interface |
rtr.IpInterfaceAdditionalStats |
Performance statistics |
vRtrIfStatsExtEntry |
7250 IXR 7750 SR Note: 7210 SAS is not supported |
|
SAR Ip Interface Stats Aggregator |
rtr.Network Interface |
rtr.SarIpInterfaceStats |
Performance statistics |
— |
7705 SAR 7705 SAR Hm Note: 7210 SAS is not supported |
|
Mpls Interface Stats Aggregator |
rtr.Network Interface |
mpls.MplsInterfaceStats |
Performance statistics |
vRtrMplsIfStatEntry |
7210 SAS 7250 IXR 7705 SAR 7705 SAR Hm 7750 SR Omnisystem NEs |
|
MPLS LSP Egress Stats Aggregator |
rtr.Network Interface |
mpls.MplsLspEgressStats |
Performance statistics |
— |
7705 SAR 7705 SAR Hm 7750 SR Note: 7210 SAS is not supported |
Report characteristics
The following table lists the principal report characteristics.

