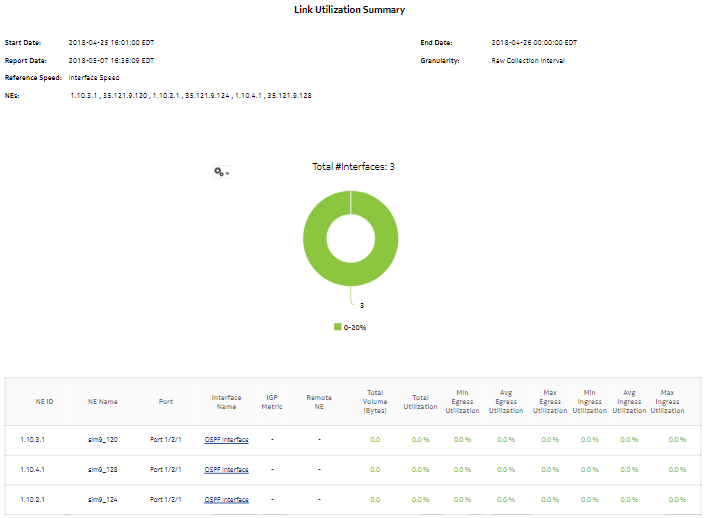
Link Utilization Summary report
Link Utilization Summary report overview
The Link Utilization Summary report shows utilization percentage information for selected IGP interfaces.
The default display is a table showing ingress, egress and percentage utilization. By default the table is sorted by average egress utilization in decreasing value order (worst first).
Note: Selecting more than 6000 interfaces may affect performance. Nokia recommends selecting only necessary interfaces.
The donut chart segments are colored based on the interface average egress utilization percentages, as follows:
Note: An operational CPAM with CPAA must be in use for the IGP Metric and Remote Node fields in the report to be populated.
Use cases
Capacity planning—Use the report to examine interface utilization patterns for planning future capacity requirements.
Prerequisites
For a Link Utilization Summary report to be created for an interface, the following items must be performed:
-
Assign the interface to either an IS-IS or an OSPF context, that is, enable the interface for IP
-
If needed, assign the interface to an MPLS context, that is, also enable the interface for MPLS
The report shows utilization data for the statistics that are enabled. For example, if the interface is running both MPLS and IP but only IP statistics are enabled, the report shows IP utilization data only.
Note: The utilization data is derived from collected statistics. It will not be an exact match to utilization data available via CLI from the NE.
For an Interface Utilization Details report to be available as a drill-down, the MPLS LSP Egress Stats Aggregator must be enabled; see How do I configure analytics aggregation?. If the aggregator is not enabled, the Link Utilization Summary report can still be created, but the drill-down will not be available.
To avoid errors, Nokia recommends creating the report with 4 500 interfaces or less.
The following table describes the aggregation rules that must be enabled and the accounting policies that must be configured for the NEs on which statistics are to be collected; see the NSP NFM-P Statistics Management Guide for information about configuring an accounting policy. To view the report for granularities other than raw data, the aggregation rules must be enabled; see How do I configure analytics aggregation?.
Table 14-21: Link Utilization Summary report prerequisites
|
Aggregator name |
Monitored object class |
Statistics class |
Statistics collection |
MIB name |
NE types |
|---|---|---|---|---|---|
|
Ip Interface Stats Aggregator |
rtr.NetworkInterface |
rtr.IpInterfaceStats |
Performance statistics |
vRtrIfStatsEntry |
7250 IXR 7750-SR Note: 7210 SAS is not supported |
|
Ip Interface Additional Stats Aggregator |
rtr.NetworkInterface |
rtr.IpInterfaceAdditionalStats |
Performance statistics |
vRtrIfStatsExtEntry |
7250 IXR 7750-SR Note: 7210 SAS is not supported |
|
SAR Ip Interface Stats Aggregator |
rtr.NetworkInterface |
rtr.SarIpInterfaceStats |
Performance statistics |
— |
7705 SAR 7705 SAR Hm Note: 7210 SAS is not supported |
|
Mpls Interface Stats Aggregator |
rtr.NetworkInterface |
mpls.MplsInterfaceStats |
Performance statistics |
vRtrMplsIfStatEntry |
7210 SAS 7250 IXR 7750 SR 7705 SAR 7705 SAR Hm Omnisystem NE |
Report characteristics
The following table lists the principal report characteristics.
Table 14-22: Link Utilization Summary report characteristics
|
Characteristic |
Value | ||||
|---|---|---|---|---|---|
|
Data type |
Statistics | ||||
|
Source database |
Auxiliary database | ||||
|
Interface types supported |
IP (IS-IS, OSPF, RIP), MPLS | ||||
|
Report inputs |
Prompt |
Notes | |||
|
End date |
Calendar date or relative date (for example, two days ago) and time | ||||
|
Granularity |
Aggregation types: | ||||
|
Report Range |
Length of time to be reported, in hours or days | ||||
|
NE Type |
Search using partial names or wildcard (%). Select individual items or click Select All. | ||||
|
NE Name (or NE Name Pattern) | |||||
|
NEs | |||||
|
Interface Name (or Interface Name Pattern) | |||||
|
Interfaces | |||||
|
Rank |
Value to use for the Top-N LSPs in the Interface Details drill-down report. The maximum is 1000; default is 10. Will only be relevant when MPLS interfaces are present. | ||||
|
Reference Speed |
Interface Speed or Physical Port Speed Notes: | ||||
|
Logo Resource ID |
The logo to add to the report. Enter the Resource ID of the logo image in the Images folder. The default is the Nokia logo. To create the report without a logo, leave the Logo Resource ID field blank. | ||||
|
Logo Position |
Choose Left, Middle, or Right. The logo appears on the left on the first page of the report if you choose Left or Middle. | ||||
|
Show report output on one page |
Select the check box to enable pagination. Note: Using the Show report output on one page option when creating reports as drill-downs may impact report rendering time. Nokia recommends disabling the Show report output on one page option when creating reports. | ||||
|
Drill-down support |
Yes—Click on an interface name to open an Interface Utilization Details report for the selected interface. | ||||
