TCP Performance Report for Selected Application Group report
TCP Performance Report for Selected Application Group report overview
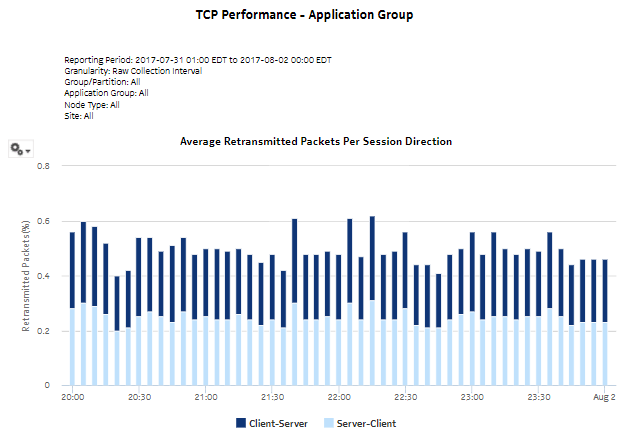
The TCP Performance Report for Selected Application Group report shows the TCP performance metrics for an application group.
Use cases
User quality of experience—Use the report to monitor application group performance and identify potential user QoE issues.
Report characteristics
The following table lists the principal report characteristics.
Table 9-12: TCP Performance Report for Selected Application Group report characteristics
|
Characteristic |
Value | |
|---|---|---|
|
Statistics type |
AA Cflowd TCP performance application group Note: Cflowd aggregation per IP group must be enabled. | |
|
NSP Flow Collector required |
Yes | |
|
Domains |
Residential / Wi-Fi (ESM) Mobile Wi-Fi (DSM) Business | |
|
Report inputs |
Prompt |
Notes |
|
End date |
Calendar date or relative date (for example, two days ago) and time | |
|
Granularity |
Aggregation types: | |
|
Report range |
Length of time to be reported, in minutes, hours, days, or months | |
|
Node Type |
Search using partial names or wildcard (%). Select individual items or click Select All. | |
|
Node | ||
|
Group/Partition | ||
|
Application Group | ||
|
Client IP Group |
Search using partial names or wildcard (%). Select individual items or click Select All. | |
|
Server IP Group | ||
|
Metrics |
Retransmitted packets, session establish time | |
|
Drill-down support |
Yes—Open TCP Performance Report - Worst Performing Applications to display graphs that show the top applications contributing to retransmitted packets or excessive RTT for the selected time and direction. | |
