What is the Transport Slice Controller dashboard?
Functionality provided by the TSC dashboard
The Transport Slice Controller dashboard provides the following functionality for managing transport slices in the network:
-
details on L0/L1/L2/L3 services and tunnels/paths used during the realization of transport slices
-
pro-active monitoring telemetry data and reports on transport slices
-
alarm correlation between slices, NEs, IP services, and LSPs
See the following workflows for more information about what you can do with the TSC:
-
How do I view the health of transport slices in the network?
-
How do I view details of the transport slice realization using L0/L1/L2/L3 services and tunnels/paths?
The TSC dashboard provides two main views of transport slices:
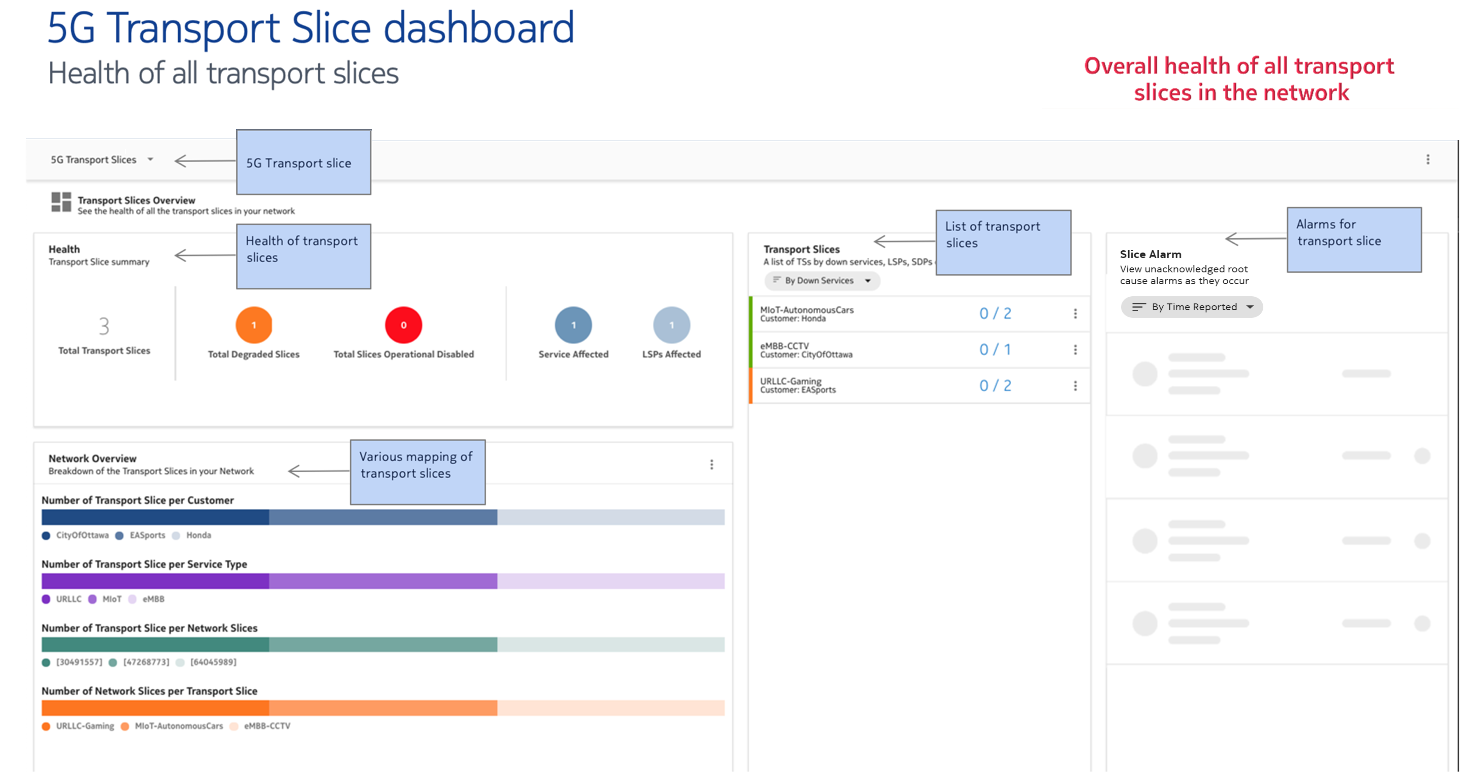
Figure 3-1, Overall health of all slices shows the TSC dashboard for overall health of all transport slices, at-a-glance mapping information, and correlation between transport slices and network slices.
Figure 3-1: Overall health of all slices
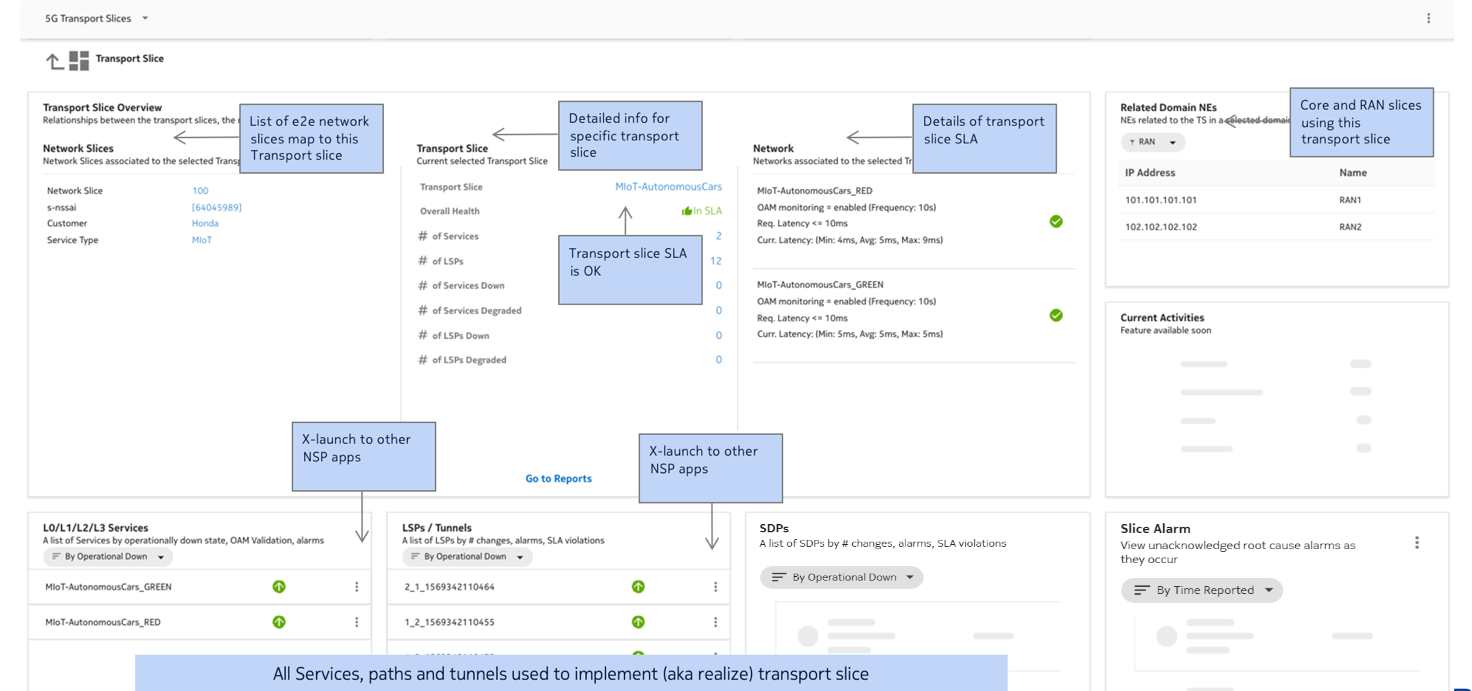
Figure 3-2, Detailed view of a specific slice shows the detailed view, available on a per-slice basis, displaying a drilled-down view of the selected slice. This view displays identifying information with SLA information and the core/RAN slices associated with the transport slice. Cross-launch actions to other NSP functions are available in this view.
The TSC detailed dashboard view displays the following information for a single transport slice:
-
network slice information such as customer, service type (such as URLLC, CCTV, Infotainment), network slice ID (S-NSSAI)
-
number of L0-L3 services and tunnels used/created/modified to realize the transport slice
-
details of the Requested SLA and Current SLA (such as min/average/max SLA)
-
details of the L0-L3 services used during the transport slice realization
-
details of all tunnels/LSPs used during the transport slice realization
-
how this transport slice is connected to RAN and Core slices
Figure 3-2: Detailed view of a specific slice
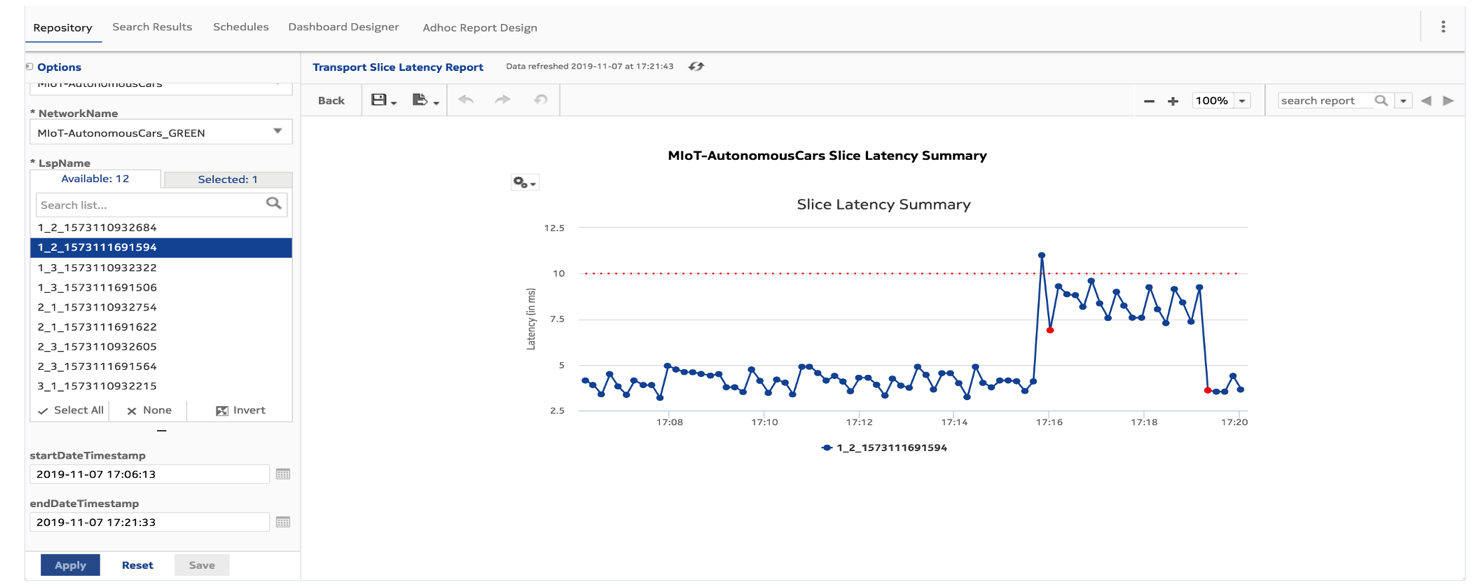
Figure 3-3, Transport slices in Analytics Reports shows the transport slice reporting supported by TSC in Data Collection and Analysis, Analytics Reports. The reports dashboard provides two new reports for bandwidth and latency in context of a specific transport slices. Reports displayed here can also be saved.


