Topology map types
Service tunnel topology map
A service tunnel topology map is available on the NFM-P by choosing Application→Service Tunnel Topology from the NFM-P main menu. The Service Tunnel Topology map is displayed, as shown in the following figure.
Figure 4-1: Service tunnel topology map
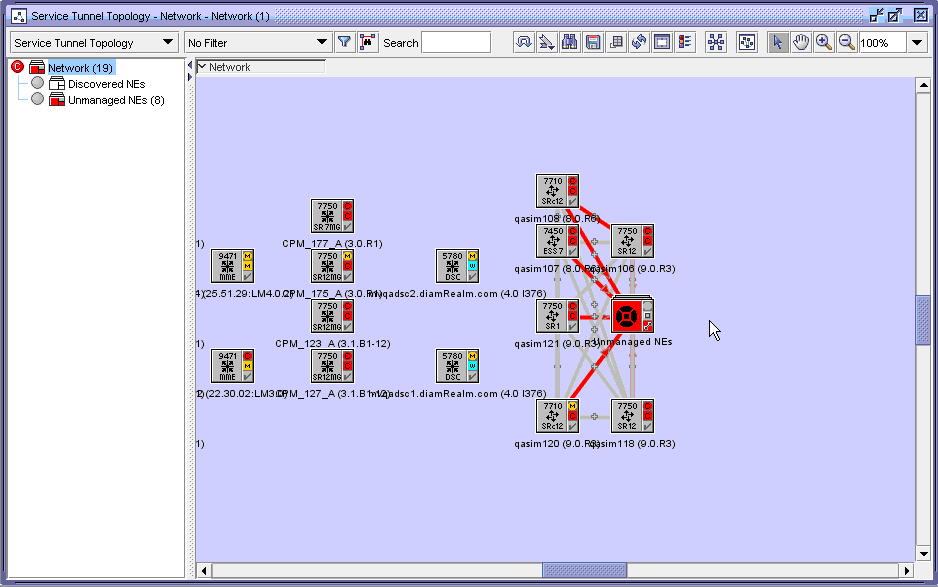
Icons in the service path topology map represent devices. The color of the device icon represents the status of the device. Red means that the device is down. Green means that the device is up. Yellow means that the device is being synchronized. Purple means that the device is in a suspended management state. See Chapter 9, Device discovery for information about device discovery and management states.
Link groups between devices represent service tunnels. When a link group is red, at least one tunnel in the link group is down. For link groups between managed devices, right click the link group icon to list and edit tunnels in the link group. For link groups between managed and unmanaged devices, right-click the link group icon to open contextual menus and submenus which allow you to open additional information forms for the service tunnel, including the properties form.
EPS path topology maps
An EPS path topology map is available on the NFM-P by choosing Application→EPS Path Topology from the NFM-P main menu. The EPS path topology map displays a static representation of mobile network objects and EPS paths. Each network object icon represents an aggregate of all network objects of that type. For SGWs and PGWs, the icon represents an aggregate of all instances of that gateway type and all network objects that contain instances of that type. Each EPS path link represents an aggregate of all EPS paths of a specific type.
LSP path topology map
An LSP path topology map is available from the MPLS Path form and the LSP Path form. See To open an MPLS provisioned path map from the MPLS Path form to view the map from the MPLS Path form. See To open a dynamic LSP path map from the LSP Path form to view the map from the LSP Path form.
The LSP path topology map is used to view a specific provisioned, actual, or CSPF LSP path in the context of its source, and transient and destination hops. The following figure shows an LSP path topology map.
Figure 4-2: LSP path topology map
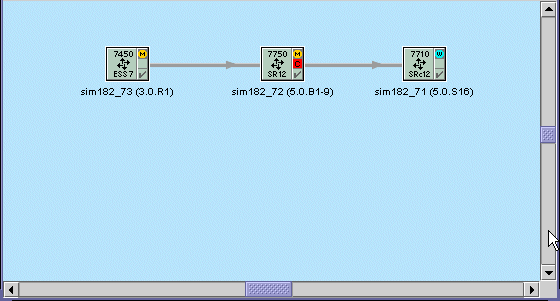
When you view the LSP path topology map, hops are linked by straight lines, where each line represents a sub-path between two hops of the LSP path. The direction of each path is indicated by an arrow. Green lines indicate provisioned paths, and gray lines indicate actual paths.
LSP cross-connect topology map
An LSP cross-connect topology map is available from the LSP Path form. To view the map from the LSP Path form, see To open a dynamic LSP cross-connect topology map .
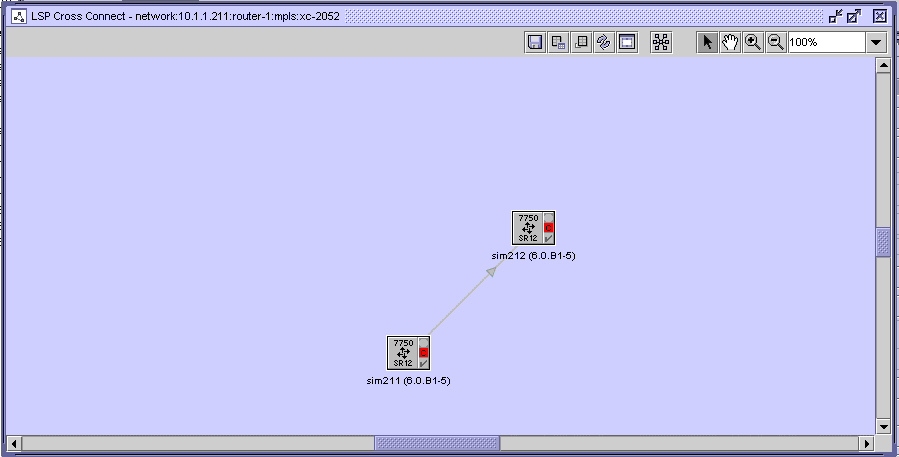
The LSP cross-connect topology map is used to view a specific LSP cross-connect in the context of its source, and transient and destination hops. The following figure shows the LSP cross-connect topology map.
Figure 4-3: LSP cross-connect map
Service topology maps
You can open a topology map for a selected service from the Manage Services form by clicking Topology View. The following figure shows a service topology map. Large NE icons represent managed devices. Small NE icons represent unmanaged devices. The label of an NE icon indicates the service name and the NE IP address.
Figure 4-4: Service topology map
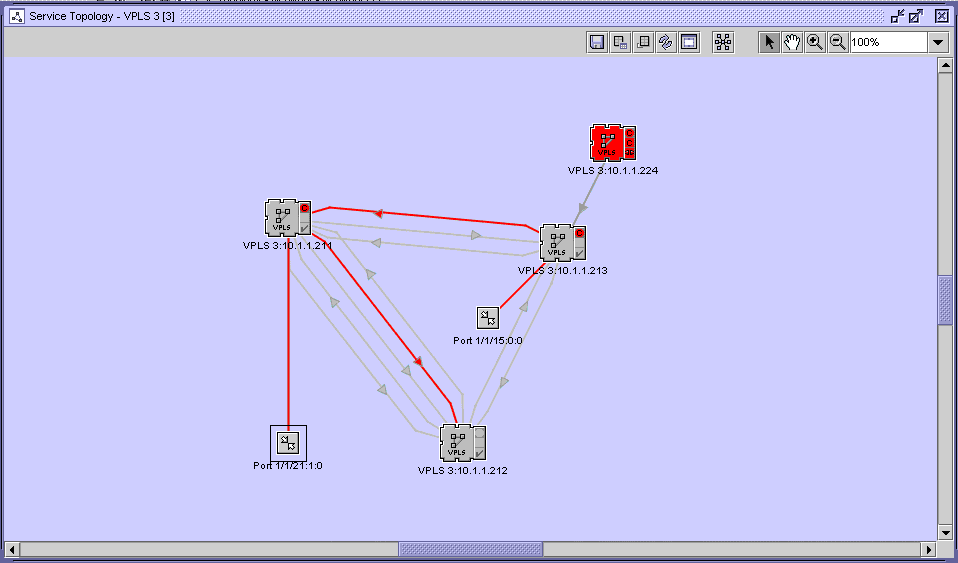
The symbol and color in the top-right corner of the managed device icon represents the aggregated alarm status, which is the most severe alarm on any service that includes the device. The symbol immediately below the aggregated alarm status and the color of the icon indicate the alarm status for the currently displayed service site. A red icon indicates that the service site is down. A green icon indicates that the service site is up.
A port icon represents a managed access interface. A port label includes the port number and the inner and outer port encapsulation values. A service site can support up to 20 SAPs. When the number of SAPs on a service site exceeds 20, the SAPs on the site are grouped into a SAP group, represented by a SAP group icon. When the number of SAPs drops below 20, the SAP group icon is replaced with the icons for the individual SAPs. To view the list of SAPs in a SAP group, right-click on the SAP group icon and choose List L2 Access Interface or List L3 Access Interface, depending on the service type. The corresponding Site form for the service opens.
SAP aggregation group icons represent SAP aggregation groups configured for a VLL Apipe on the 7705 SAR. The SAP aggregation group is linked to the service site and each of the individual SAPs. To hide the associated SAPs for a SAP aggregation group, right-click on the SAP aggregation group icon and choose Hide SAPs. Choose Show SAPs to show them again.
A line between two map objects represents a link or group of links. Links between device icons represent service circuits. Links between device icons and port icons represent the binding of an access port or interface to a service. The symbol and color in the bottom right corner of the managed device icon represents the connectivity alarm status. During a resynchronization of the managed device, the icon represents the resynchronization status, and is yellow. The status is inherited from the link endpoints. A plus sign icon located in the centre of the link indicates a bidirectional group link. An arrow icon located on the link indicates a unidirectional link and identifies the direction of the path.
Right-clicking on a managed site, port, or link opens a contextual menu that allows you to perform functions that include the following:
You can view multiple services on a map at the same time if the services are selected from the Manage Services form during map creation.
Service segmentation
A service segmentation view is also available to aid in conceptualizing complex services. Segments are logical grouping of interconnected sites, services, and bindings. The segmentation view is available for VPLS and VLL services.
A service segment is considered to be a portion of a single service that extends to multiple sites connected within that segment. It is based on the service type through one of the possible connection topologies (for example, mesh, PBB tunnels, a switching VLL, rings, and so on), without having to pass through any connectors such as spokes, CCAGs, or SCPs (SAP-to-SAP).
General examples of segments in Layer 2 service topologies include:
-
A simple pair or single spoke/mesh SDP binding comprises one segment
-
A multi-NE mesh with a spoke SDP to a single NE comprises two segments
Just a few examples of the many possible service-specific segmentation configurations include scenarios such as the following:
-
H-VPLS (Inter-Metro with redundant spoke SDPs):
-
One application of H-VPLS is the connection of two or more geographically-dispersed VPLS domains belonging to the same customer. Two spoke SDP connections are used to connect each VPLS between the two metros, either in a redundant PW spokes topology or under STP protocol. The redundant spokes comprise one segment, while each VPLS will also comprise one or more segments, depending on their specific configurations.
-
-
-
For a VLL service at a switching router, a terminating PE device has at least one VLL SAP, while a switching PE device has a VLL instance which cross-connects two spoke bindings. All VLL instances of such a service must have the same service ID, and if the VLL has one or more switching sites, it must have at least two terminating sites. In this scenario, the primary and redundant spoke SDPs on the same network endpoint are considered to be in the same segment.
-
-
-
In a PBB configuration, the B-VPLS is considered a service tunnel, from the I-VPLS or I-Epipe perspective. Therefore, the sites connected via a B-VPLS (that is, having the same ISID) are considered to be in one segment.
-
I-Sites bound to the same PBB tunnel (B-VPLS) and having the same ISID exist in the same segment.
-
Epipe sites bound to same PBB tunnel (B-VPLS) exist in the same segment
-
Whenever you modify a service, the following actions can trigger segment creation, modification, or deletion in a segmented service view:
You can access the segmented view of a service by right-clicking on an empty portion of the background in the service’s topology view. A contextual menu allows you to activate or de-activate the segmented view for the service.
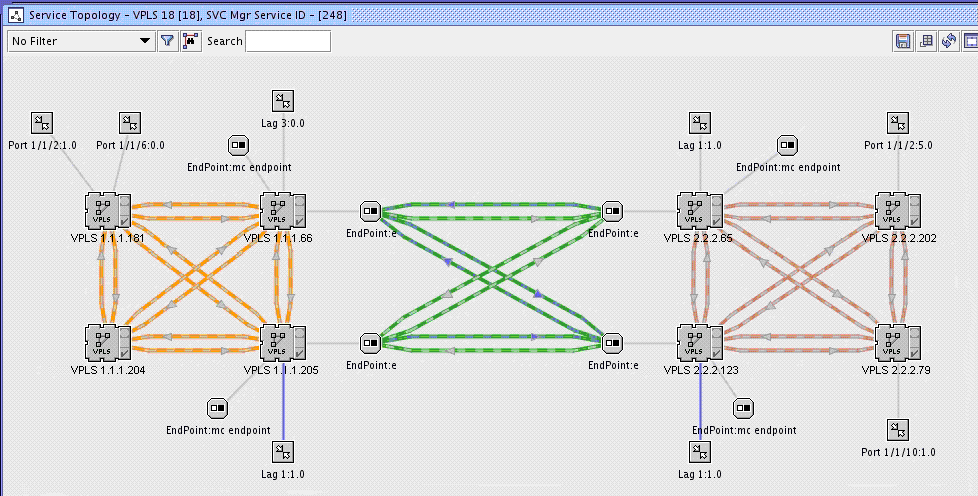
In a segmented view, the outlined links of all spoke bindings, mesh bindings, or VLAN Uplinks are colored in the same distinct way for the segment they belong to. However, there are currently only 19 different colors available for use in showing service segments. If all the colors for a specific service are used, a warning message is logged to indicate this.
The following figure shows an example of how the NFM-P displays the segmented view of an H-VPLS Metro-to-Metro service.
Figure 4-5: Service segmentation example
Composite service topology maps
You can use the NFM-P to view composite service topology and flat topology maps. The figure below shows a sample composite service topology map. When you open a flat topology view map, the navigation tree is not part of the map.
Figure 4-6: Composite service topology map
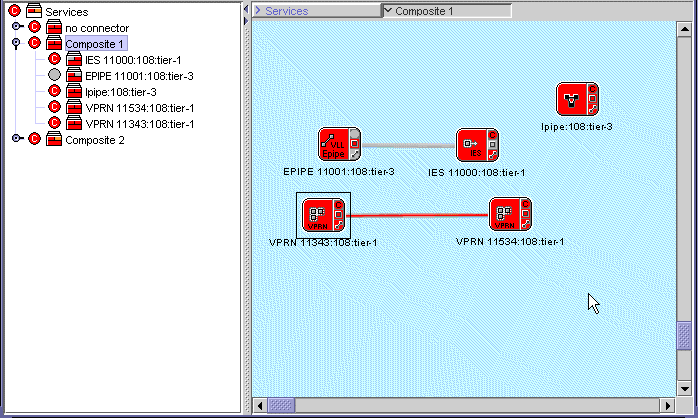
In a composite service topology map, you can use the navigation tree at the left side to display the composite service and service tier hierarchy starting from the services object. The map navigation tree displays the following:
Double-click on a composite service object in the map panel to display the service objects that belong to the composite service. Double-click on the service objects to display the service sites and access interfaces. The links or groups of links between the service sites and access interfaces are also displayed.
In the composite service topology map, all service objects in the composite service are displayed simultaneously. The service sites, access interfaces, and the links or groups of links between them are also displayed. The navigation tree is thus not required in this view. The following figure shows a sample composite service flat topology map.
Figure 4-7: Composite service flat topology map
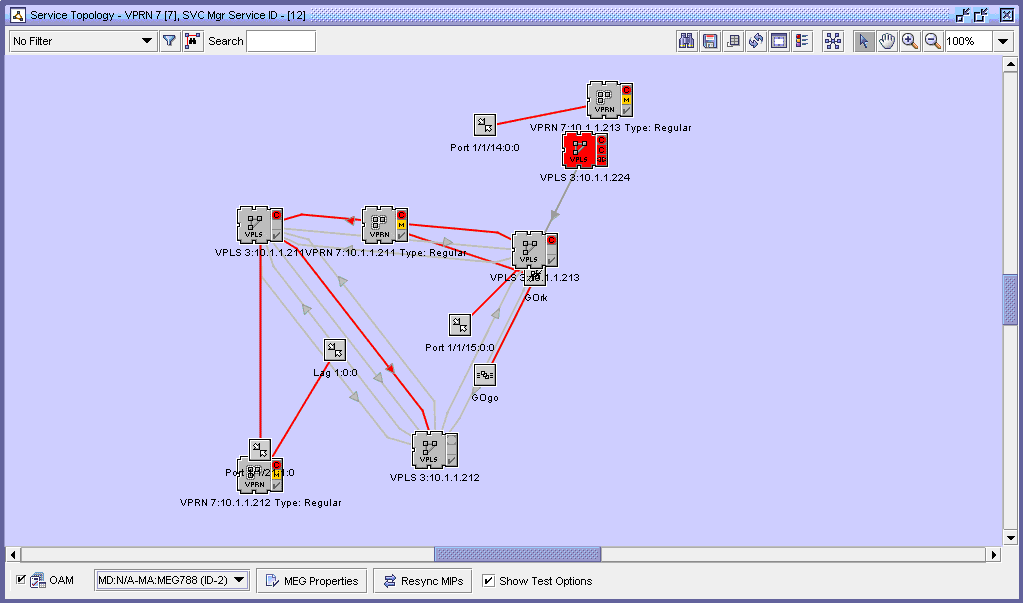
You can right-click an object icon or link group icon to turn up, shut down, or display the properties form for the item.
You can also perform Ethernet CFM diagnostics directly from the composite service flat map.