Optical Power and Voltage Summary report
Optical Power and Voltage Summary report overview
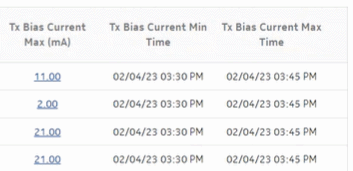
The Optical Power and Voltage Summary report contains a summary of information about the optical power in dBm, measured at equipment ports. The report provides a table showing Tx power, Rx power, temperature, supply voltage, and Tx bias current.
Note: In the case of an upgrade from 23.4 or previous release, there will be reports listed as ‘Optical Port Power Details’ report. These reports are replaced with ‘Optical Power and Voltage Details’ report for details report and will be removed from the list in the future.
Use cases
Troubleshooting—Use the report to confirm that optical power is in the optimum operating range to determine if it is a cause of network impairment.
Limitations
Report limitations include:
-
The average voltage counter is not part of the hardware resource statistics.
-
Low voltage threshold and high voltage threshold report inputs are applicable only to DDM statistics and hardware resource statistics.
-
Periodic counters are used for hardware resource statistics if non-periodic counters are not present in aggregation tables.
-
When the report is exported to the RTF file type, DDM statistics may not display properly.
-
When the report is exported to the DOCX file type, DDM statistics do not display.
Prerequisites
The following table describes the aggregation rules that must be enabled and the statistics to be collected. To view the report for granularities other than raw data, the aggregation rules must be enabled; see How do I configure analytics aggregation?.
Table 11-14: Optical Power and Voltage Summary report prerequisites
|
Aggregator name |
Monitored object class |
Statistics class |
Statistics collection |
MIB name |
NE types |
|---|---|---|---|---|---|
|
DDM stats aggregator |
equipment.Digital DiagnosticMonitoring |
equipment.DDMStats |
MIB-based |
TIMETRA-PORT-MIB.tmnxDigitalDiag MonitorEntry |
7210 SAS-D 7210 SAS-MXP 7210 SAS-R 7250 IXR 7705 SAR 7750 SR |
|
Lane DDM stats aggregator |
equipment.LaneDDM |
equipment, LaneDDMStats |
MIB-based |
tmnxDDMLaneEntry |
7210 SAS-R 7210 SAS-S/Sx 7250 IXR 7450 ESS 7705 SAR-Hm 7750 SR 7950 XRS |
|
Coherent optical port stats aggregator |
equipment.Connector equipment.PhysicalPort |
ethernetequipment CohOptPortStats |
MIB-based |
tmnxCohOptPortStatsEntry |
7250 IXR 7450 ESS 7705 SAR-Hm 7750 SR 7950 XRS |
|
Hardware resource stats aggregator |
equipment.HwEnvironment |
equipment HardwareResourceStats |
MIB-based |
tmnxHwResourceEntry |
7250 IXR 7750 SR 7950 XRS |
Report characteristics
The following table lists the principal report characteristics.


