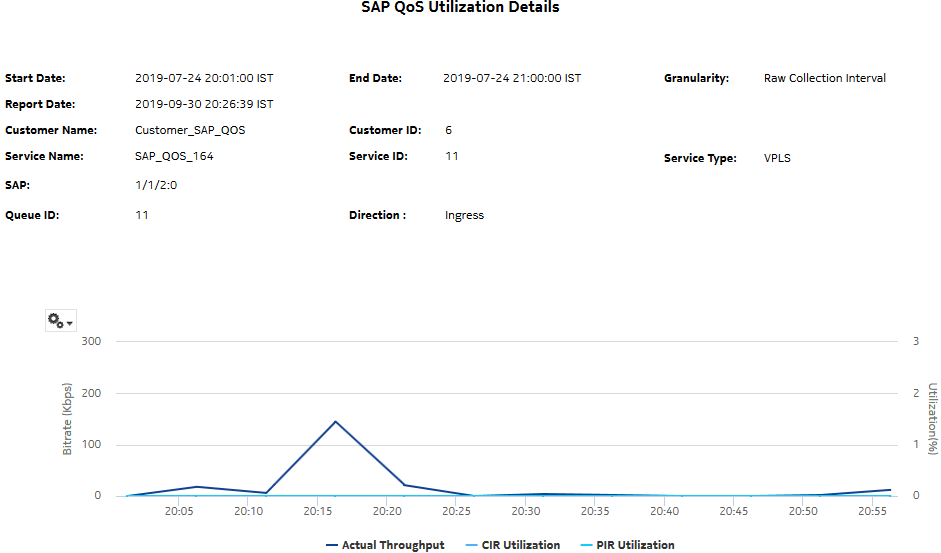
SAP QoS Utilization Details report
SAP QoS Utilization Details report overview
The SAP QoS Utilization Details report shows utilization percentage information for an SAP. This report can be launched on its own or as a drill-down of the Service Utilization Details report.
The report has one time series graph for the selected SAP, direction, and queue, meter, or policer value. The graph displays the actual throughput, CIR, PIR, and percentage utilization.
The report supports the Rate (kbps) rate type, Percent Port, and Percent Local rate types. The report supports the port limit and local limit, which are the CIR/PIR values configured as percentages.
For SR variants, 7705 SAR-Hm, and 7705 SAR-Hmc, the report supports QoS policies, virtual schedulers, queue/policer overrides, and the egress aggregate rate limit.
For the 7210 SAS, the report supports QoS policies, queue/meter overrides, and the egress aggregate rate limit.
For the 7705 SAR, the report supports QoS policies and the egress aggregate rate limit.
It is not mandatory to configure QoS for this report since the default QoS settings apply.
Use cases
Capacity planning—Use the report to examine SAP QoS utilization patterns for planning future capacity requirements.
Limitations
Minimum and maximum throughput aggregation cannot be compared with the minimum and maximum throughput values generated from raw granularity.
Prerequisites
The following table describes the aggregation rules that must be enabled and the accounting policies that must be configured for the NEs on which statistics are to be collected; see the NSP NFM-P Statistics Management Guide for information about configuring an accounting policy. To view the report for granularities other than raw data, the aggregation rules must be enabled; see How do I configure analytics aggregation?.
Table 14-11: SAP QoS Utilization Details report prerequisites
|
Aggregator name |
Monitored object class |
Statistics class |
Statistics collection |
Details |
NE types |
|---|---|---|---|---|---|
|
SAP Interface Stats Aggregator Egress |
service.AccessInterface |
service.CompleteServiceEgressPacketOctets |
Accounting, file, and log policies |
completeSvcInEg policy |
7750 SR 7705 SAR 7705 SAR-H 7705 SAR Hm |
|
SAP Interface Stats Aggregator Ingress |
service.AccessInterface |
service.CompleteServiceIngressPacketOctets |
Accounting, file, and log policies |
completeSvcInEg policy |
7250 IXR-R6 7705 SAR 7705 SAR-H 7705 SAR Hm 7750 SR |
|
Service Egress Octets Aggregator |
service.AccessInterface |
service.ServiceEgressOctets |
Accounting, file, and log policies |
svcEgressOctet policy |
7210 SAS-D 7210 SAS Dxp 7210 SAS-K 7210 SAS-M 7210 SAS-Mxp 7210 SAS-R 7210 SAS-T 7210 SAS-X 7705 SAR-H Note: 7210 SAS-E and 7210 SAS-S/Sx are not supported due to NE limitations. |
|
Service Ingress Octets Aggregator |
service.AccessInterface |
service.ServiceIngressOctets |
Accounting, file, and log policies |
svcIngressOctet policy |
7210 SAS-D 7210 SAS Dxp 7210 SAS-K 7210 SAS-M 7210 SAS-Mxp 7210 SAS-R 7210 SAS-S/Sx 7210 SAS-T 7210 SAS-X 7705 SAR-H |
Report characteristics
The following table lists the principal report characteristics.
