SAP Throughput (NSP) report
SAP Throughput (NSP) report overview
The SAP Throughput (NSP) report differs from the SAP Throughput report by including throughput data for NEs managed by the NFM-P only, MDM (model-driven) only, or NFM-P+MDM-mediated NEs. The content and format of the SAP Throughput (NSP) report vary from the NFM-P-only SAP Throughput report to accommodate its model-driven approach.
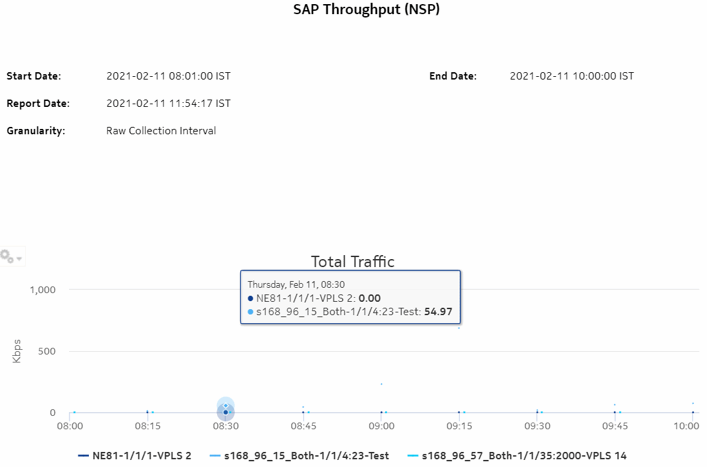
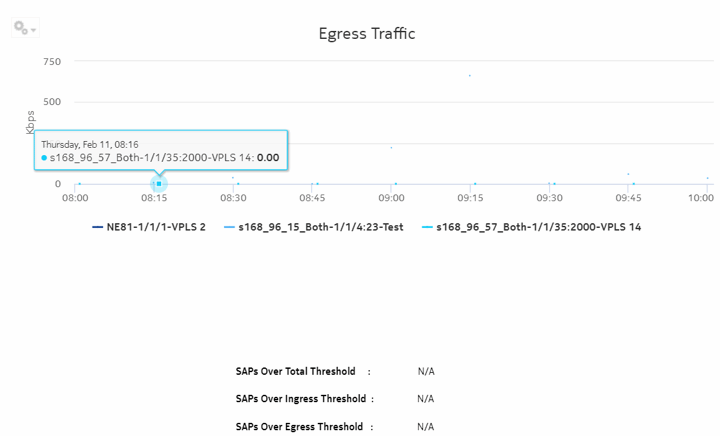
The SAP Throughput (NSP) report shows throughput by a specified service and SAPs. The default display is a set of time series graphs, showing ingress and egress.
The top 5 SAPs with the highest throughputs are shown in the report plots.
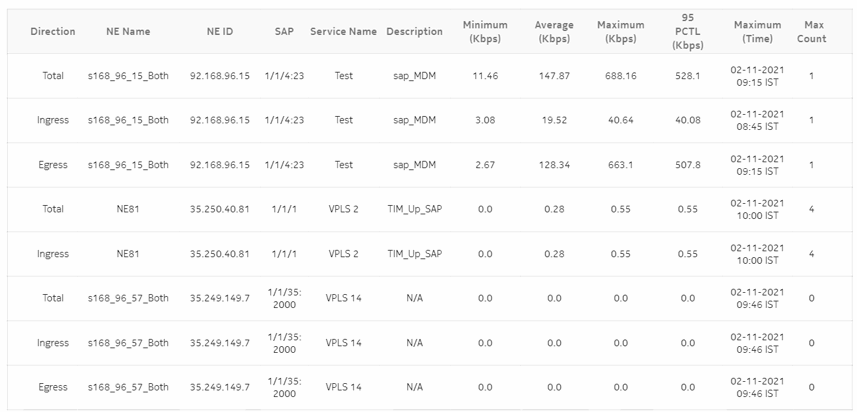
The summary table shows the minimum, average, and maximum SAP throughput values along with percentiles, for all the SAPs selected. The summary table displays the SAPs in descending order of average total throughput.
The report currently shows policers with stat mode “minimal” only.
If a percentile value from 1 to 99 is entered in the Percentile input, the selected percentile value of the data is shown in the table.
Note: The report may not complete if it is run on more than 400 000 SAPs.
Use cases
Capacity planning—Use the report to examine traffic usage and patterns on a per service or per SAP basis, to plan for capacity requirements.
Limitations
Minimum and maximum throughput aggregation cannot be compared with the minimum and maximum throughput values generated from raw granularity.
Prerequisites
The following items need to be performed in the NFM-P for SAP Throughput (NSP) reports to be created:
-
For raw data, the periodic counter must be enabled from the Periodic Counter Manager; see the NSP NFM-P Statistics Management Guide for information about creating and managing periodic accounting statistics calculations.
-
The following table describes the aggregation rules that must be enabled and the telemetry subscriptions that must be configured for the NEs on which statistics are to be collected. The aggregation rules must be enabled to view the report for granularities other than raw data; see How do I configure analytics aggregation?. Enable aggregation and configure telemetry subscriptions; see the Telemetry information on the Network Developer Portal and the NSP Data Collection and Analysis Guide. For the report prerequisites for NFM-P-managed NEs, see Table 14-4, SAP Throughput report prerequisites.
Table 19-22: SAP Throughput (NSP) report prerequisites
|
Aggregator name |
Monitored object class |
Statistics class |
Statistics collection |
NE types |
|---|---|---|---|---|
|
md-aggr:/md-aggr-base/complete-service-egress-packet-octets/complete-service-ingress-packet-octets |
queue-id sap-id statmode |
telemetry:/base/accounting/complete/service/ingress/packet/octets |
Accounting, file, and log policies |
7750 MD SR Classic NE with gRPC telemetry collection enabled |
|
md-aggr:/md-aggr-base/complete-service-egress-packet-octets/complete-service-egress-packet-octets |
queue-id sap-id statmode |
telemetry:/base/accounting/complete/service/egress/packet/octets |
Accounting, file, and log policies |
7750 MD SR Classic NE with gRPC telemetry collection enabled |
Viewing collection statistics in the NFM-P GUI
For 7210 SAS and 7750 SR NEs, the statistics collected to create the SAP Throughput (NSP) report can be viewed in the NFM-P GUI, from the SAP properties Statistics tab:
-
For 7210 SAS NEs, the Service Ingress Octets and Service Egress Octets record types show the statistics with All Octets Forwarded, which are used for throughput calculations.
-
For 7750 SR and 7705 SAR NEs, the Complete Service Ingress Packet Octets and Complete Service Egress Packet Octets record types show the statistics used for throughput calculations.
7210 SAS counter type
Reports are available for 7210 SAS NEs using both counter types. The throughput information is calculated based on the counter type configured at the time the report is taken. If multiple SAPs are selected for reporting, Analytics assumes that the counter type of all the selected SAPs can be the same or different. Currently the sum of throughputs of multiple SAPs chosen would be plotted.
For more information about counter types, see the NE documentation.
Report characteristics
The following table lists the principal report characteristics.


