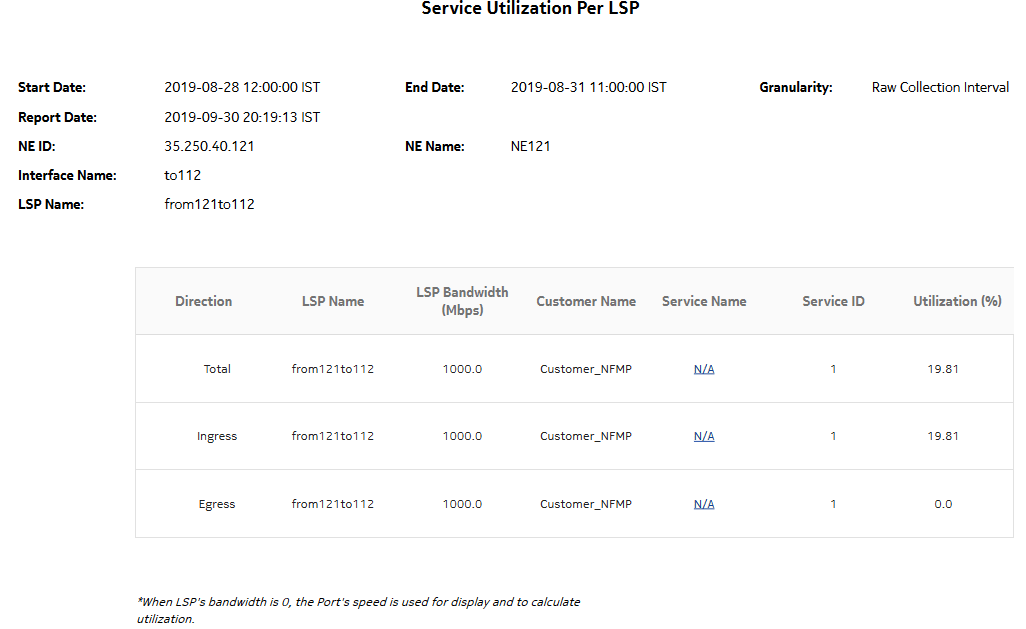
Service Utilization per LSP report
Service Utilization per LSP report overview
The Service Utilization per LSP report shows a list of the top LSPs for a selected MPLS interface. The report can be run on its own or as a drill-down from an Interface Utilization Details report.
The report provides a table with a list of services contained within the LSP, and displays the service’s percentage utilization of the LSP’s bandwidth sorted in decreasing order. For each service in the table, you can drill down to the existing Service Utilization report to see a breakdown of traffic on a per queue basis for each SAP in the service.
Use cases
Capacity planning—Use the report to examine interface utilization patterns for planning future capacity requirements.
Prerequisites
The following table describes the aggregation rules that must be enabled and the accounting policies that must be configured for the NEs on which statistics are to be collected; see the NSP NFM-P Statistics Management Guide for information about configuring an accounting policy. To view the report for granularities other than raw data, the aggregation rules must be enabled; see How do I configure analytics aggregation?.
Table 14-17: Service Utilization per LSP report prerequisites
|
Aggregator name |
Monitored object class |
Statistics class |
Statistics collection |
Details |
Counters |
NE types |
|---|---|---|---|---|---|---|
|
Combined SDP Ingress PacketOctets stats aggregator |
svt.PWPortBinding svt.SdpBinding |
service.CombinedSdpIngressPacketOctets |
Accounting, file, and log policies |
combinedSvcSdpInEg |
totalOctetsForwarded |
210 WBX 7210 SAS Dxp 7210 SAS-K 7210 SAS-M 7210 SAS-Mxp 7210 SAS-R 7210 SAS-S/Sx 7210 SAS-T 7210 SAS-X 7250 IXR 7450 ESS 7705 SAR Hm 7710 SR 7750 SR 7850 VSA-8 7850 VSG 7950 XRS VSC Note: The 7705 SAR-H is not supported. |
|
Combined SDP Egress PacketOctets stats aggregator |
svt.PWPortBinding svt.SdpBinding |
service.CombinedSdpEgressPacketOctets |
Accounting, file, and log policies |
combinedSvcSdpInEg |
totalOctetsForwarded |
Report characteristics
The following table lists the principal report characteristics.
