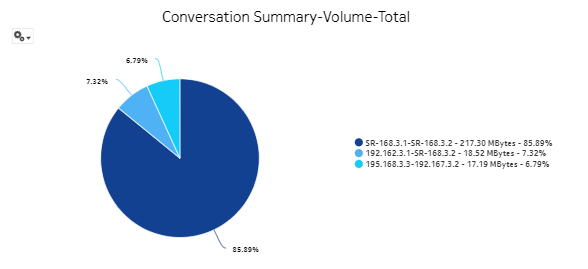
Interface Overview report
Interface Overview report overview
The Interface Overview report shows an overview of protocol, TOS, host, and conversation traffic for a selected IGP interface. The report can be run on its own or as a drill-down from an Interface Utilization Summary report.
The default display is a set of graphs showing ingress, egress stacked trends and summaries.
Use cases
Capacity planning—Use the report to examine interface utilization patterns for planning future capacity requirements.
Prerequisites
The collection of IPFIX statistics, which are also called system Cflowd or NetFlow v10 statistics, must be enabled; see the NSP NFM-P Statistics Management Guide.
To view the report for granularities other than raw data, the aggregation rules must be enabled; see How do I configure analytics aggregation?. The following table describes the aggregation rules and the accounting policies that must be configured for the NEs on which statistics are to be collected; see the NSP NFM-P Statistics Management Guide for information about configuring an accounting policy.
Table 14-27: Interface Overview report prerequisites
|
Aggregator name |
Statistics collection |
Details |
NE types |
|---|---|---|---|
|
Analytics_cflowd_sys_pt_proto_r |
Flow Statistics collected through a Flow Collector |
Analytics_cflowd_sys_pt_proto_r |
7250 IXR 7450 ESS 7705 SAR 7750 SR 7950 XRS |
|
Analytics_cflowd_sys_ot_tos_r |
Flow Statistics collected through a Flow Collector |
Analytics_cflowd_sys_ot_tos_r |
7250 IXR 7450 ESS 7705 SAR 7750 SR 7950 XRS |
|
Analytics_cflowd_sys_ht_if_hip_r |
Flow Statistics collected through a Flow Collector |
Analytics_cflowd_sys_ht_if_hip_r |
7250 IXR 7450 ESS 7705 SAR 7750 SR 7950 XRS |
|
Analytics_cflowd_sys_ct_if_ip1ip2_r |
Flow Statistics collected through a Flow Collector |
Analytics_cflowd_sys_ct_if_ip1ip2_r |
7250 IXR 7450 ESS 7705 SAR 7750 SR 7950 XRS |
Notes:
Note: The 7705 SAR-H is not supported.
Report characteristics
The following table lists the principal report characteristics.
Table 14-28: Interface Overview report characteristics
Example
The following figures show a report example.
Figure 14-30: Interface Overview report—Stacked Protocol Trend - In
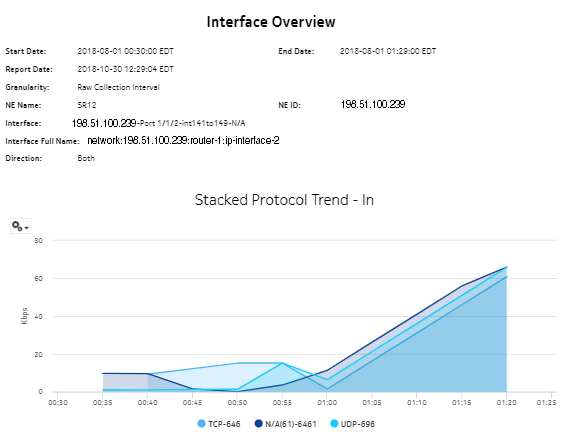
Figure 14-31: Interface Overview report—Stacked Protocol Trend – Out
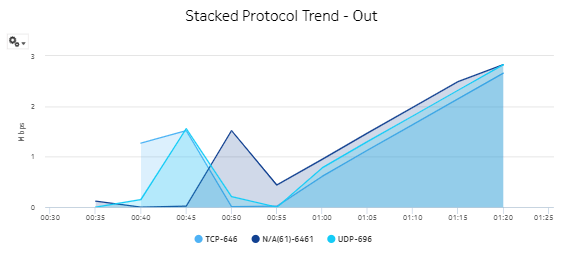
Figure 14-32: Interface Overview report, Stacked TOS Trend – In
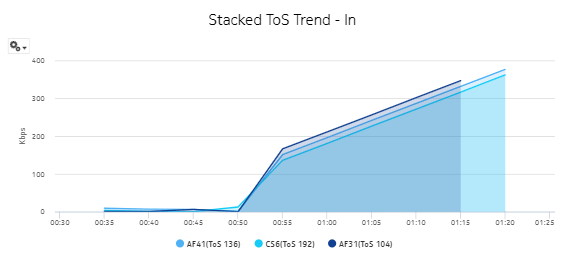
Figure 14-33: Interface Overview report—Stacked TOS Trend – Out
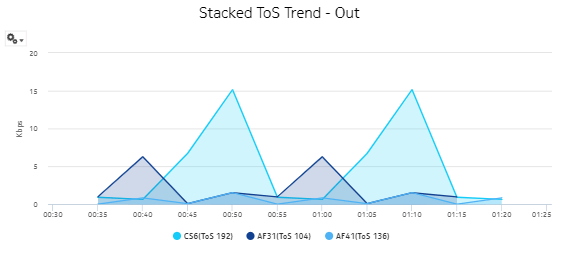
Figure 14-34: Interface Overview report—Host Summary – Volume – From
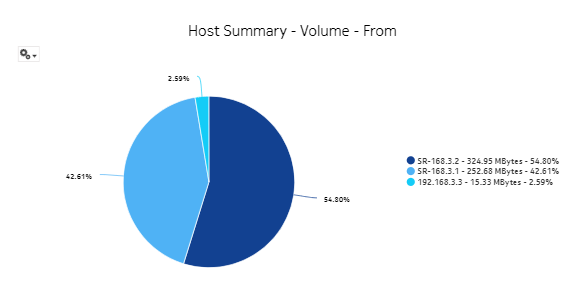
Figure 14-35: Interface Overview report—Host Summary - Volume - To
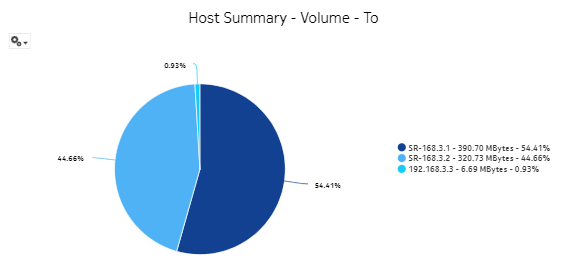
Figure 14-36: Interface Overview report—Conversion Summary - Volume - Total
