Port/LAG Details report
Port/LAG Details report overview
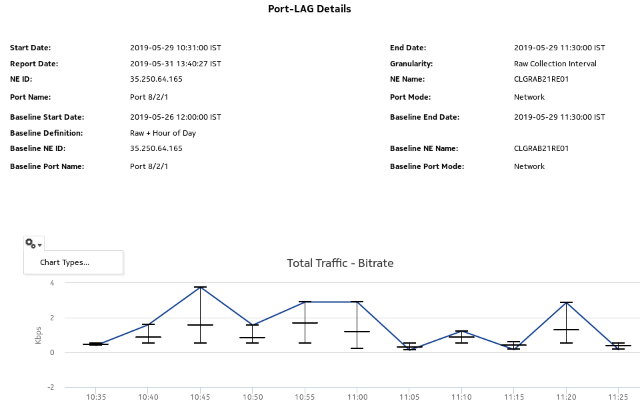
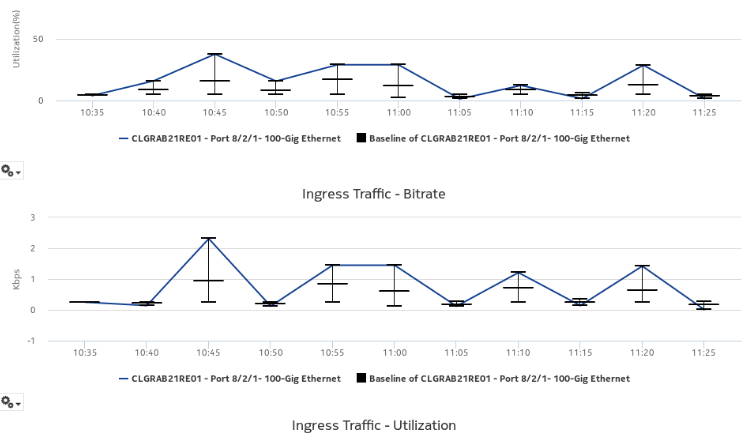
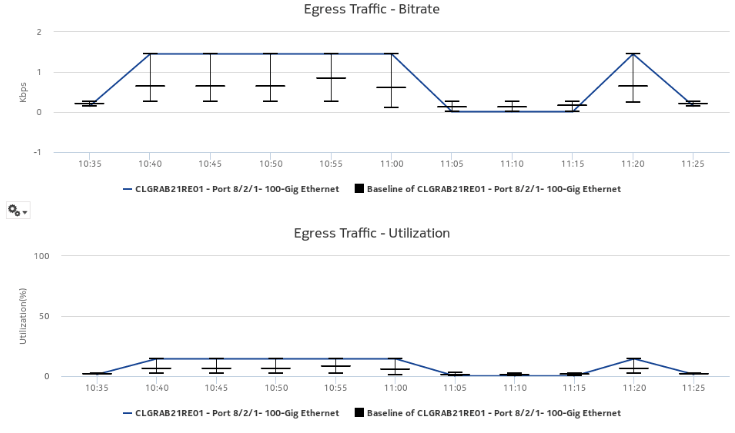
The Port/LAG Details report shows the throughput and utilization by a specified port, LAG, or MC LAG. The default display is a set of time series graphs, showing total, ingress, and egress traffic. The report can be run by itself or as a drill-down from a Port Throughput Summary report. The report can also be displayed along with baseline values. See Baselining in Analytics reports for more information about how baselines are defined.
Additionally, the plot or graph shows the actual values at a specified time.
To enable or disable a baseline box plot, click on the baseline item in the graph legend. When you run the report for MC-LAG or LAG, enable only one baseline legend to align the baseline plot with the axis.
Use cases
Capacity planning—Use the report to examine traffic usage and patterns on a port, LAG, or MC LAG basis, to plan for capacity requirements.
Limitations
Minimum and maximum throughput aggregation cannot be compared with the minimum and maximum throughput values generated from raw granularity.
Prerequisites
The following table describes the aggregation rules that must be enabled and the accounting policies that must be configured for the NEs on which statistics are to be collected; see the NSP NFM-P Statistics Management Guide for information about configuring an accounting policy. To view the report for granularities other than raw data, the aggregation rules must be enabled; see How do I configure analytics aggregation?.
Table 14-25: Port/LAG Details report prerequisites
|
Aggregator name |
Monitored object class |
Statistics class |
Statistics collection |
MIB name |
NE types |
|---|---|---|---|---|---|
|
Interface Utilization Statistics Aggregator |
equipment.PhysicalPort lag.Interface |
equipment.InterfaceAdditionalStats |
Performance statistics |
ifXEntry |
7210 SAS 7250 IXR 7705 SAR 7705 SAR-H 7750 SR |
|
PortNetIngressStats Error Stats Aggregator |
equipment.PhysicalPort |
equipment.PortNetIngressStats |
Performance statistics |
TIMETRA-PORT-MIB.tmnxPortNetIngressStatsEntry |
7705 SAR 7705 SAR-H |
|
PortNetEgressStats Error Stats Aggregator |
equipment.PhysicalPort |
equipment.PortNetEgressStats |
Performance statistics |
TIMETRA-PORT-MIB.tmnxPortNetEgressStatsEntry |
7705 SAR 7705 SAR-H |
|
Dot3Stats Error Stats Aggregator |
equipment.PhysicalPort |
ethernetequipment.Dot3Stats |
Performance statistics |
EtherLike-MIB.dot3StatsEntry |
7210 SAS 7250 IXR 7705 SAR 7705 SAR-H 7750 SR |
|
Interface Error Stats Aggregator |
equipmet.PhysicalPort lag.Interface |
equipment.InterfaceStats |
Performance statistics |
ifEntry |
7210 SAS 7250 IXR 7705 SAR 7705 SAR-H 7750 SR |
|
EthernetStats Error Stats Aggregator |
equipment.PhysicalPort |
ethernetequipment.EthernetStatsLogRecord |
Performance statistics |
etherStatsEntry |
7210 SAS 7250 IXR 7705 SAR-H 7705 SAR-Hm 7750 SR |
|
AdditionalEthernetStats Error Stats Aggregator |
equipment.PhysicalPort |
ethernetequipment. AdditionalEthernetStats |
Performance statistics |
tmnxPortEtherEntry |
7210 SAS 7250 IXR 7705 SAR 7705 SAR-H 7705 SAR-Hm 7750 SR |
|
IngressPortFwdEngDropReasonStats Error Stats Aggregator |
equipment.PhysicalPort |
equipment.IngressPortFwdEngDropReasonStats |
Performance statistics |
TIMETRA-PORT-MIB.tPortIngressFwdEngDRStatsEntry |
7250 IXR 7705 SAR-Hm 7750 SR Note: The 7705 SAR-H is not supported |
Report characteristics
The following table lists the principal report characteristics.
Table 14-26: Port/LAG Details report characteristics
|
Characteristic |
Value | |||||
|---|---|---|---|---|---|---|
|
Data type |
Statistics | |||||
|
Source database |
Auxiliary database | |||||
|
Report inputs |
Prompt |
Notes | ||||
|
End date |
Calendar date or relative date (for example, two days ago) and time | |||||
|
Granularity |
Aggregation types: | |||||
|
Report range |
Length of time to be reported, in minutes (minutes, min), hours (hours, h), days (days, d), or months (months, m) | |||||
|
NE Types |
Search using partial names or wildcard (%). Select individual items. | |||||
|
Node Name (or Node Name Pattern) | ||||||
|
Nodes | ||||||
|
Port Modes |
Select Access, Network, or Hybrid. Select individual items or click Select All. | |||||
|
Port-LAG/MC LAG |
Select one radio button | |||||
|
Port Name (or Port Name Pattern) |
Select Access, Network, or Hybrid. Select individual items. | |||||
|
Physical Ports / LAGs / MC LAGs | ||||||
|
Enable Baseline |
Select the check box to include baseline data in the report. | |||||
|
Baseline End Date |
Calendar date or relative date (for example, two days ago) and time | |||||
|
Baseline Report Range |
Length of time to calculate the baseline, in minutes, hours, days, or months. A longer baseline range will improve baseline accuracy. | |||||
|
Baseline Definition |
Select a definition to calculate the baseline. For example, “hour of day” means that current data is compared against the baseline calculated from the historical data from the same hour within the baseline time frame. | |||||
|
Baseline NEs |
Select one NE to use as an example for baseline data | |||||
|
Report inputs |
Baseline port mode |
Select Access, Network, or Hybrid. Select individual items or click Select All. | ||||
|
Name or name pattern for baseline ports |
Search using partial names or wildcard (%). Select individual items or click Select All. | |||||
|
Baseline port or LAG or MC-LAG |
Select a baseline port, LAG, or MC-LAG. | |||||
|
Total Threshold |
Specify in bps/Kbps/Mbps/Gbps | |||||
|
Ingress Threshold |
Specify in bps/Kbps/Mbps/Gbps | |||||
|
Egress Threshold |
Specify in bps/Kbps/Mbps/Gbps | |||||
|
Show report output on one page |
Select the check box to enable pagination. Note: Using the Show report output on one page option when creating reports as drill-downs may impact report rendering time. Nokia recommends disabling the Show report output on one page option when creating reports. | |||||
|
Percentile |
Identify a percentile of interest between 1 and 99. | |||||
|
Logo Resource ID |
The logo to add to the report. Enter the Resource ID of the logo image in the Images folder. The default is the Nokia logo. To create the report without a logo, leave the Logo Resource ID field blank. | |||||
|
Logo Position |
Choose Left, Middle, or Right. The logo appears on the left on the first page of the report if you choose Left or Middle. | |||||
|
Show report output on one page |
Select the check box to enable pagination. Note: Using the Show report output on one page option when creating reports as drill-downs may impact report rendering time. Nokia recommends disabling the Show report output on one page option when creating reports. | |||||
|
Drill-down support |
Yes:
| |||||
Example
The following figures show a report example.
Figure 14-20: Port/LAG Details report—Total Traffic – Bitrate

Figure 14-21: Port/LAG Details report—Total Traffic – Utilization

Figure 14-22: Port/LAG Details report—Ingress Traffic – Bitrate

Figure 14-23: Port/LAG Details report—Ingress Traffic – Utilization

Figure 14-24: Port/LAG Details report—Egress Traffic – Bitrate

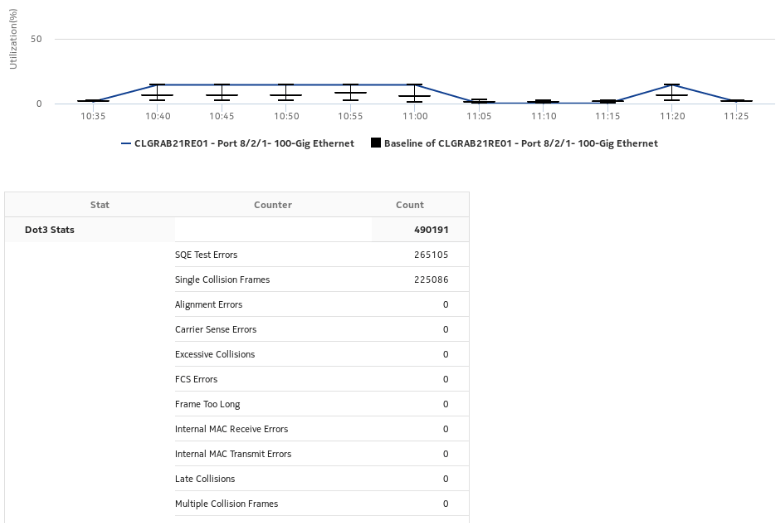
Figure 14-25: Port/LAG Details report—Egress traffic – Utilization

Figure 14-26: Port/LAG Details report with baseline—Total Traffic

Figure 14-27: Port/LAG Details report with baseline—Ingress Traffic – Bitrate

Figure 14-28: Port/LAG Details report with baseline—Egress Traffic – Bitrate

Figure 14-29: Port/LAG Details report—Baseline information
