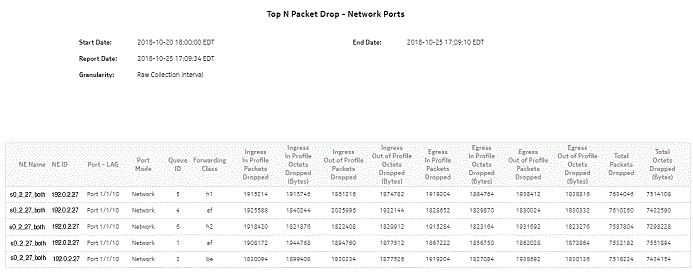
Top N Packet Drop—Network Ports report
Top N Packet Drop—Network Ports report overview
The Top N Packet Drop—Network Ports report show the top N FECs or queues that are dropping packets. Separate reports are available for access ports and for network ports. The default display is a table showing queue, forwarding class, and ingress, egress, and total packet and octet dropped information.
Note: The report can be run for 7210 SAS NEs that do not support forwarding classes. For these NEs, the report will display N/A in the Forwarding Class and Queue columns.
For 7210 SAS network ports, only one of the following statistics can be collected at one time:
The columns for the statistics not being collected will display -1.
It is not mandatory to configure QoS for this report since the default QoS settings apply.
Use cases
SLA monitoring—Use the report to examine traffic drop patterns, to ensure SLAs are met.
Limitations
Minimum and maximum throughput aggregation cannot be compared with the minimum and maximum throughput values generated from raw granularity.
Prerequisites
The following table describes the aggregation rules that must be enabled and the accounting policies that must be configured for the NEs on which statistics are to be collected; see the NSP NFM-P Statistics Management Guide for information about configuring an accounting policy. To view the report for granularities other than raw data, the aggregation rules must be enabled; see How do I configure analytics aggregation?.
Table 14-45: Top N Packet Drop—Network Ports report prerequisites
|
Aggregator name |
Monitored object class |
Statistics class |
Statistics collection |
Details |
NE types |
|---|---|---|---|---|---|
|
Complete Network Ingress Packet Octets stats aggregator |
equipment.Port ethernetequipment.EthernetPortSpecifics lag.Interface |
CompleteNetworkIngressPacketOctets |
Accounting, file, and log policies |
completeNetIngrEg policy |
7450 ESS 7705 SAR 7705 SAR-H 7705 SAR Hm 7750 SR 7950 XRS |
|
Complete Network Egress Packet Octets stats aggregator |
equipment.Port ethernetequipment.EthernetPortSpecifics lag.Interface |
CompleteNetworkEgressPacketOctets |
Accounting, file, and log policies |
completeNetIngrEgr policy |
7450 ESS 7705 SAR 7705 SAR-H 7705 SAR Hm 7750 SR 7950 XRS |
|
Network Ingress Octets stats aggregator |
equipment.Port |
NetworkIngressOctets |
Accounting, file, and log policies |
netIngressOctet policy |
7210 SAS-D 7210 SAS Dxp 7210 SAS-E 7210 SAS-K 7210 SAS-M 7210 SAS-Mxp 7210 SAS-R 7210 SAS-S/Sx 7210 SAS-T 7210 SAS-X 7450 ESS 7705 SAR 7705 SAR-H 7705 SAR Hm 7750 SR 7850 VSA-8 7850 VSG 7950 XRS VSC |
|
Network Egress Octets stats aggregator |
equipment.Port |
NetworkEgressOctets |
Accounting, file, and log policies |
netEgressOctet policy |
7210 SAS-D 7210 SAS Dxp 7210 SAS-K 7210 SAS-M 7210 SAS-Mxp 7210 SAS-R 7210 SAS-S/Sx 7210 SAS-T 7210 SAS-X 7250 IXR 7450 ESS 7705 SAR 7705 SAR-H 7705 SAR Hm 7750 SR 7850 VSA-8 7850 VSG 7950 XRS VSC |
|
Network Ingress Packets stats aggregator |
equipment.Port |
NetworkIngressPackets |
Accounting, file, and log policies |
netIngressPkt policy |
7210 SAS-D 7210 SAS Dxp 7210 SAS-E 7210 SAS-K 7210 SAS-M 7210 SAS-Mxp 7210 SAS-R 7210 SAS-S/Sx 7210 SAS-T 7210 SAS-X 7705 SAR-H |
|
7450 ESS 7705 SAR 7705 SAR-H 7705 SAR Hm 7750 SR 7850 VSA-8 7850 VSG 7950 XRS VSC Note: SAS NEs use the network policy to retrieve stats at the FC level. They support only meters. | |||||
|
Network Egress Packets stats aggregator |
equipment.Port |
NetworkEgressPackets |
Accounting, file, and log policies |
netEgressPkt policy |
7210 SAS-D 7210 SAS Dxp 7210 SAS-K 7210 SAS-M 7210 SAS-Mxp 7210 SAS-R 7210 SAS-S/Sx 7210 SAS-T 7210 SAS-X 7250 IXR 7450 ESS 7705 SAR 7705 SAR-H 7705 SAR Hm 7750 SR 7850 VSG 7850 VSA-8 7950 XRS VSC |
Report characteristics
The following table lists the principal report characteristics.
